Evaluating the Pore Structure of Low Permeability Glutenite Reservoir by 3D Digital Core Technology
Abstract
In order to analyze the micro pore structure characteristics of low permeability glutenite reservoirs more intuitively and accurately, CT scanning imaging technology is used to evaluate the development characteristics of pores, fractures and high-density interstitial materials in the three-dimensional core space of samples, and the rock pore structure is analyzed from the perspective of image gray, homogeneity and pore throat connectivity. According to the maximum sphere algorithm, a digital core pore network model is extracted and established, and the probability distribution characteristics of pore radius, throat radius, pore throat ratio and core pore throat coordination number of different rock samples are studied. The results show that the reservoir space of the samples in the study area is dominated by dissolution pores and micro fractures, with pore radius ranging from 0.1 μm to 10 μm, throat radius from 0.1 μm to 7 μm, pore throat ratio from 0 to 4, and coordination number from 0 to 7. The overall pore throat ratio, throat radius and poor throat connectivity are the main reasons for the low core permeability in the study area. It is found that the 3D digital core technology can more accurately evaluate the internal heterogeneity of rocks, and the calculated pore structure parameters include both connected pore information and isolated pore information. Compared with conventional mercury injection and nuclear magnetic resonance, the 3D digital core technology has obvious advantages in the evaluation of rock micro pore structure.
Keywords
Digital core, Low permeability reservoir, Pore structure, Glutenite, Permian
Introduction
Pore structure is an important factor affecting the property of reservoirs. Accurate acquisition of pore structure parameters and microscopic pore structure research are important components of low permeability reservoir evaluation [1]. At present, the evaluation methods of rock microscopic pore structure in laboratory are mainly image observation [2-4] and experimental measurement [5,6]. The image observation method directly conducts qualitative observation and semi-quantitative statistics on the two-dimensional microscopic section of rocks by casting thin section and scanning electron microscope. This type of method is intuitive, but there are many human factors, and it is impossible to observe the distribution of pore structure in the three-dimensional space inside the rock. The experiment method mainly uses mercury intrusion and nuclear magnetic resonance experimental technology to obtain the capillary pressure curve and nuclear magnetic resonance T2 spectrum curve. The curves, which reflect the pore structure, are converted to obtain reservoir microscopic pore structure characteristic parameters. This method is mature and has high quantification degree, but it simulates the situation that external media effectively fills rock pores. Therefore, it is suitable for conventional reservoirs with good pore connectivity. Due to the large number of isolated pores in low permeability reservoirs, the experimental result has large errors. Furthermore, the experimental measurement method is not intuitive, and the core samples will be lost to some degree.
With continuing exploration and the complexity of geological targets, the requirements of reservoir evaluation are becoming more and more detailed. The traditional pore structure analysis methods (image observation and experimental measurement) have their own advantages and problems in describing reservoir pore types, shapes, connectivity and porosity, but qualitative analysis and quantitative evaluation cannot be carried out at the same time. X-Ray CT imaging technology implements 3D high-speed scanning imaging of rock samples. The scanning images are used for micro-nano CT analysis, numerical reconstruction, and 3D pore throat structure model of samples of different sizes. The pore throat structures in different directions are displayed on micron and nano scales, which can not only reflect the information of the whole structure but also evaluate the 3D characteristics of the inhomogeneity and micropore distribution of tiny pores. As a cutting-edge experimental method, CT scanning core 3D imaging has the advantages of nondestructive core measurement, direct observation of the characteristics of connected pores and isolated pores in three-dimensional space of pore structure, and high-precision calculation of three-dimensional space for different pore structure parameters. In recent years, it has been widely used in pore structure evaluation, especially in unconventional reservoirs such as shale oil, glutenite, low porosity and low permeability [7-9].
The lithology of the low permeability reservoir of Lower Permian Wuerhe Formation in Luliang Uplift of Junggar Basin is mainly glutenite with low matrix porosity. The statistical results of property analysis data show that the reservoir porosity is 5% ~ 19.1%, with an average of 8.42%, and the permeability is (0.014 ~ 1428.2) × 10-3 μm2, with an average of 2.78 × 10⁻³ μm2. According to the analysis data of the drilled cast sheet, the pore types of the reservoir are mainly residual primary intergranular pores and secondary pores, among which intragranular corrosion pores and intergranular corrosion pores are common, with a small number of cracks. The reservoir space types are granular dissolved pores - residual primary intergranular pores and pore - crack types, with poor connectivity of interparticle seepage channels. They have the basic characteristics of low porosity and low permeability reservoirs. Previous studies on glutenite reservoirs in this area mainly focus on regional structural characteristics [10], oil and gas occurrence [11] and reservoir-forming mechanism [12]. However, there is no report on using CT scanning technology to study pore structure. This paper introduces the technical method of micro-pore structure research of low permeability reservoir by using 3D digital core technology, and quantitatively extracts and calculates the pore structure parameters of the established visual network digital model, in order to provide technical support for the subsequent characterization of rock properties.
This paper is organized as follows. Section I introduces the principles of 3D digital core experiment. In Section II, a 3D model of the reservoir space and rock skeleton of low permeability glutenite reservoir is established by the image binary segmentation method, and the parameters of the pore structure are quantitatively calculated and extracted by a visual network digital model. In the last section, the experiment data are analyzed in detail to determine the types, characteristics and causes of low permeability glutenite reservoir space, so as to provide technical support for the basic research of rock properties of the target strata.
Methodology
Principle of CT core experiment
CT core scanning imaging technology can use an X-ray source to scan the fault of the core without damage, and obtain the gray image information of the two-dimensional section [13]. CT equipment is mainly composed of radioactive sources and detectors. The X-rays emitted by radioactive sources can penetrate non-metallic materials such as cores. The penetration ability of X-rays with different wavelengths is different. The storage space of rocks and the rock skeleton cause local density change of materials, which leads to changes in the absorption ability of X-rays with the same wavelength. According to Beer's theorem, the energy of X-ray decays exponentially when it passes through an object, and the intensity (I) of a radioactive source with initial intensity (I0) after it passes through an object is [14,15].
Where I0 and I are the initial energy before X-ray passes through an object and the residual energy after passing through it, respectively; I is the material component; di is the travel distance of X-ray through a certain component; μ is the attenuation coefficient (constant), which is related to the density and atomic number of the object, and is calculated as follows:
When I > 100 kV, the attenuation coefficient μ is mainly controlled by Compton scattering (E) of rays. When I < 100 kV, the coefficient is mainly controlled by the photoelectric absorption efficiency (Z) of the object. It can be seen from Equation 2 that the larger the attenuation coefficient, the stronger the attenuation of ray energy. Therefore, when the ray emitted by the radioactive source passes through the measured object with a certain density, the parameters such as intensity, speed and frequency of the ray will inevitably change and be recorded by the detector. If the X-ray passes through n units of length L along its path, each unit having the same length (dx), then we can obtain from Equation 1:
It can be seen from Equation 1 that X-ray scanning at different positions and in different directions of the detected object can result in different scanning data. Substituting the data into (Equation 3) gives projection data in different directions through iterations. Because X-ray has different absorption characteristics and attenuation coefficients for different objects, it is necessary to calibrate the measured object with general media (water and air). The relationship between CT number (H) and attenuation coefficient (μ) is as follows:
where μw is the attenuation coefficient of water, which is a fixed value of 1000, so the CT number (HW) of water is 0. The attenuation coefficient of air is μa = 0 and based on Equation 4 the CT number of air is Ha = -1000. That is, the X-ray energy will not affect the CT number of water and air, so other objects can be calibrated by the CT number of water and air. For geotechnical media, complex mineral components correspond to different attenuation coefficients, so different CT numbers can be calculated. The numerous CT numbers form the data set for constructing CT images.
3D digital core construction
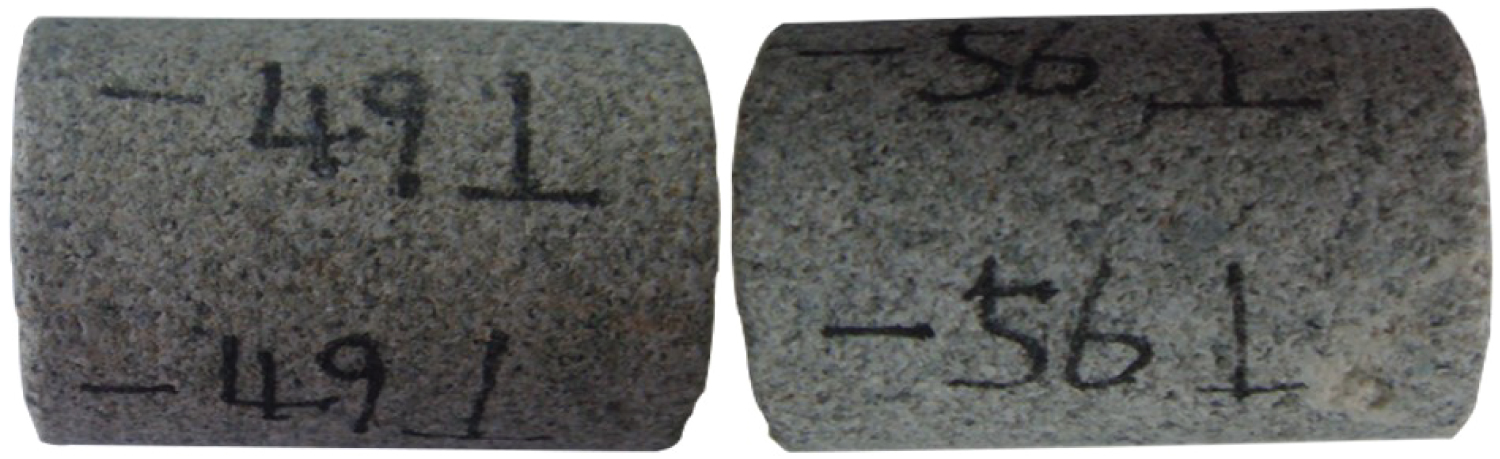
The CT scanning experimental data comes from well Ybei 4 in the work area. Samples number 49 and number 56 with pure lithology and regular shape are selected as examples to study the pore structure of low permeability glutenite reservoir. The porosity of Number 49 sample is 8.9% and the permeability is 0.33 × 10⁻³ um2; the porosity of number 56 sample is 7.7% and the permeability is 0.441 × 10⁻³ um2. The results of routine analysis of samples are distributed within the average range of the work area, and the experimental samples are representative in the area.
In order to best identify the porosity, a cylinder with a diameter of 2 mm is drilled in the plunger sample, in which the length of number 49 sample is 29 mm and that of Number 56 sample is 33 mm. The real rock sample is shown in (Figure 1). Though limited information is visible, it can be found that number 49 and number 56 rock samples are gray, fluorescent gravel fine sandstone. However, there is no way to investigate the interstitial property, mineral property, pores and the distribution of pores in three-dimensional space.
The establishment of a digital core model by using CT scanning technology is divided into three steps. The first step is to obtain the multi-directional CT projection through CT experiment. The second step is to reconstruct the core gray image from multi-directional CT data sets. The third step is to use computer image segmentation method (gray image binary segmentation method) to separate and color the pore space and the rock skeleton in the gray image, and to build a digital core.
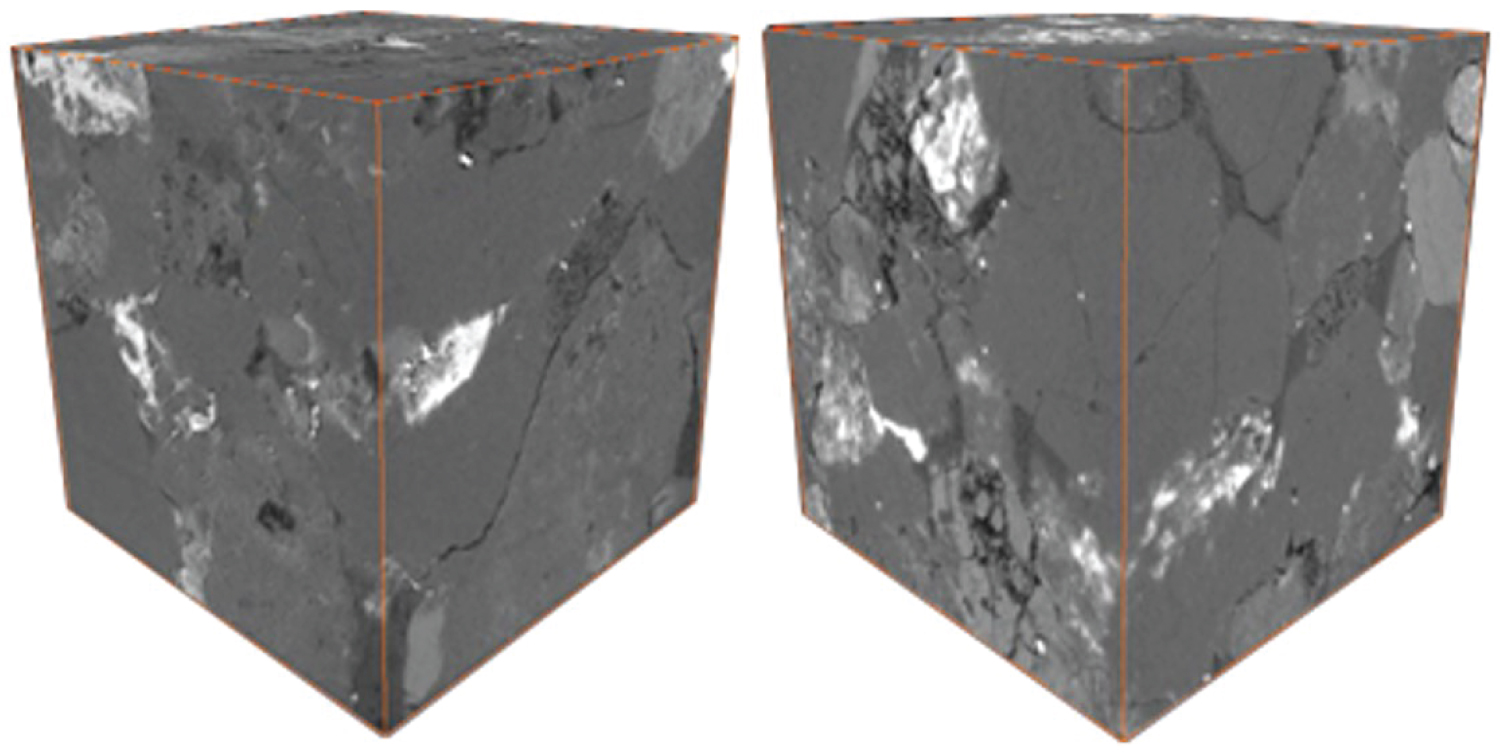
Two rock samples were scanned with a resolution of 1um/voxel, and 3D digital core 3D gray images were established by PerGeos digital data analysis tool. The pore space development, mineral property and filling property of the core were analyzed, as shown in (Figure 2).
It can be seen that qualitative analysis of the core can be carried out by applying the rock CT analysis method combined with the image gray observation image. The change of the gray value of digital core images from gray to white reflects the change of local density of the core, which is caused by different types of minerals. Therefore, the change of gray value of each image, in theory, represents a specific type of mineral. However, the density distinction of each component among different mineral types is not obvious, so it is not easy to distinguish in the image. When the mineral types are different (such as clay and dolomitic), the density is quite different, which can cause obvious gray changes in the picture. Therefore, image qualitative analysis can determine the dominant mineral or the type of filled matter. For example, in Figure 2, the area with higher brightness (white) is the cuttings with higher density, but it is impossible to accurately distinguish their components.
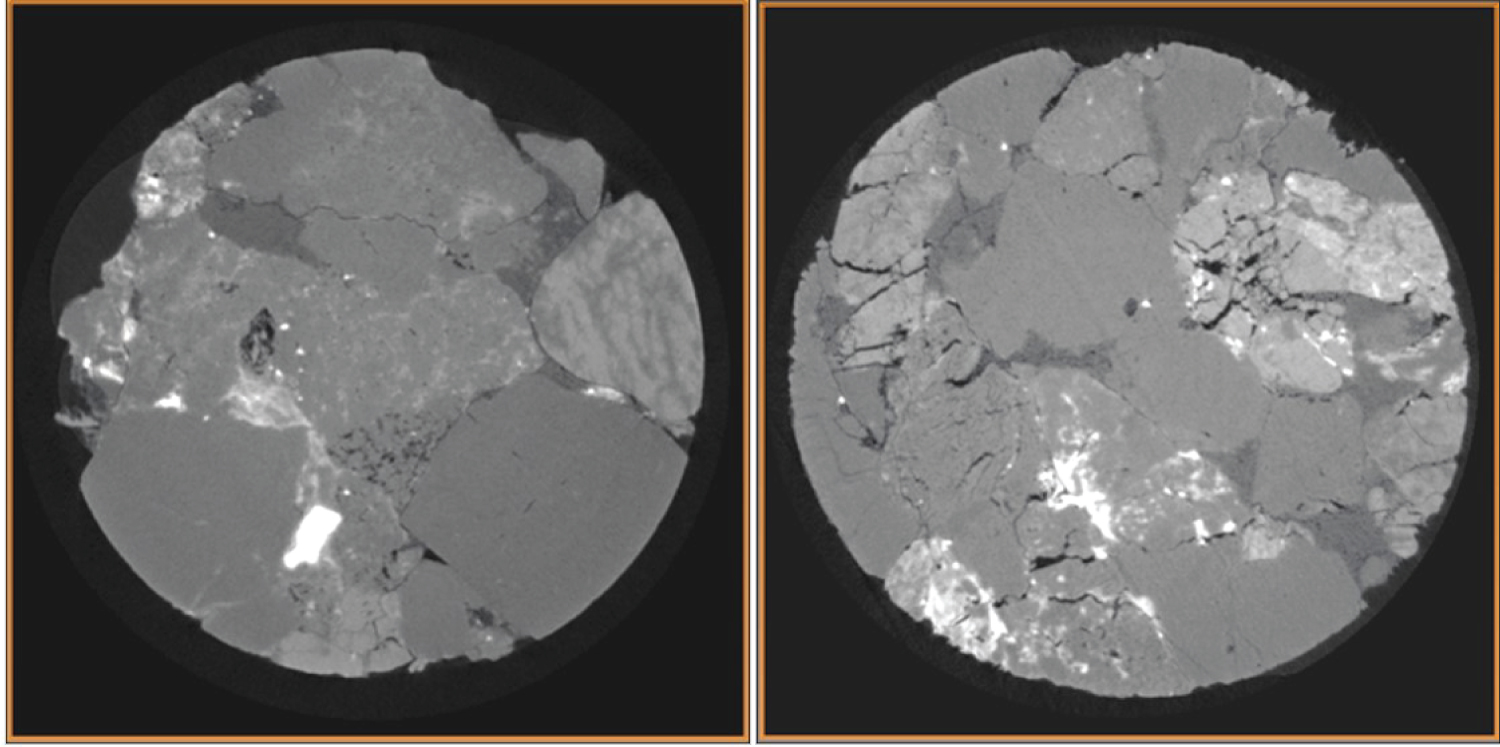
By cutting any section of the 3D digital core image, the pore structure, pore type and the distribution characteristics of fillings in 2D plane can also be obtained. The two-dimensional gray section of the rock sample can show the development degree of micro-cracks in the rock sample. (Figure 3) is the two-dimensional section of the 3D digital core of number 49 and number 56 samples. From the figure, it can be seen that the cracks in the rock samples are well developed, and the gray characteristics show that the core has strong heterogeneity and there are intergranular pores at the same time. However, most of them are filled by various interstitial matters, and their micro-pores are developed. Therefore, it is concluded that the pore space of rock samples is a double pore system composed of cracks and micro-pores. From the core photo in Figure 1, it is impossible to observe the crack development and fillings in the core. It can be seen that the core analysis by CT can detect the internal structure of the core undamaged, which provides more reliable basis for qualitative analysis.
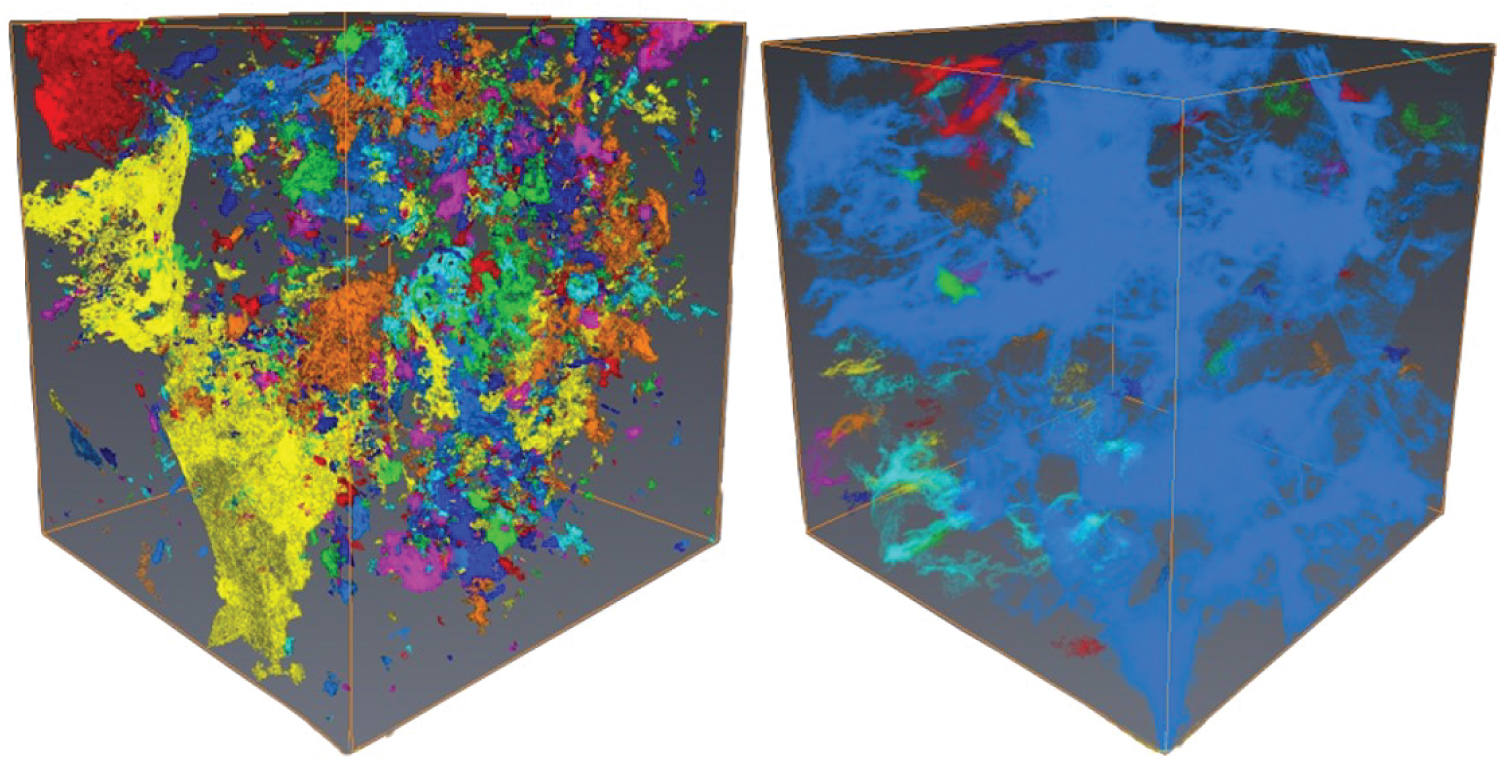
Based on the 3D grey degree of core established by X-ray CT, through digital image processing technology, the distribution characteristics of three-dimensional space of different components in rock are obtained. Then, the pore space of rock is identified, and the pore connectivity is analyzed. (Figure 4) is a visual pore distribution diagram of rock samples in three-dimensional space. The transparent part in the diagram is the rock skeleton. The colors indicate the degree of pore connectivity. The greater the color change, the stronger the core heterogeneity and the worse the pore connectivity. It indicates that the more complex the pore structure of rock reservoirs, the stronger the heterogeneity and the poorer the connectivity. It can be seen from the figure that the pore connectivity of number 56 sample is obviously better than that of number 49 sample, and the permeability of number 56 sample is higher than that of number 49 sample from conventional analysis. In addition, 3D digital core shows that there are a large number of micro-cracks in the pore space, as shown in the yellow area of number 49 sample in Figure 4, which leads to extremely strong heterogeneity of pores and anisotropy of rock properties.
Results and Discussion
In the process of reservoir evaluation, the study of microscopic pore structure is the key of microscopic properties of reservoirs. The distribution characteristics of pores and throats and their relationship have significant influence on the reservoir performance and physical characteristics. Experiments show that 3D digital core analysis technology has obvious advantages compared with the traditional methods such as electron microscope scanning, mercury intrusion and nuclear magnetic resonance. It can make qualitative analysis and quantitative evaluation on the size and connectivity of pore space in complex reservoirs.
In this paper, the pore network model is used to analyze the pore structure. The basic idea is to extract structured pore and throat models from the 3D digital core image after threshold segmentation by mathematical algorithm to represent the pore space. The "maximum sphere" algorithm is the main method to extract 3D digital core pore network model at present [16-19]. It is assumed that a sphere is placed in each pore (including throat), and it has a largest possible diameter, so the pore space will be represented by the sphere with the largest size. The throat is a connected structure with a certain length, and the throat structure is characterized by interconnected balls with a smaller diameter. Similar to tubular structures, the number of tubular structures connected by each "largest ball" is the coordination number. Finally, the pore space of 3D digital core can be simplified to a "spherical tube model" with pore and throat as units.
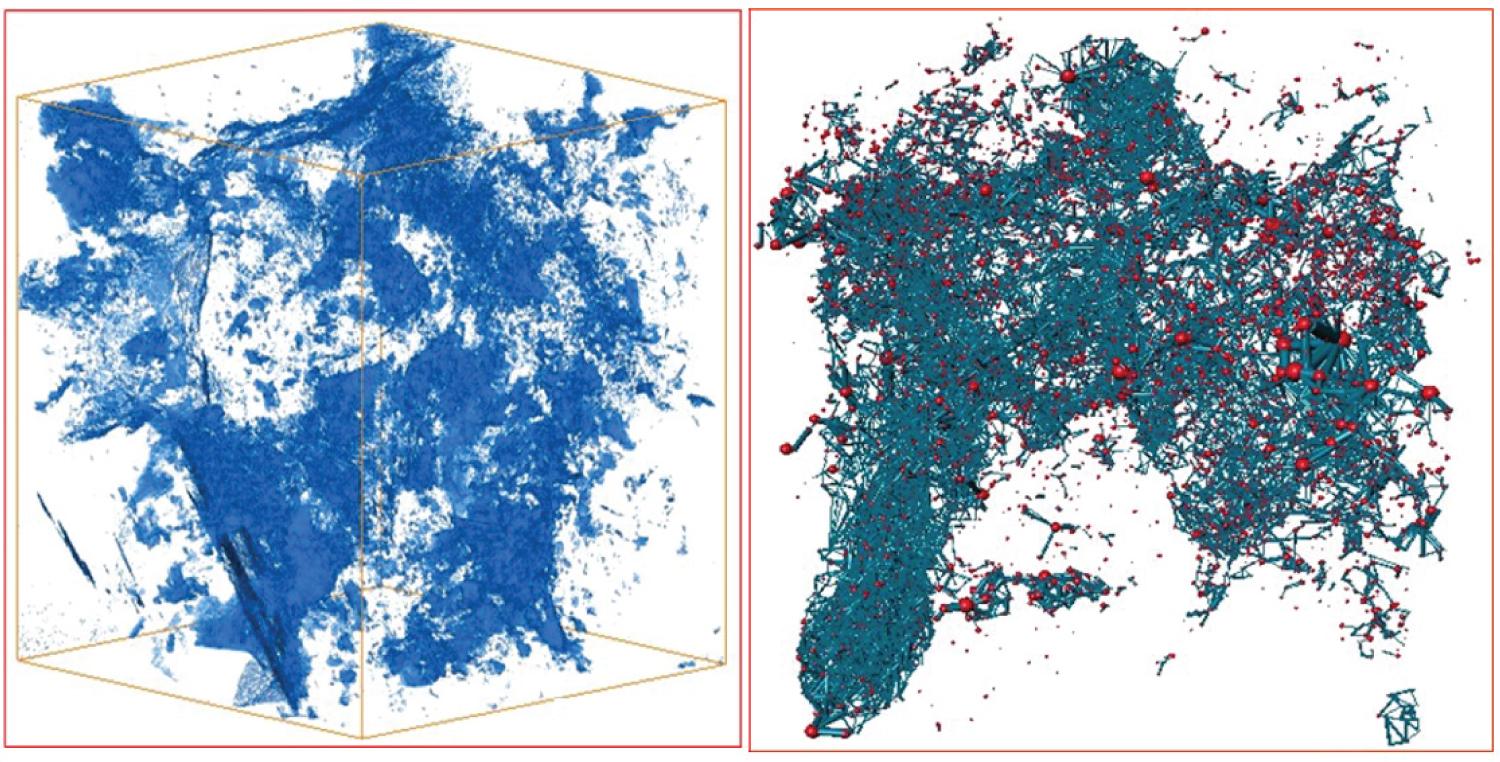
Based on the pore space shown in 3D core (Figure 5) and rock microscopic pore structure analysis established by X-ray CT, the pore network model is extracted by using the maximum sphere algorithm. In the pore network on the right side of Figure 5, the red is pore body, and the green is throat. Based on the established digital core model, the pore space in the sample can be clearly extracted, the parameters such as porosity and permeability of the sample can be calculated, and the characteristic parameters (pore radius, throat radius, pore throat ratio, and shape factor) can be counted.
Porosity is the percentage of pore space in the total volume of the sample, which is expressed as
where φ is porosity (%), vp is the pore volume, and vb is the total volume.
In the 3D digital core model, for the continuous part, the pore volume is
For the discrete part, the pore volume is
The total volume of the sample is
Combining the above equations, the porosity of digital core samples can be obtained.
Pore radius is an important parameter to measure the size of a single pore. When the pore is a regular circle, the radius of the "maximum sphere" can be regarded as the pore radius, and at this point, a sphere can fill the pore. However, the spatial shape and structure of the pores are complex. When the pores are irregular, two or more overlapping "maximum sphere" are needed to make the pores filled to the maximum extent. In this case, the pore radius should take the middle value of the radii of two adjacent balls.
Throat radius is an important parameter to calculate the critical seepage pressure of fluid flowing through the throat, and it is the basis to evaluate the pore structure of reservoirs as well. The throat radius is also calculated by the "maximum sphere" filling the throat space, which is the radius of the largest sphere placed there.
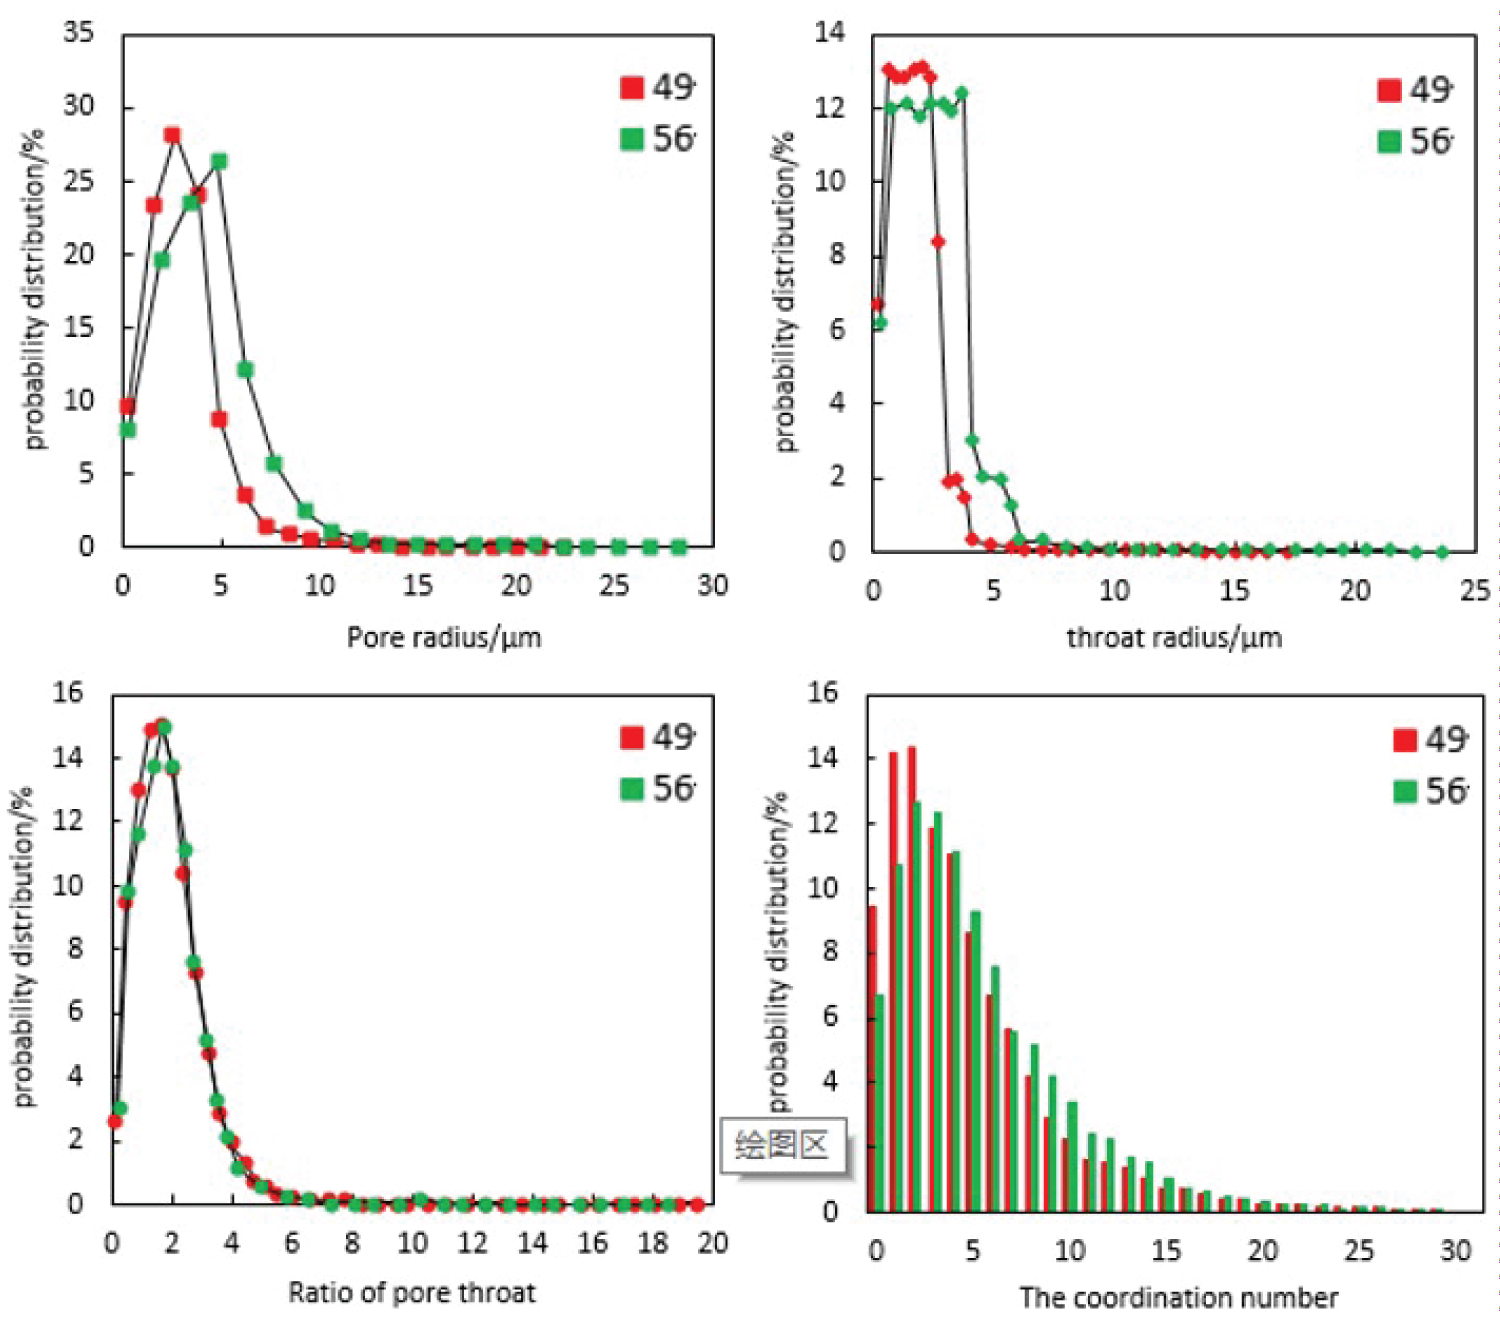
Pore structure characteristic parameters such as pore-to-throat ratio, shape factor and coordination number can be extracted according to the distribution of pores and channels that have been determined in the pore network model. The evaluation of rock pore structure can be divided into qualitative and quantitative aspects. The qualitative evaluation indexes include the development characteristics of pores, cracks and high-density fillings, which are obtained from 3D gray images and 2D sections scanned by CT. Quantitative evaluation is to obtain the characteristic parameters of the rock pore structure. The experimental parameters of the rock pore structure are used to analyze the microscopic pore structure of reservoirs. (Figure 6) shows the probability distribution of pore radius, throat radius, pore-to-throat ratio and the pore throat coordination number for number 49 and number 56 samples.
It can be seen from the figure that the pore radius of number 49 sample is 0.1 ~ 7 μm, and the pore radius of 2.5 μm accounts for the largest percentage, reaching 28%. The throat radius is 0.1 ~ 4 μ m, and the throat with a radius of 1 ~ 3 μm accounts for the largest percentage, around 13%. The pore-to-throat ratio of this sample is 0.1 ~ 4, and most of the samples have a ratio of 2. The coordination number (the number of throats connected with a pore) is predominantly between 0 and 15, and the cumulative proportion is about 37.5% when it is 0 to 3. The pore radius of number 56 sample is 0.1 ~ 10 μm, and the pore radius of 5.5 μm accounts for the most, reaching 26%. The throat radius is 0.1 ~ 6 μ m, and the throat with a radius of 1 ~ 5 μm accounts for the most, about 12%. The pore-to-throat ratio of this sample is 0.1 ~ 4, and the ratio of most samples is 2.5. The coordination number is predominantly between 0 and 15, and coordination number of 1 to 6 accounts for about 56%.
The results show that the pore structure parameters and the distribution patterns of the two independently extracted samples have little difference, which indicates that the experimental results are not random. The pore radius and throat radius of number 56 sample are larger than those of number 49 sample. The pore-to-throat ratio of number 56 sample is slightly larger than that of number 49 sample, and the coordination number of number 56 sample is obviously higher than that of number 49 sample. This reveals that the pore structure of number 56 sample is better than that of number 49 sample, and the pore-throat connectivity of number 56 sample is slightly better. Comprehensive comparison demonstrates that the tight reservoir has poor pore connectivity and low coordination number. Because the main pore space of rock is microfractures, the pore-to-throat ratio is small and the pore radius is small. These factors are the main reasons for the low permeability of the reservoir. According to the conventional property analysis, the porosity of number 56 sample is 7.7%, the permeability is 0.441 × 10⁻³ um2, and the permeability of the sample is slightly higher than that of number 49 sample of 0.33 × 10⁻³ um2. The results of CT scanning pore structure analysis are in good agreement with the conventional experiment, which shows that the porosity and permeability of tight reservoirs are inconsistent and the permeability is mainly controlled by the pore structure. According to the conventional property analysis, the porosity of number 56 sample is 7.7%, and the permeability is 0.441 × 10⁻³ um2, slightly higher than that of number 49 sample (0.33 × 10⁻³ um2). It indicates that the porosity and permeability of the low permeability glutenite reservoir are inconsistent, and the increase of porosity results in decreased permeability. The analysis of digital core experiment results demonstrates that the permeability of low permeability glutenite reservoir is greatly influenced by pore structure.
Conclusion
The low permeability glutenite reservoir has various pore types, and it is difficult to characterize the pore structure. The 3D digital core technology can obtain the three-dimensional distribution and connectivity of pore throats without damaging the internal structure. Besides, it can accurately locate the connected pore throats and isolated pore throats of different size samples and analyze the pore structure parameters quantitatively. In this paper, the 3D digital core technology is employed to analyze the pore structure of low permeability reservoir qualitatively and quantitatively. It is found that the reservoir space is a dual pore system composed of fractures and micro pores. The main reasons of "low permeability" of the reservoir are the low coordination number, small pore-throat ratio, small pore radius, and poor connectivity.
Funding
This study was funded by Major science and technology project of Petro China "evaluation me key technology of low permeability conglomerate reservoir and its industrial application" (NO.2020T-007-002).
Declaration of Competing Interest
The authors declare that they have no known competing financial interests or personal relationships that could have appeared to influence the work reported in this paper.
Highlights
1. This paper uses the image binary segmentation method to separate the gray images of CT scans of glutenite cores, and the pore space and skeleton of different rocks are characterized. And 3D gray images of 3D digital cores are constructed by PerGeos.
2. The pore network model is used to analyze the reservoir pore structure, and the characteristic parameters of pore structure (such as pore radius, throat radius, pore-throat ratio, shape factor and coordination number of rock) are extracted, and the porosity and permeability are calculated to quantitatively evaluate the pore structure.
3. The experiment data reveal that the main pore space of low permeability glutenite reservoir in the study area is micro-pore, with low pore coordination number, small pore-throat ratio, small pore radius and poor pore connectivity. These characteristics contribute to the low permeability reservoir, which has no obvious law of porosity and permeability, and its permeability is mainly affected by pore structure.
References
- Wang Wei, Cai Yu Na, Liu Jie (2019) Quantitative research scheme and application examples of 3D microstructure of rocks. Geoscience frontier 26: 55-66.
- Geng Chong, Yang Yongfei, Gao Ying (2014) Optimization processing method of rock CT images with different resolutions. Sci Technol Eng 14: 1-4.
- Lin Chengyan, Wu Yuqi, Ren Lihua, et al. (2018) Research status and prospect of digital core modeling method. Prog Geophys 33: 679-689.
- Sheng Jun, Yang Xiaojing, Li Gang, et al. (2019) Application of digital core technology based on multi- scale X-CT imaging in the study of micro pore structure of carbonate reservoir. Mod Geol 33: 653-671.
- Liu Xiangjun, Zhu Honglin, Liang Lixi (2014) Digital petrophysical experiment of sandstone based on Micro CT technology. Acta geophysica Sinica 57: 1133-1140.
- Li Yilin, Zhang Yunfeng, Cong Lin, et al. (2016) Application of X-CT scanning imaging technology in characterization of micro pore structure of tight sandstone: A case study of fuyu reservoir in Da'an oilfield. J Jilin Univ (Geo Edn) 46: 379-387.
- Zhang Hao, Chen Gang, Zhu Yushuang, et al. (2017) Quantitative characterization of micro pore structure of tight oil reservoir: A case study of chang 7 reservoir in xin'anbian oilfield, ordos basin. Mar Pet Geol 39: 112-119.
- Ju Y, Gong W, Chang C, et al. (2017) Three-dimensional characterization of multi-scale structures of the silurian longmaxi shale using focused ion beam-scanning electron microscopy and reconstruction technology. J Nat Gas Sci Eng 46: 26-37.
- Wu Y, Tahmasebi P, Lin C, et al. (2019) Effects of micropores on geometric, topological and transport properties of pore systems for low-permeability porous media. J Hydrol 575: 327-342.
- Guan Wei (2019) Structural characteristics of permian triassic unconformity in luliang uplift belt of junggar basin. China University of Petroleum (Beijing): 1-69.
- Zheng Menglin, Fan Xiangdong, He Wenjun, et al. (2019) Superposition evolution of deep geological structure and hydrocarbon occurrence in Junggar Basin. Geosci Front 26: 22-32.
- Zhu Chuanzhen (2017) Accumulation mechanism and model of distant lithologic reservoirs in Junggar Basin. Master Dissertation, Shandong University of science and technology 5-85.
- Lin Chengyan, Wang Yang, Yang Shan, et al. (2018) 3D modeling of digital core based on CT. J Jilin Univ (Earth Sci Ed) 48: 307-317.
- Sheppard A, Lathams Middleton J, et al. (2014) Techniques in helical scanning, dynamic imaging and image segmentation for improved quantitative analysis with X-ray micro-CT. Nucl Instrum Methods Phys Res 324: 49-56.
- Sun Wei, Shi Chengen, Zhao Jingzhe, et al. (2006) Application of X-CT scanning imaging technology in the study of micro pore structure and seepage mechanism of ultra-low permeability reservoir: Taking chang 82 reservoir in zhuang 19 well block of Xifeng oilfield as an example. Acta Geol 80: 775-790.
- Curle (2014) Modeling and application of 3D digital core based on low permeability reservoir. Eng Sci Tech 1.
- AI Kharusi AS, Blunt MJ (2006) Network extraction from sandstone and carbonate pore space images. J Petrol Sci Eng 56: 219-231.
- Mayo S, Josh M, Nesterets Y, et al. (2015) Quantitative micro-porosity characterization using synchrotron micro-CT and xenon K-edge subtraction in sandstones, carbonates, shales and coal. Fuel 154:167-173.
- Wang Chenchen, Yao Jun, Yang Yongfei, et al. (2013) Study on resolution selection of digital core based on CT scanning method. Sci tech eng 13: 1049-1052.
Corresponding Author
Huang Changbing, School of Environment and Resources, Southwest University of Science and Technology, Mianyang, Sichuan 610500, China, Tel: +86-18990269862
Copyright
© 2022 Qing Z, et al. This is an open-access article distributed under the terms of the Creative Commons Attribution License, which permits unrestricted use, distribution, and reproduction in any medium, provided the original author and source are credited.