Impact of Prepolymerization Monomer on Polymerization and Properties of LLDPE
Abstract
One of the methods of synthesis of linear low-density polyethylene is the use of pre-polymerization method. In this research, propylene, 1-butene and ethylene were used as prepolymers at 35 ℃. Also, various tests were performed to analyze the obtained polymers by pre-polymerization method. The results obtained in the melt flow index test showed that ethylene monomer had the lowest value. It also had the better properties.
Keywords
Linear lightweight polyethylene, Polymerization analysis, Melt flow index, Differential scanning calorimetry
Introduction
Polyethylene, in fact, has the highest production volume among polyolefins [1]. Lightweight linear polyethylene resins, a category of polyethylenes, are considered as one of the main products in the world with an annual production of 26 × 106 tons [2]. Ethylene homopolymer or its copolymers, with a maximum content of 20% of other comonomers, such as 1-butene, 1-hexane, etc., are widely used in the industry, in the form of fibers, films and bottles. This wide application is mainly due to their high chemical resistance, flexibility, low density, sufficient mechanical properties, and low price [3].
The largest market for linear lightweight polyethylene resins is film applications, which marks them in the production of bags or industrial sheets. The second largest market for LLDPE resins is injection molding, which is often used to produce products such as kitchen utensils. These resins are also used in blow molding, in which case they can be used in the production of bottles.
Another application of linear lightweight polyethylene resins is their rotational molding capability, which can be used in the production of toys, large tanks, and etc. Due to the wide range of applications and also the wide range of advantages of linear lightweight polyethylene resins, various researches have been carried out annually in order to increase their quality and improve their usability.
Linear lightweight polyethylene resins are copolymers of ethylene and alpha-olefins with low alpha-olefin content. Their density range is between 0.915 and 0.925 g/cm3. These resins are quasi-crystalline and produced by catalytic copolymerization reactions. The differences between various LLDPE resins can be described as: (1) Alpha-olefin type used in copolymerization with ethylene (1-butene, 1-hexane, 4-methyl-1-pentene or 1-octene) [2,4]; (2) The amount of alpha-olefin present in the copolymers (between 2 and 3.5 mol%); (3) The density and degree of the crystallinity; And (4) Structural uniformity of copolymers.
LLDPE resins are manufactured in the industry using three different classes of catalysts: Ziegler-Nata catalysts based on titanium compounds, metallocene catalysts and Philips catalysts based on chromium oxides. In addition, these resins are produced by three different types of polymerization processes in order to be economically affordable: gas phase polymerization, solution polymerization, and slurry polymerization. Large companies around the world have used each of these processes [2]. For example, Lundell Basel uses the gas process, Dow Chemical uses the solution process, and Chevron Phillips uses the slurry process.
After many struggles in selecting the most suitable and efficient process for the production of linear lightweight polyethylene resins, the gas phase process is selected as the best option due to its many advantages, which is supported by the worldwide statistics. Nevertheless, there are several crucial disadvantages associated with this process. One of them is the particle agglomeration during the gas phase polymerization process which prevents the fluidity of the particles, resulting in heterogeneous mixing of particles in the fluidized bed and finally blocking the reactor outlet [5] or the formation of fine polymer particles (particles smaller than 0.3 mm) which strongly affects the final product quality [6]. To solve these problems, the use of a process called pre-polymerization process prior to the entering of the monomers and catalyst to the main reactor is proposed [7-12].
In order to achieve the desired result, the dependent parameters must be set in the optimal case. The pre-polymerization process is also a function of various variables such as temperature, pressure, time, type, and amount of the comonomer and etc. In the present paper, propylene, ethylene and 1-butene were used as pre-polymerizing materials and various tests such as melt flow index and differential scanning calorimetry were performed to analyze the polymers obtained by the pre-polymerization process.
Experimental
Materials
The materials used in this study are listed below:
Ziegler Nata Catalyst (SP1), Distilled hexane, heavy polyethylene unit, Triethyl aluminum cocatalyst (25%), Mineral oil to disperse the catalyst, Ethylene monomer, Hydrogen gas as a chain transfer agent and molecular weight controller, Inert nitrogen gas to clean the reactor, Commonomer 1- Butene and propylene, Electron donor C. The samples for this study were prepared according to Table 1.
Apparatuses
Glove box is a large transparent metal box attached to the main box which is a small box called a transfer box. The materials and tools were placed firstly in the transfer box, before placing in the glovebox, under nitrogen gas flow for 40-45 minutes to ensure that there is no contamination transferred to the glovebox. Inside the glovebox, there were containers of phosphorus pentoxide (water absorbent). Reactor with the following specifications was used for the polymerization: Reactor volume: 1.6 liters, Jacket volume: 0.4 liters, Operating pressure: 60 bar, Test pressure: 114 times, Design temperature: 250 ℃, Stirrer speed: 2500 rpm, Tank material: chromium-nickel-molybdenum alloy.
To inject hydrogen during ethylene polymerization, a controller was used. It was also used to inject ethylene, as well. A ventilated hood was used for initial drying and solvent removal. After evaporating the majority of the solvent, the samples were transferred to the oven to remove the rest of the solvent. A vacuum oven was also employed in order to remove the trace amount of solvent that remains in the dried polymer. To prevent corrosion of the components by the solvent, especially the oven seals, a vacuum oven was used. An ordinary oven was used to remove moisture from the glassware.
Calorimetric method (using Differential Scanning Colorimetry-DSC) was performed to measure the melting point and crystallization percentage of polymers. In the present study, this device was used to investigate the melting and thermal stability of the sample before the MFI (Melt Flow Index) test in order to prevent the retention of high molecular weight samples (lower hydrogen percentage) in the MFI device. Also, in order to determine the thermal stability of the samples, DSC test (METTLER TOLEDO-DSC822e) with a speed of 1 min/℃ was performed on some of the samples. MFI (Melt Flow Index) is one of the important parameters used in the evaluation of the obtained polymer. MFI is an estimation of the average molecular weight of polymers. It is a commonly used test in the industry mainly because of the high cost of GPC (Gel Permeation Chromatography) test. Although, it is a cheap and also fast test, clearly does not have the accuracy of the GPC test. According to the ASTM D1238 standard, MFI test is usually performed for polyethylene a temperature of 190 ℃ and a load of 2.16 or 5 kg. In addition, MFR, which is the ratio of two MFIs with different loads is sometimes reported to be a qualitative estimation of the polymer molecular weight distribution. The device used to test the samples in this study was Göttfert MI-4.
Methods
Solvent drying: Due to the sensitivity of Ziegler-Nata catalysts to moisture, the solvents must be removed almost completely (H2O < 5 ppm). For this purpose, a sufficient amount (250 to 300 g) of the molecular sieve (Å3) was added to 900 ml of solvent. The mixture was mixed for 10 minutes and kept for 24 hours to have the molecular particles participated. The solvent was removed from the sample by absorbing the water content in the samples by means of the molecular sieve. The Karl Fisher device was employed in order to calculate the samples moisture. The initial moisture of hexane was equal to 9 ppm, which it was decreased to less than 4 ppm after drying.
Suspension catalyst preparation: 0.6 g of Ziegler Nata SP1 catalyst and 30 cc of mineral oil were mixed and stirred in a 50-cc round bottom balloon for 24 hours until the catalyst is completely dispersed in the oil. Then, for each use of this suspension, the desired amount was stirred again 2 hours before the use inside the glovebox to be then added to the reactor.
Pre-polymerization: All pre-polymerization processes were performed at a pressure of 12 bar, stirring speed of 200 rpm, molar ratio of aluminum to titanium of about 600, and weight ratio of the co-catalyst to the external electron donor of about 5. In general, a summary of the pre-polymerization process conditions is given in Table 2.
Pre-polymerization process: Also, the pre-polymerization process was performed in the following steps: for 40 minutes, the reactor was cleaned at a temperature of 88 ℃. The reactor was purged 6 times with nitrogen gas at 9 bar pressure. The reactor was then purged with nitrogen for 15 minutes at 92 ℃. Then the reactor was vacuumed for 3 minutes. The reactor temperature was then reduced to 15 ℃ below the pre-polymerization temperature. 670-650 cc of normal hexane was added to the reactor under nitrogen gas.
The reactor was vacuumed for two minutes. Co-monomer (propylene, ethylene or 1-butene) or a combination of the two monomers was added to the reactor discontinuously if required. The stirrer was turned on at 500 rpm. The temperature was increased to the desired pre-polymerization temperature (20-30 ℃). Monomer (propylene, ethylene or 1-butene) with the desired amount or at a certain partial pressure (about 15 to 55 MPa for ethylene) was injected into the reactor. The contents of the reactor were mixed for 10 minutes at about 500 rpm. Afterward, the co-catalyst was added. The selected SP1 TiCl4/MgCl2 catalyst suspension (by dispersing the catalyst powder in 50 ml of dry normal hexane) was added to the reactor. Pre-polymerization was stopped after the desired time (30-50 minutes). The remaining monomer was discharged, and the reactor was purged under nitrogen/ethylene/hydrogen gas if necessary.
Ethylene polymerization: Polymerization was performed in a 1.6-liter Buchi reactor equipped with a mechanical stirrer, hot water jacket and temperature, pressure and torque controllers. The reactor was equipped with several free ducts used to inject catalyst, co-catalyst, etc. All gases and liquids used in polymerization, including ethylene, hydrogen, normal hexane, etc., were dried and dehumidified by passing through the molecular columns before entering the reactor, if necessary. For the polymerization process, the following steps were taken: The reactor temperature was increased to the original polymerization temperature (about 70 ℃ - 65 ℃). The required amount of hydrogen (about 3 MPa) was injected into the reactor to control the molecular weight. The required amount of 1-butene co-monomer was injected into the reactor by adding the monomer with the desired pressure (about 5 MPa ethylene). Polymerization stopped after a specified time (about 1 hour). The synthesized polyethylene powder was dried at 80 ℃ in the oven (about 24 hours).
Determining the polymerization yield and the catalyst activity: The polymerization yield was calculated based on the amount of polyethylene produced (in grams) per unit weight of titanium used in the catalyst (in milligrams). By normalizing the efficiency obtained for pressure and time, the catalyst activity was also calculated (Equation 1 and Equation 2).
Results and Discussion
Melt flow index
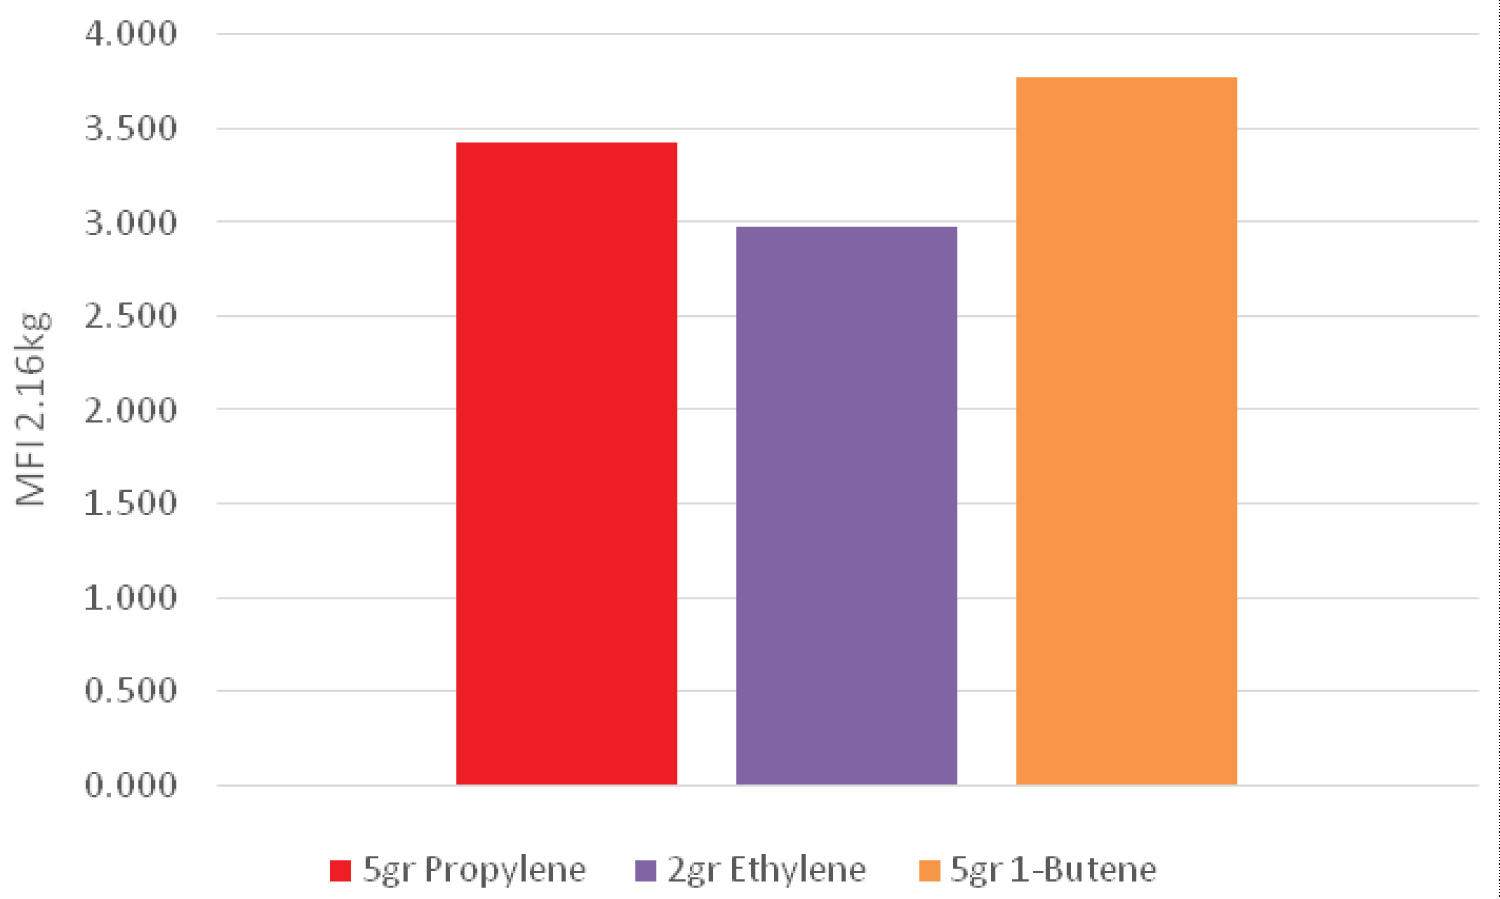
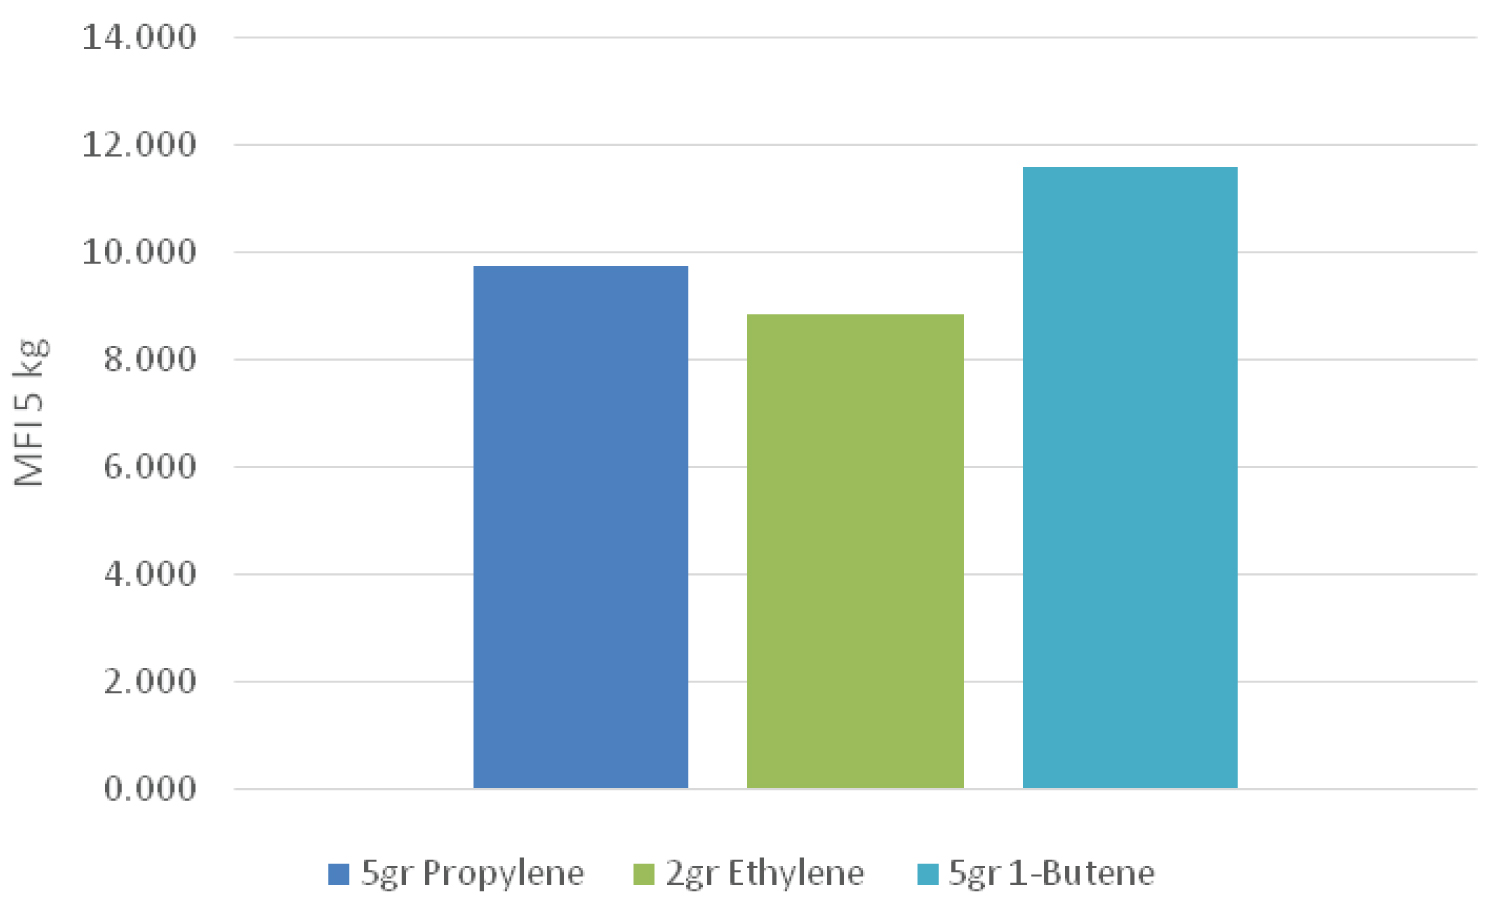
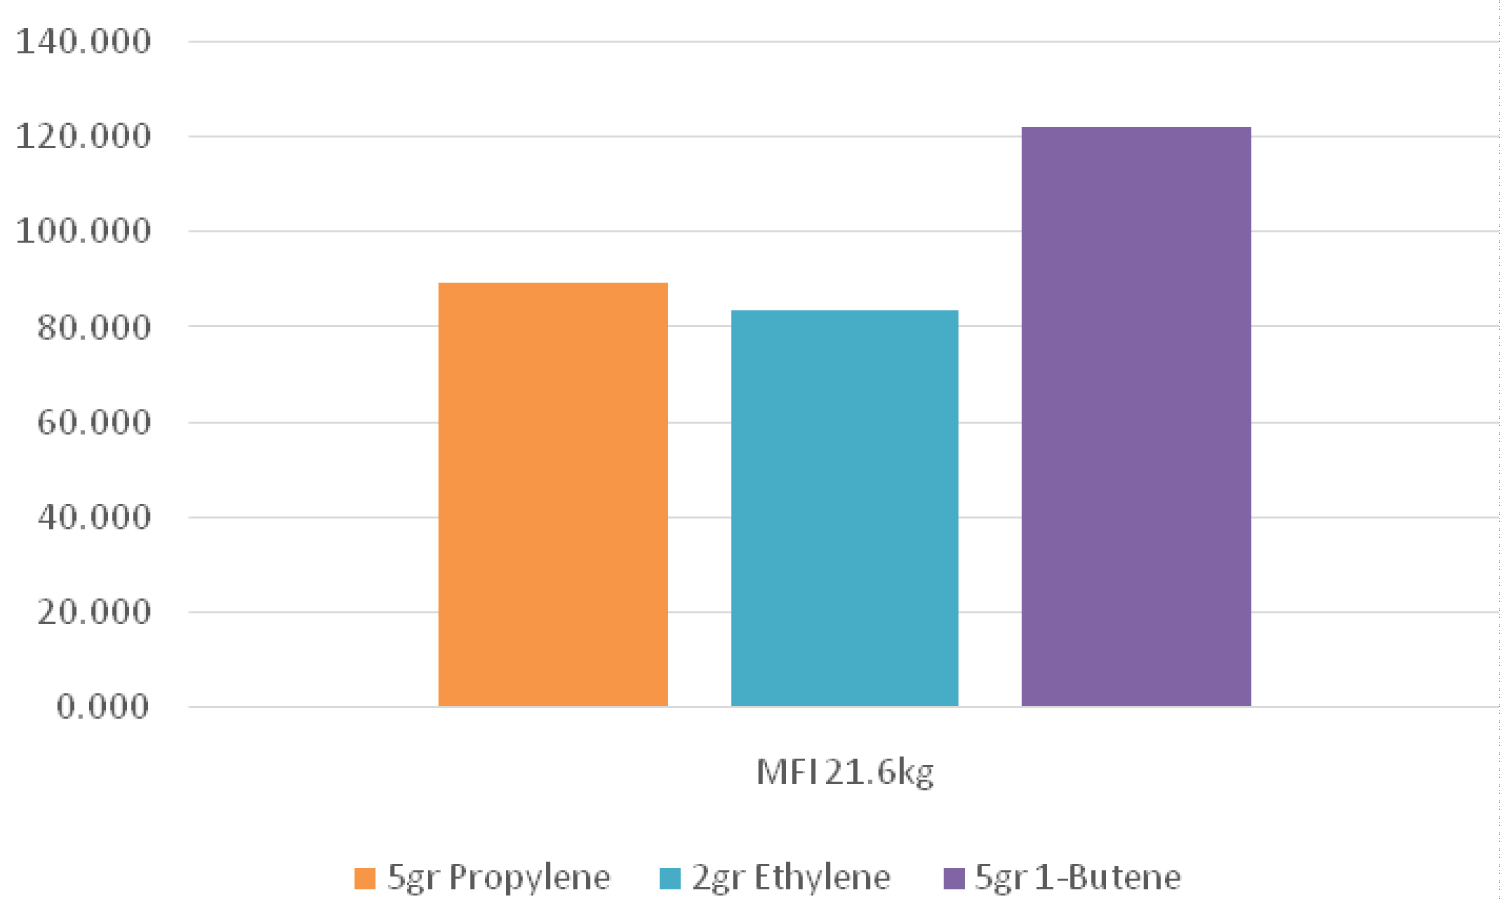
Melting flow rate can be used as a criterion for the initial evaluation of the flow characteristics of polymers. It is indirectly a measure of the molecular weight, i.e., the higher molecular weight of the polymer (longer chain), the lower the MFI due to the greater entanglement of the polymer chains. The MFI determination test is used for detecting different grades of a polymer, controlling the quality of relatively low viscosity thermoplastics, and classifying them. The velocity of the melt flow is inversely proportional to the viscosity of the melt under test conditions, although it should be kept in mind that the viscosity for each material depends on the applied force. Also, the ratios between two melt flow velocities for a material using different weights can be a measure of the width of the molecular weight distribution. In the present study, three different weights (2.16, 5 and 21.6 kg) were used (Table 3).
Figure 1, Figure 2 and Figure 3 demonstrate the value of melt flow index in three different weights for a sample which had a higher amount of 1-butene in the pre-polymerization process than that of the other samples. Therefore, it can be concluded that the sample containing 1-butene had a lower molecular weight than that of the other samples. However, when ethylene was used in the pre-polymerization process, it caused a lower melt flow index and therefore a higher molecular weight between different samples.
However, in case of adding 1-butene as well as propylene in the pre-polymerization process the melt flow index value of a sample only containing propylene became higher. Therefore, the sample had lower molecular weight. It seems that adding 1-butene to the pre-polymerization process led to an increase in the growth rate of active nuclei in the pre-polymerization system. Moreover, when ethylene was used in addition to propylene in the pre-polymerization process, the melt flow index increased at different weights, which means that the molecular weight of the polymer decreased. As mentioned before, in a pre-polymerization system containing propylene, adding 1-butene decreased the melt flow index, so the resulting polymer had a higher molecular weight.
Table 4 lists the ratio between the two melt flow indices of the samples which is a measure of the molecular weight distribution width. As can be seen, the melt flow index ratio had the highest value for a sample containing 1-butene, so this sample had the highest molecular weight distribution compared to other monomers. Using 1-butene in the prepolymerization system led to a decreased the ratio of melt flow index for this sample. Therefore, the molecular weight distribution was also reduced.
However, adding 1-butene or ethylene to the pre-polymerization system containing 5 g of propylene increased the ratio of melt flow index of a sample containing 1-butene at lower weights. So, it can be concluded that 1-butene increases the molecular weight distribution. Conversely, the ratio of melt flow index at higher weights decreases. This indicates that by increasing the applied force, the sample containing ethylene can be easily removed from the die of the melt flow index device.
Differential scanning calorimetry analysis
In the differential scanning calorimetry test, changes in the heat capacity of the polymer with heat are recorded. Analyzing the changes in heat capacity allows the detection of transitions such as melting, glass transitions, and fuzzy changes. Therefore, the changes in melting temperature and crystallinity percentage are investigated by using differential scanning calorimetric analysis. A summary of the results obtained at different temperatures and amounts of propylene, ethylene and 1-butene monomers in the pre-polymerization process are listed in Table 5.
According to Table 5, the melting temperature of the sample containing 2 grams of ethylene in the pre-polymerization process had the highest value. However, according to the results obtained in the previous section, this sample had the highest molecular weight. The reason for this phenomenon can be related to changes in the active particles of the catalyst. In case of using ethylene in the pre-polymerization process, the polymerization of the more active particles caused a higher molecular weight and hence a higher melting temperature. Also, when 1-butene was used in the pre-polymerization system in addition to propylene, the melting temperature increased which was due to the change of the active particle. Furthermore, when ethylene or 1-butene were used in the pre-polymerization process in addition to propylene, the melting temperature for the sample containing 1-butene was higher. However, according to the results obtained in the previous section, this sample had a lower molecular weight distribution than that of the ethylene-containing sample.
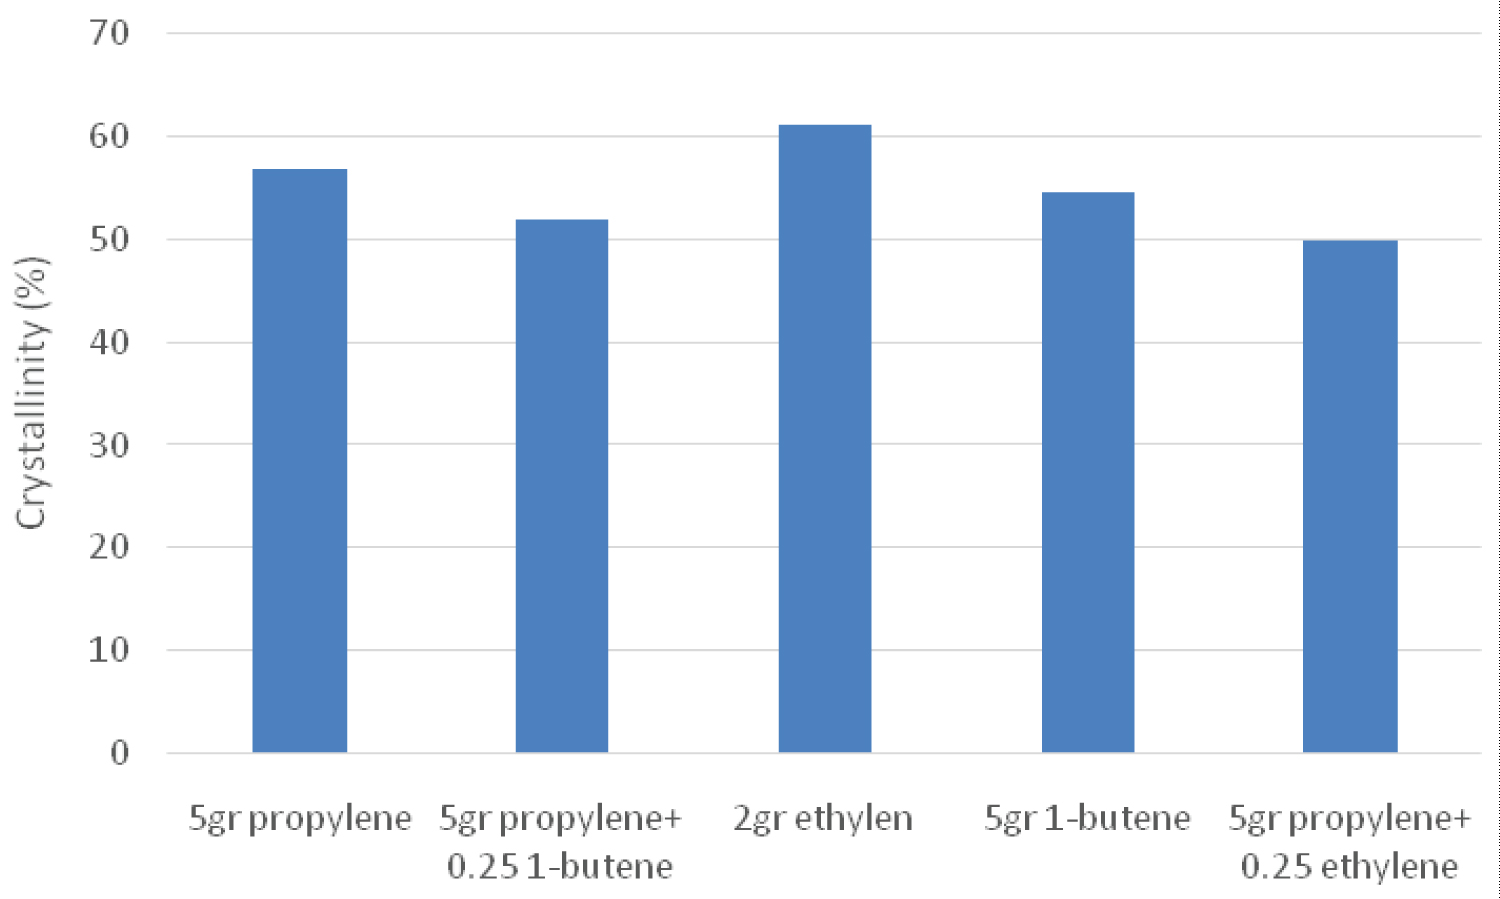
According to Figure 4 which depicts the samples crystallinity, the percentage of crystallinity was generally higher for the samples using only one monomer. However, the highest percentage of crystallinity belonged to the sample containing 2 grams of ethylene and the obtained results were very similar to the melting temperature results. Moreover, while 1-butene or ethylene was used in the propylene polymerization system, the crystallinity percentage became higher for the 1-butene system. Also, according to the results obtained from the ratio of melt flow index in which the molecular weight distribution was higher for the ethylene sample, it can be found that the higher the weight distribution, the higher the crystal percentage.
Polymerization analysis
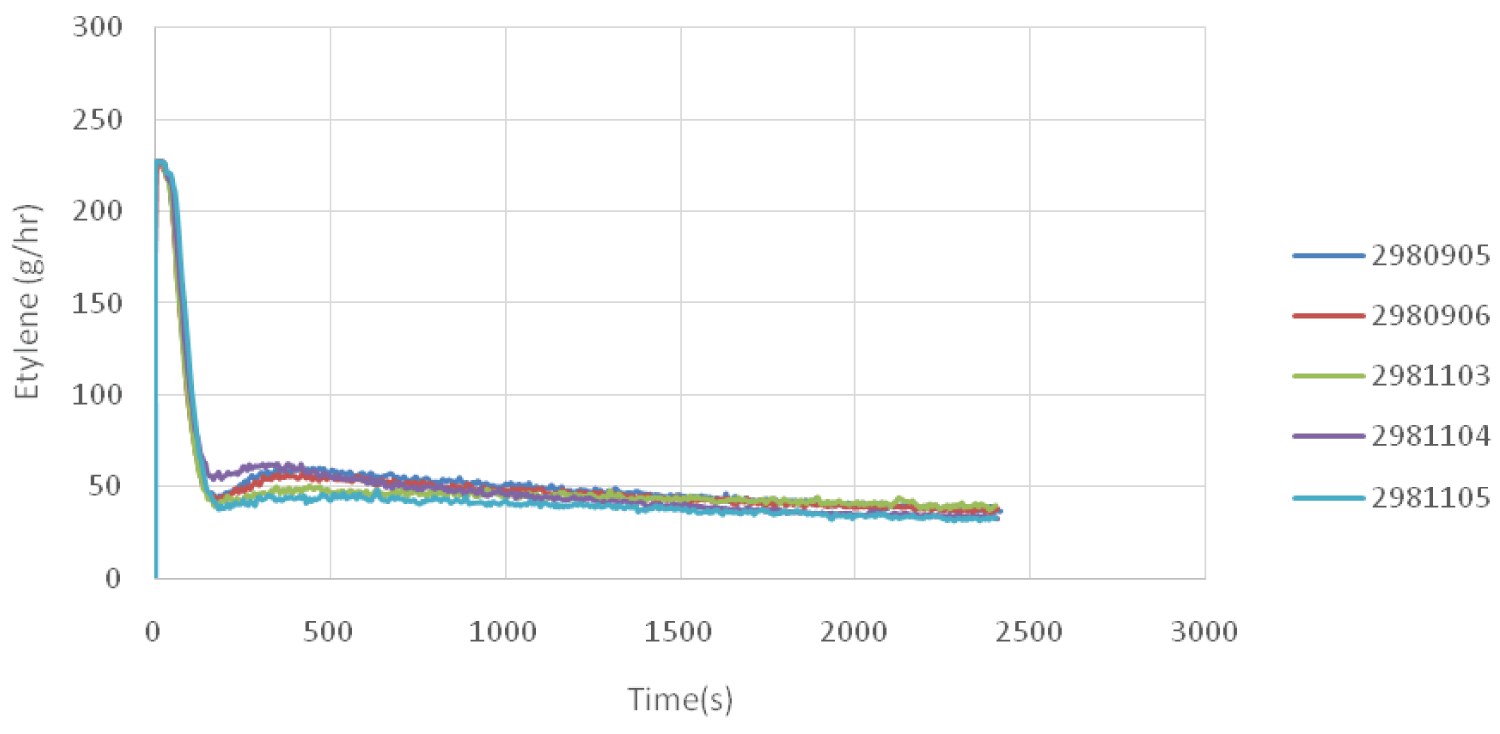
To measure the amount of polyethylene polymerization, the amount of ethylene output flow over time for different modes are plotted in Figure 5 at a constant temperature of 35 ℃. As is shown, the Sample 05 polymerization rate was initially higher than that of the other samples. Therefore, the obtained polymer had a better molecular weight. Furthermore, in the polymerization process, less ethylene was used, so this sample had a lower molecular weight distribution.
However, the polymerization rates of the Sample 02 and Sample 01 were the same at first, so the same molecular weight were achieved for both samples. However, in the continuation of the polymerization reaction, the amount of ethylene consumed was higher for the samples Sample 01, thus it had a higher molecular weight distribution.
When 5 g of 1-butene was used in the pre-polymerization process, the rate was slightly higher initially, but, the amount of ethylene consumption gradually became less than that of the other case (2 g of ethylene).
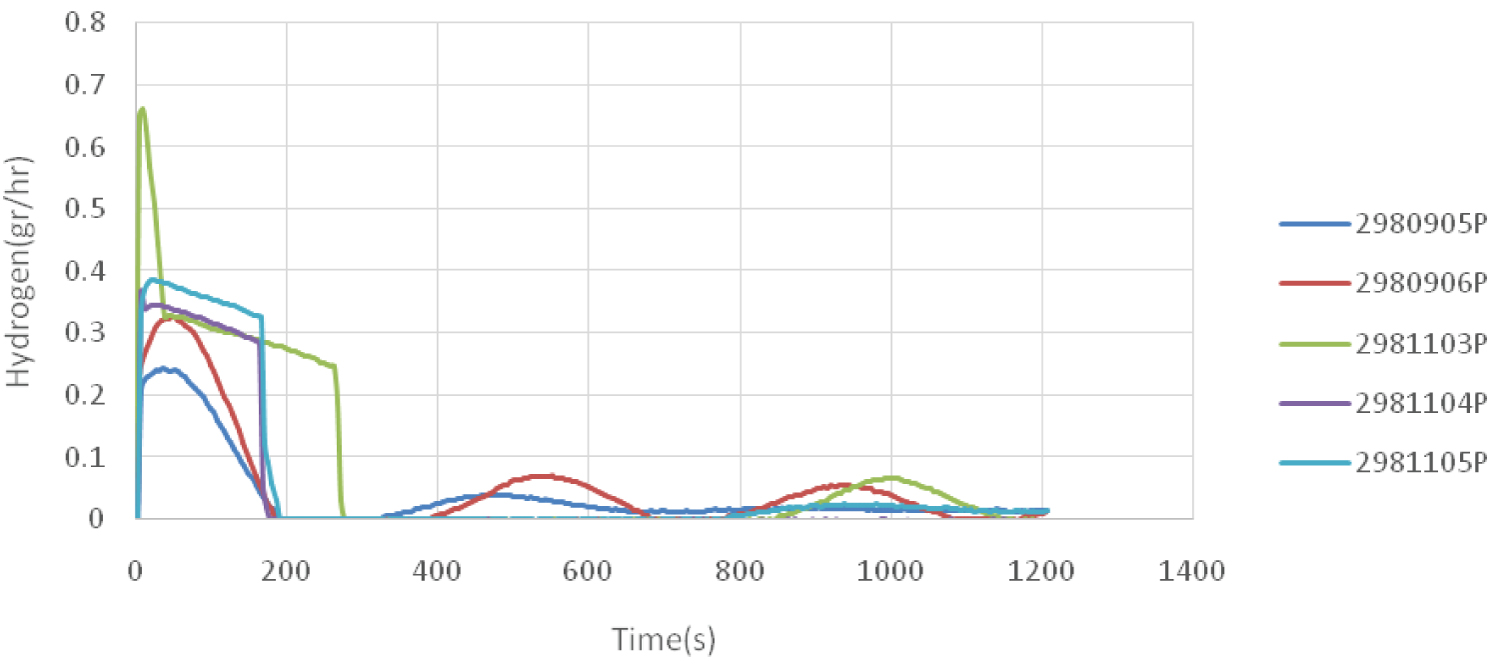
Hydrogen is used in industry to control the molecular weight of the polymer. Therefore, using the distribution of hydrogen flow in the polymerization process, a ratio to the molecular weight distribution can be found (Figure 6). It can be seen that in case of using 5 grams of propylene in the pre-polymerization process, the amount of hydrogen consumption for the sample that contains ethylene and propylene was higher. On the other hand, hydrogen consumption was higher for the sample containing 1-butene compared to the sample containing only propylene.
The amount of consumed hydrogen was greater when only ethylene was used in the process. Therefore, it can be concluded that this sample had a higher molecular weight distribution.
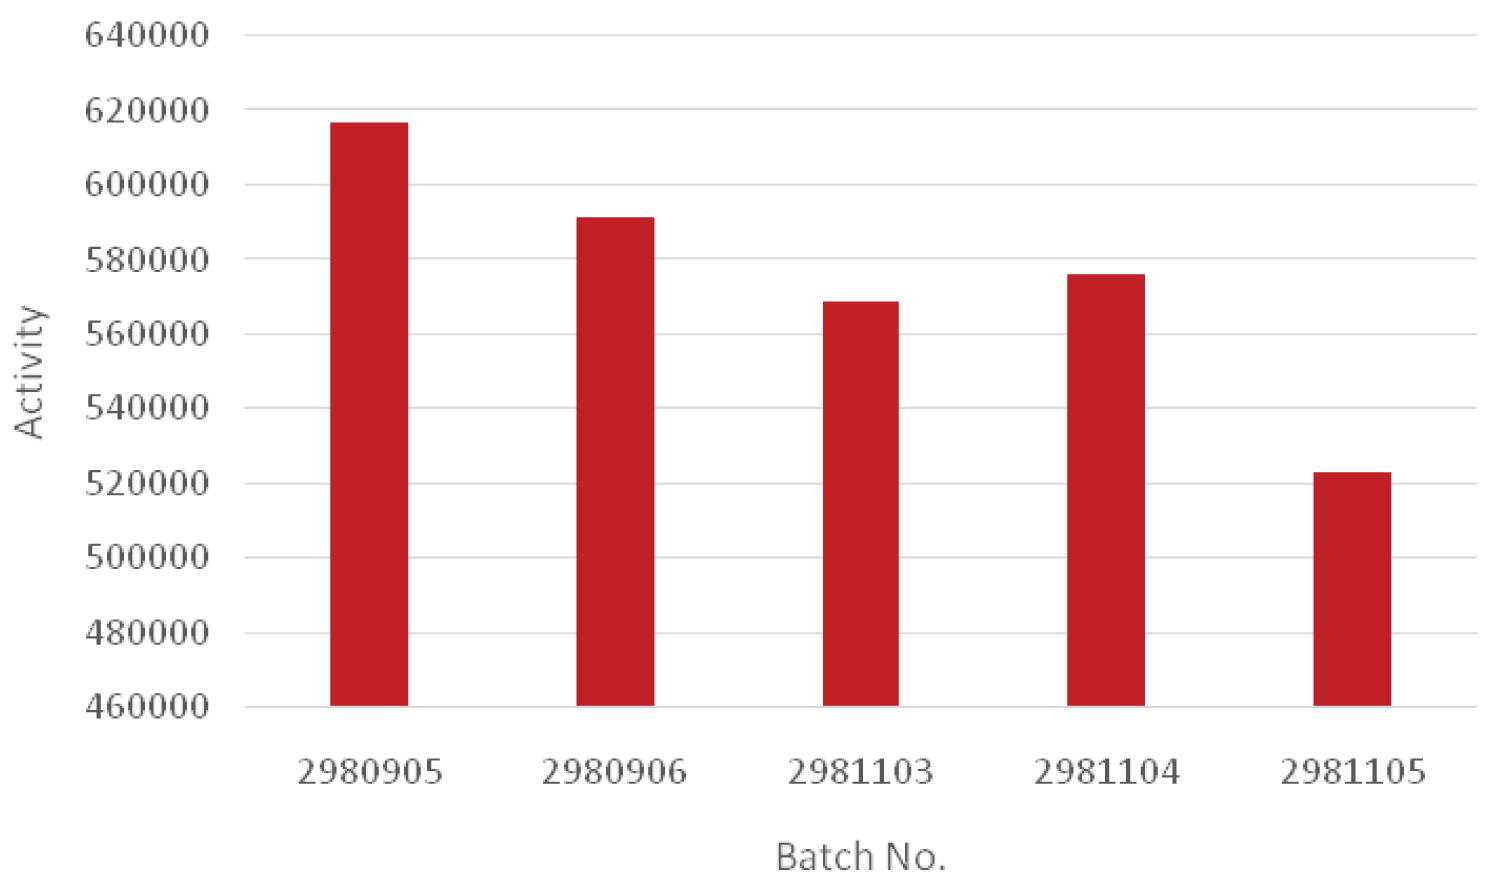
To determine the activity, the ratio of the consumed ethylene to grams of catalyst in the polymerization process was considered (Table 6 and Figure 7). As is shown, when a constant propylene amount of 5 g was used in the pre-polymerization process, the activity was higher for the sample containing only propylene. Therefore, it can be concluded that the addition of 1-butene and ethylene in the pre-polymerization process reduced the reactivity. Moreover, the sample containing 1-butene had a higher level of activity rather than ethylene-containing sample.
In addition, the activity of 1-butene was much higher than that of ethylene which was already mentioned in the presence of propylene in the pre-polymerization process.
Conclusions
In this paper, the application of pre-polymerization process is reported in using different amounts of propylene, ethylene and 1-butene as monomer in order to pre-polymerize the catalyst of linear lightweight polyethylene process. Also, various tests were performed to analyze the polymers obtained by pre-polymerization method. The results obtained in the melt flow index test showed that the polymer obtained from ethylene monomer had the lowest amount of melt index. As a result, it had the highest molecular weight. Also, taking the ratio of melt flow index into consideration, the results exhibited that the ratio of melt flow index of 1-butene monomer had the highest value, which was an indication of its higher molecular weight distribution. Differential scanning calorimetry test was used to measure the melting temperature as well as the percentage of crystallinity. The results confirmed that the polymer obtained from ethylene monomer had a melting temperature and the highest crystalline percentage. By measuring the amount of ethylene inlet gas in the polymerization reaction, the results showed that the reaction rate became reduced by adding 1-butene and ethylene in the pre-polymerization step. Therefore, the amount of gas entering the pre-polymerization process was less.
References
- Covezzi M (1995) The spherilene process: Linear polyethylenes. Macromol Symp 577-586.
- Wang Dengfei WJ, Feng G, Yuxin G, et al. (2016) Progress in technology and catalysts for gas phase polyethylene processes. Adv Mater Sci Eng.
- Moore SJ, Wanke SE, (2001) Solubility of ethylene, 1-butene and 1-hexene in polyethylenes. Chem Eng Sci 56: 4121-4129.
- Wu Q, Wang H, Lin S (1996) Gas phase versus slurry copolymerization of ethylene with 1 butene over MgCl2 supported titanium catalysts after prepolymerization. Macromol Chem Phys 197: 155-163.
- Smit M, Zheng X, Loos J, et al. (2006) Effects of propylene prepolymerization on ethylene/1 hexene and ethylene/1 octene copolymerization with an immobilized metallocene catalyst. J Polym Sci Part A: Polym Chem 44: 6652-6657.
- Soares JB, Hamielec AE (1996) Effect of hydrogen and of catalyst prepolymerization with propylene on the polymerization kinetics of ethylene with a non-supported heterogeneous Ziegler-Natta catalyst. Polymer 37: 4599-4605.
- Tait P, Berry I (1994) 5. Rata enhancement effects in the prepolymerization and copolymerization of ethylene and -olefins studies. Stud Surf Sci Catal 89: 55-72.
- Monji M, Abedi S, Pourmahdian S, et al. (2009) Effect of prepolymerization on propylene polymerization. J Appl Polym Sci 112: 1863-1867.
- Wu Q, Wang H, Lin S (2003) Homo and copolymerization of ethylene with prepolymerized Ti Mg supported catalyst. Die makromolekulare Chemie is Makromol 13: 357-361.
- Chen K, Liu B, Soares JB (2016) Effect of prepolymerization on the kinetics of ethylene polymerization and ethylene/1 hexene copolymerization with a ziegler-natta catalyst in slurry reactors. Macromol React Eng 10: 463-478.
- Yiagopoulos A, Yiannoulakis H, Dimos V, et al. (2001) Heat and mass transfer phenomena during the early growth of a catalyst particle in gas-phase olefin polymerization: The effect of prepolymerization temperature and time. Chem Eng Sci 56: 3979-3995.
- Xu Z, Zhu Q, Feng L, et al. (1990) Ethylene/propene copolymerization with a TiCl3 catalyst: Effects of prepolymerization. Macromol Rapid Commun 11: 79-81.
Corresponding Author
M Najafi, Department of Polymer Engineering, Engineering College, University of Tehran, PO Box 14155-6455, Iran.
Copyright
© 2022 Nikazar S, et al. This is an open-access article distributed under the terms of the Creative Commons Attribution License, which permits unrestricted use, distribution, and reproduction in any medium, provided the original author and source are credited.