Expression of Smad-4 in Oral Potentially Malignant Disorders and Oral Squamous Cell Carcinoma: A Comparative Study
Abstract
Introduction: The World Health Organization (WHO) points out the following lesions as the main oral potentially malignant disorders: Leukoplakia, erythroplakia, actinic cheilitis, oral submucous fibrosis and lichen planus. Oral Cancer accounts for approximately 3% of all malignancies and found in 270,000 patients annually worldwide.
Aims: To study the expression of SMAD-4 in oral potentially malignant disorders and oral squamous cell carcinoma and its role as a prognostic marker.
Materials and methods: 20 specimens of OPMD, 20 OSCC and 10 of normal mucosa were taken. They were stained with standard H&E and IHC using primary antibody SMAD 1. Expression of SMAD-4 protein was determined by staining quantitative assessment of the percentage of marked tumor cells. Group comparisons were made with the Chi-Sq test as data was skewed so comparisons for two groups were made by Mann-Whitney test. Correlations between scores were calculated with Spearman correlation coefficient. All statistical tests were two-sided and performed at a significance level of α = 0.05. Analysis was conducted using IBM SPSS STATISTICS (version 22.0).
Results: On comparing the staining intensities of group 1 (OPMD) and group 2 (OSCC) statistically highly significant difference is obtained (p value = 0.001) and on comparison of percentages of immune positive cells of group 1 (OPMD) and group 2 (OSCC) statistically highly significant difference is obtained (p value = 0.029).
Conclusion: SMAD-4 was a tumor suppressor and loss of SMAD-4 expression may lead to spontaneous oral squamous cell carcinoma development, patients whose oral potentially malignant lesions with higher levels of SMAD-expression displayed a significantly higher rate of malignant transformation.
Keywords
Oral premalignant disorders, Oral squamous cell carcinoma, SMAD-4
Introduction
In 1978, World Health Organization (WHO) proposed the terms “precancerous conditions” and “precancerous lesions” and defined precancerous lesion as “a morphologically altered tissue in which cancer is more likely to occur than in its apparently normal counterpart.” Oral potentially malignant disorders are usually found on the buccal mucosa, followed by gingivae, tongue and floor of the mouth. Prevention and early detection of oral potentially malignant disorders have the potential of not only decreasing the incidence, but also in improving the survival of the person with the preexisting disorder. Among the varied spectrum of oral potentially malignant disorders, oral leukoplakia is known to be the most common one. Oral leukoplakia is associated with a 40.8-fold increased risk of oral cancer and a 5-year absolute risk of 3.3% (1 in 30 individuals progressing to cancer over 5 years) [1]. SMAD proteins are transcriptional regulators activated by TGF-β. They are known to bind to two distinct SMAD responsive motifs, namely the SMAD-binding element (SBE) (5′-GTCTAGAC-3′) and CAGA motifs (5′-AGCCAGACA-3′ or 5′- TGTCTGGCT-3′). The role of SMAD-4 as a tumor suppressor was initially identified in pancreatic cancer-4 or DPC-4 (deleted in pancreatic cancer-4). 10 Loss expression of SMAD-4 was associated with poor clinical outcomes in patients with pancreatic, colon and brain cancers [2]. Main aim of this study was to evaluate the expression and distribution patterns of SMAD-4 in oral potentially malignant disorders and oral squamous cell carcinoma.
Materials and Methods
This was a laboratory based Retrospective and Analytical study. Duration of this study was approximately 7-10 months.
Inclusion criteria
a. Blocks of Histologically proved cases of Oral Potentially Malignant Disorders and oral squamous cell carcinoma.
b. Adults.
Exclusion criteria
a. Cases showing evidence of malignancy/microinvasion.
b. Cases which cannot be diagnosed histologically.
c. Cases where epithelium is not seen histologically.
d. Slides with tissues which are not representative of the pathology.
Paraffin embedded tissue specimens of diagnosed cases of Oral Potentially Malignant Disorders and Oral squamous cell carcinoma were retrieved from the archives of the Department of oral Pathology and oral Microbiology of Swami Devi Dyal Dental Hospital and College, Barwala.
The study specimens included were categorized as follows:
Group 1: 20 specimens Oral potentially Malignant Disorders.
Group 2: 20 specimens of Oral Squamous Cell Carcinoma.
Control: 10 normal oral mucosa biopsies from gingivectomy cases, impaction cases, stage 3 implant cases.
Data on patient age, gender and lesion site were be obtained from the biopsy requisition forms submitted. The tissue sections thus obtained were stained using the following methods:
1. Standard Hematoxylin and Eosin (H&E) Stain.
2. Immunohistochemical Staining Using Primary Antibody SMAD-4 Stain.
Immunostaining Evaluation
The evaluation of staining was done by the following method used by Sakata J, et al. in their study.
Staining quantity score
Expression of SMAD-4 protein was determined by staining quantitative assessment of the percentage of marked tumor cells as shown in following table. For each specimen, one score was assigned according to the percentage of positive cells.
Less than 5% - 1 point
6-35% - 2 point
36-70% - 3 point
More than 70% - 4 point
Staining intensity score
Assessment of staining intensity reaction was considered using a second score assigned according to the intensity of the staining, with negative staining equaling 1point, weak staining equaling 2 points, moderate staining equaling 3 points, and strong staining equaling 4 points.
The SMAD-4 labeling index
It is defined as the weighted percentage of epithelium cells displaying nuclear staining multiplied by the degree of the staining intensity.
For each specimen, one score was assigned according to the percentage of positive cells: Less than 5%- 1 point, 6-35% - 2 point, 6-70% - 3 point, 71%- 4 point. A second score was assigned according to the intensity of the staining, with negative staining equaling 1 point, weak staining equaling 2 points, moderate staining equaling 3 points, and strong staining equaling 4 points. SMAD-4 expression scores were then calculated by multiplying the two scores described above.
Immunoreactive Score (IRS): Scores for the percentage of immune positive tumor cells and scores for the staining intensities will be multiplied to calculate the immunoreactive score (IRS) as shown in the following table (A × B = IRS).
Immunoreactive Score (IRS)
Scores for the percentage of immune positive tumor cells and scores for the staining intensities will be multiplied to calculate the immunoreactive score (IRS) as shown in the following table (A × B = IRS).
If the expression score was < 4, the tissue was considered as low expression and if expression score is ≥ 4, the tissue was considered as high expression.
|
A (Percentage of positive cells) |
B (Intensity of staining) |
IRS (Multiplication of A × B) |
|
0 = No positive cells |
1 = Negative staining |
0-1 = negative |
|
1 =< 5% positive cells |
2 = Weak staining |
2-3 = mild |
|
2 = 6-35% positive cells |
3 = Moderate staining |
4-8 = Moderate |
|
3 = 36-70% positive cells |
4 = Strong staining |
9-12 = Strongly positive |
|
4 => 70% positive cells |
Final Immunoreactive score (A × B): 0-12 |
|
Statistical Analysis
Normality of quantitative data were checked by measures of Kolmogorov Smirnov tests of Normality. Our data was skewed so data were given as mean ± SD, range and median with interquartile range. Age was normally distributed so it was compared with t-test and was presented as mean, SD with range. Gender was reported as counts and percentages. Group comparisons were made with the Chi-Sq test as data was skewed so comparisons for two groups were made by Mann-Whitney test. Correlations between scores were calculated with Spearman correlation coefficient. All statistical tests were two-sided and performed at a significance level of α = 0.05. Analysis was conducted using IBM SPSS STATISTICS (version 22.0).
Results
Table 1 shows sample distribution. Group 1 comprises histologically diagnosed 20 cases of oral potentially malignant disorders (n = 20). And Group 2 comprises of histologically diagnosed 20 cases of oral squamous cell carcinoma (n = 20). 10 cases of normal oral mucosa were taken as control (n = 10).
Table 2 shows that mean age of Group 1 (Oral potentially malignant disorders) is 35.30 ± 11.407 whereas mean age of Group 2 (oral squamous cell carcinoma) is 48 ± 12.929.
Table 3 shows that males in total sample are 27 (67.5%) and females in total sample are 13 (32.5%) out of 40. There are six females (30%) and fourteen males (70%) in Group 1 (Oral Potentially Malignant Disorders) whereas there are seven females (35%) and thirteen males (65%) in Group 2 (oral squamous cell carcinoma).
Table 4 shows that in Group 1 (Oral potentially malignant disorders) there are six slides (30%) out of 20 showing strong staining with SMAD-4 (score 4), four slides (20%) out of 20 showing moderate staining with SMAD-4 (score 3), eight slides (40%) out of 20 showing weak staining with SMAD-4 (score 2) and two slides (10%) out of 20 showing negative staining with SMAD-4 (score 1).
Table 5 shows that in Group 2 (oral squamous cell carcinoma) there are three slides (15%) out of 20 showing weak staining with SMAD-4 (score 2), seventeen slides (85%) out of 20 showing negative staining with SMAD-4 (score 1).
Table 6 shows that on comparison of staining intensity scores of Group 1 (Oral potentially malignant disorders) and Group 2 (oral squamous cell carcinoma) the maximum cases of group 1 exhibited weak staining with SMAD-4 (score 2) whereas majority of cases of group 2 exhibited negative staining with SMAD-4 (score 1).
Statistical analysis:
|
Study Group |
P value |
Significance |
|
Group 1 (OPMD) |
0.001 |
Significant |
|
Group 2 (OSCC) |
Correlation between staining intensity scores of Group 1 and Group 2 is highly significant (p value = 0.001).
Table 7 shows that in Group 1 (Oral potentially malignant disorders) one out of 20 slides (05%) have > 70% positive cells (score 4), four out of 20 slides (20%) have 36-70% positive cells (score 3), five out of 20 slides (25%) have 6-35% positive cells (score 2), eight out of 20 slides (40%) have < 5% (score 1) and two out of 20 slides (10%) have no positive cells (score 0) towards SMAD-4.
Table 8 shows that in Group 2 (oral squamous cell carcinoma) two out of 20 slides (10%) have 6-35% positive cells (score 2), three out of 20 slides (15%) have < 5% positive cells (score 1) and fifteen out of 20 slides (75%) have no positive cells (score 0) towards SMAD-4.
Table 9 shows that on comparison of staining quantity score of Group 1 (Oral potentially malignant disorders) and Group 2 (oral squamous cell carcinoma) the maximum cases of Group 1 (Oral potentially malignant disorders) exhibited < 5% of positive cells (score 1) whereas majority of cases of Group 2 (oral squamous cell carcinoma) exhibited no positive cells (score 0) towards SMAD-4.
Statistical analysis:
|
Study Group |
P value |
Significance |
|
Group 1 (OPMD) |
0.029 |
Significant |
|
Group 2 (OSCC) |
Correlation between staining quantity scores of Group 1 and Group 2 is significant (p value = 0.029).
Table 10 shows that in Group 1 (Oral potentially malignant disorders) two slides out of 20 (10%) exhibit negative expression, seven slides out of 20 (35%) exhibit mild expression, eight slides out of 20 (40%) exhibit moderate expression, three slides out of 20 (15%) exhibit strong expression towards SMAD-4.
Table 11 shows that in Group 2 (oral squamous cell carcinoma) four slides out of 20 (20%) exhibit mild expression and sixteen slides out of 20 (80%) exhibit negative expression towards SMAD-4.
Table 12 shows that on comparison of Immunoreactive score (IRS) of Group 1 (Oral potentially malignant disorders) and Group 2 (oral squamous cell carcinoma) the maximum cases of Group 1 (Oral potentially malignant disorders) exhibited moderate expression (score 3) whereas majority of cases of Group 2 (oral squamous cell carcinoma) exhibited strongly negative expression (score 0) towards SMAD 4.
Statistical analysis:
|
Study Group |
P value |
Significance |
|
Group 1 (OPMDS) |
< 0.001 |
Significant |
|
Group 2 (OSCC) |
Correlation between immunoreactive scores of Group 1 and Group 2 is highly significant (p value =< 0.001).
Table 13 shows that on comparison the overall mean of Group 1 (Oral potentially malignant disorders) staining intensity score is 2.7, staining quantity score is 1.7, immunoreactive score is 4.55 and whereas the overall mean of Group 2 (Oral squamous cell carcinoma) staining intensity score is 1.15, staining quantity score is 0.35, immunoreactive score is 1.2.
Discussion
Head and neck cancers are aftermath of diverse hetrogeneous abnormalities and intricate molecular irregularities which accounts for significant morbidity and mortality. OSCC has emerged as a prime carcinoma among copious other head and neck cancers, accounting for 3% of all malignancies and evolving as one of the most common malignant tumors. Oral squamous cell carcinoma (OSCC), which comprises approximately half of head and neck cancer, is the most common subtype of head and neck carcinoma [3]. The 5-year survival rate of patients with OSCC remains almost unchanged despite various treatment improvements in the last three decades [4].
Many potentially malignant disorders such as leukoplakia, erythroplakia and oral submucous fibrosis behold as one of the initiation factors for OSCC. Oral leukoplakia (OL) is the most common premalignancy in the oral cavity and can progress to oral squamous cell carcinoma (OSCC) [5]. TGF-β signaling pathway plays an important role in embryonic development and in the regulation of tissue homeostasis [6]. Previous reports showed that TGF-β possessed dual functions: It functioned as a tumor suppressor in the initiation steps of tumorigenesis by inhibiting proliferation and inducing apoptosis while in the later stages of tumorigenesis and progression by inducting epithelium-mesenchymal transition (EMT), stimulating angiogenesis and suppressing immune system [5]. SMAD-4 functions as common SMAD (CO-SMAD) to mediate TGF-beta and BMP signaling pathway In HNSCC, loss of heterozygosity at SMAD-4 gene region was observed in 30%-50% of the tumors, suggesting a tumor suppressor role of SMAD-4 [5,7,8].
In the present study, study group was categorised into two Groups namely Group 1 which comprised of 20 cases of histologically diagnosed cases of Oral potentially malignant disorders and Group 2 Oral squamous cell carcinoma. 10 cases of normal oral mucosa were taken as control.
In the present study mean age of study sample was observed to be 41.65 ± 13.64. Further, in our study, mean age of patients of oral potentially malignant disorders is 35.30 ± 11.407 years and oral squamous cell carcinoma is 48 ± 12.92 years (Table 2), which was in accordance to the study done by Molook Torabietal [4,5]. In their study the mean age of patients in OPMDS was 46.82 ± 15.22 years but in OSCC with the mean patient age of 59.44 ± 17.55 years which is slightly high than our study. In another study by Shenoi R, et al. mean age of patient of Oral squamous cell carcinoma is 49.3 years which is in accordance with the present study [9].
In the present study we observed male predominance with 67.5% males and female: male ratio turns out to be 1:2.1. Group 1 (Oral potentially malignant disorders) comprised of 70% males and 30% females while Group 2 (Oral squamous cell carcinoma) comprised of 65% males and 35% females (Table 3). In similarity to the present study Kumar S, et al. also reported male predominance with 59.2% males [10]. In a review done by Nair, et al., the prevalence of oral potentially malignant disorders and oral cancer was found to be more in males [11]. A similar finding was reported in study conducted by Lin, et al. in Taiwan, wherein a statistical significant difference was observed between various oral potentially malignant disorders detected and gender [12]. A reason that the authors believe for this gender discrepancy with males being at higher risk may be due to the fact that the habit of tobacco consumption is more in males which may lead to development of oral potentially malignant disorders in males.
Negative expression of SMAD-4 is seen in normal oral mucosa (n = 10) indicating it as a normal control. In accordance with the present study Bornstein, et al. reported similar findings [13]. In their study they initially determined that the cancers in patients with HNSCC expressed decreased levels of SMAD-4 in normal buccal mucosa which implied that SMAD-4 loss occurs early during the development of HNSCC in humans [13].
Immunohistochemical Evaluation of Expression of Smad-4 in Oral Potentially Malignant Disorders and Oral Squamous Cell Carcinoma
Assessment of staining intensity
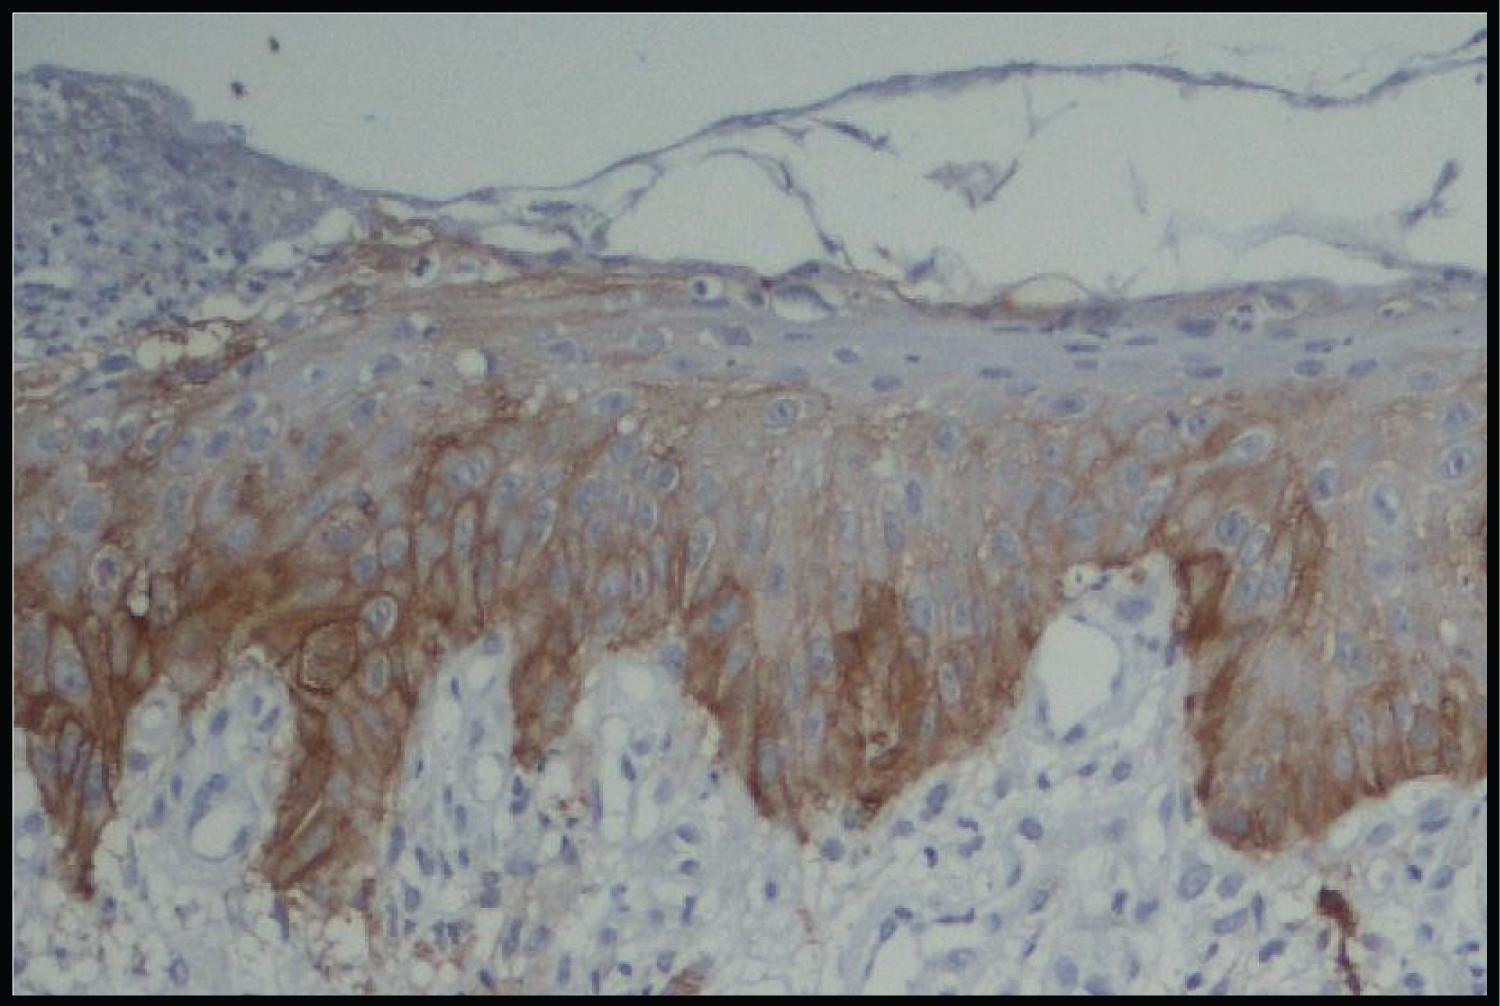
In Group 1 (Oral Potentially Malignant Disorders) 30% cases showed strong staining with SMAD-4, 20% showed moderate staining with SMAD-4, 40% showed weak staining with SMAD-4 and in 10% SMAD-4 was negatively expressed (Table 4).
Thus, from our results we interpret that there was a mixed pattern of SMAD-4 with 40% of cases exhibiting weak SMAD-4 expression and 30% cases exhibited strong SMAD-4 expression. These findings are in accordance with the previous studies done by Sakata J, et al. [14] and Xia RH, et al. [5]. In their studies, Xia RH, et al. reported 48.9% cases with strong SMAD-4 expression and 51.1% cases with weak SMAD-4 expression [14]. While Sakata J, et al. reported 56% of cases with strong SMAD-4 expression and 44% cases showed weak SMAD-4 expression. These authors concluded that SMAD-4 appears to play a role in malignant transformation of OMPDS. Further, they also reported an association between a higher SMAD-4 expression and an increased rate of OL malignant transformation (Figure 1, Figure 2, Figure 3 and Figure 4).
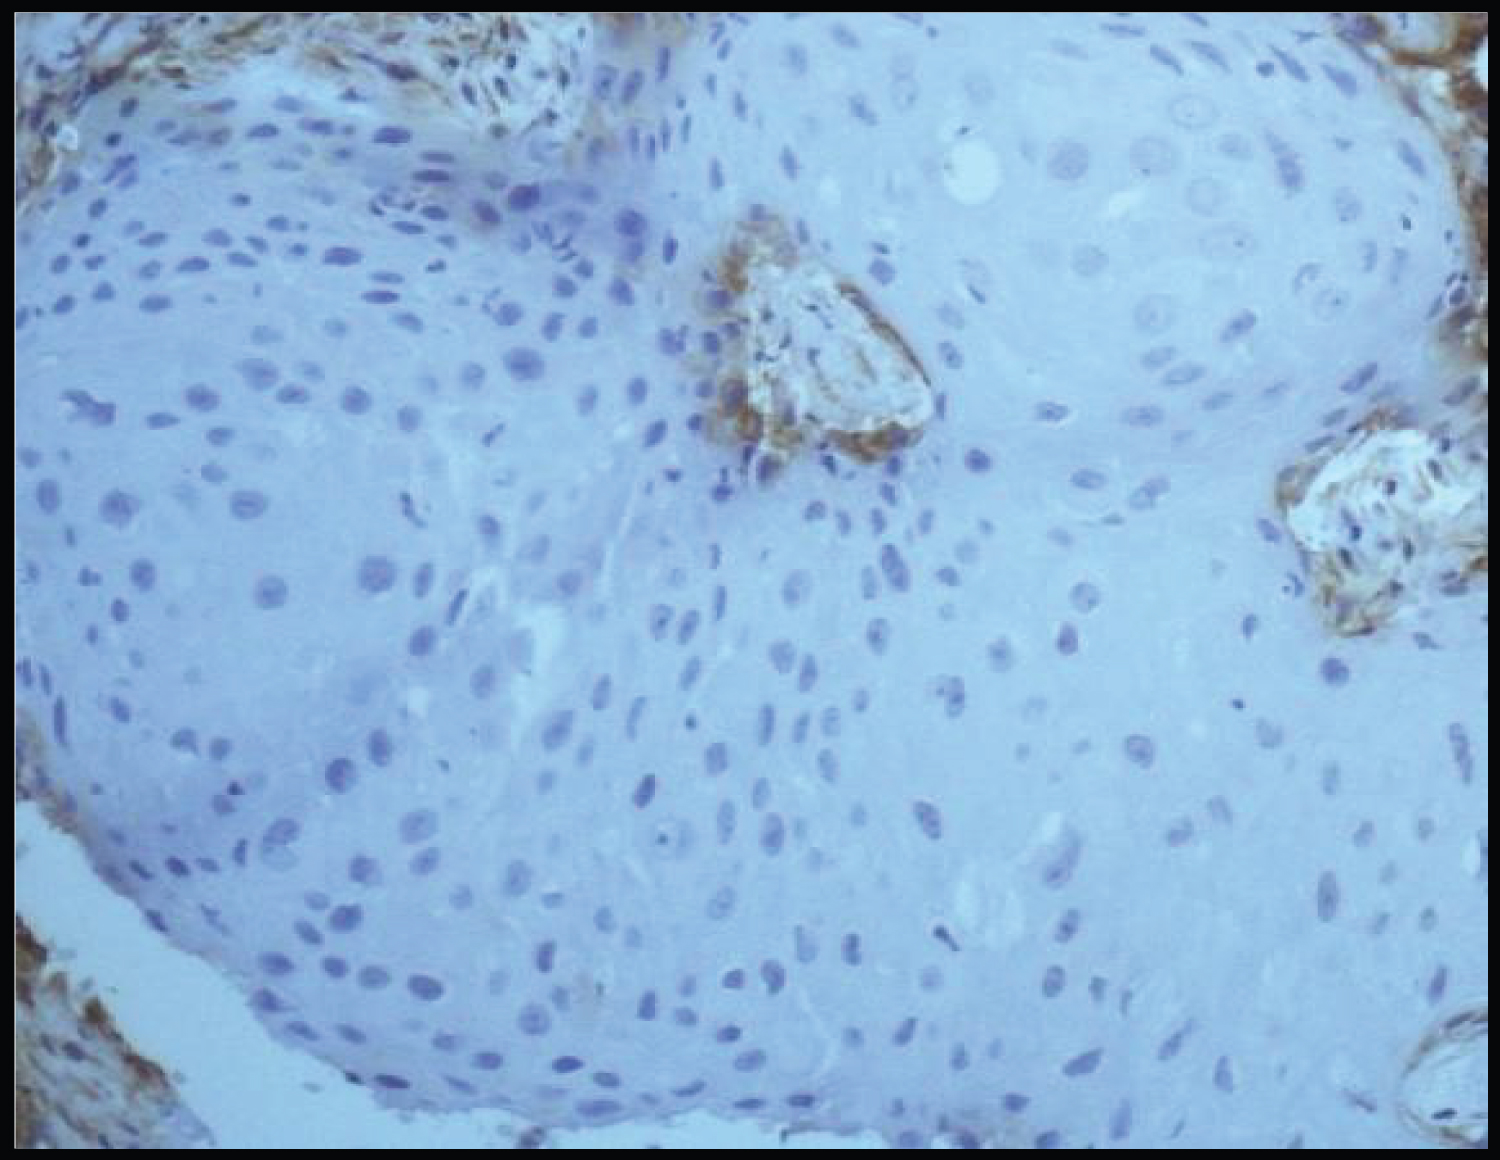
In Group 2 (Oral squamous cell carcinoma) there are three 85% of cases showed negative staining with SMAD-4 whereas 15% cases showed weak staining with SMAD-4. Hence, from our results we can interpret that a predominant low SMAD-4 expression was exhibited by the OSCC samples. These results can be justified by a study done Bornstein, et al. according to them 86% of HNSCC samples exhibited down regulation of SMAD-4 [13]. The lower SMAD-4 expression in OSCC tissues was also in accordance with the other studies which showed that SMAD-4 was a tumor suppressor in OSCC [5].
On comparison, a statistically significant difference is observed on comparison of staining intensities of both the groups (p = 0.001) (Table 6). Similar results of SMAD-4 staining intensity were observed by Sakata J, et al. [14] and Xia RH, et al. [5]. Xia RH, et al. in his study concluded that SMAD-4 loss can be significantly correlated with the malignant transformation of oral leukoplakia and can be used for the prognosis of OSCC patients [5].
Assessment of staining quantity
In the present study quantitative expression of SMAD-4 or the percentage of immunopositive tumor cells in Group 1 (Oral potentially malignant disorders) shows that 5% cases have > 70% positive cells, 20% cases have 36-70% positive cells, 25% have 6-35% positive cells, 40% cases have < 5% positive cells and 10% have no positive cells. Thus, predominantly > 5% of immunopositive tumor cells were seen in Oral potentially malignant disorders in our study with 40% cases followed by 6-35 % of immunopositive tumor cells in 25% cases.
In Group 2 (Oral squamous cell carcinoma) 10% cases have 6-35% positive cells, 15% have > 5% positive cells and 75% have no positive cells (Table 8). Hence, predominantly > 5% of immunopositive tumor cells were seen in OSCC specimens in the present study.
On comparison, a statistically significant difference is observed between staining quantities of both the Groups (p value = 0.029) (Table 9). These findings were in accordance with the previous studies conducted by Xia RH, et al. [5].
Assessment of Immunoreactive scorings
Low expression of SMAD-4 is defined based on a combination of the percentage of stained cells and the intensity of staining. Thus, scores of the percentage of immunopositive cells and cellular expression intensity is multiplied to calculate an immunoreactive score (IRS), this method previously described by Remmele and Stegner [15].
In our study, in Group 1 (Oral potentially malignant disorders) 10% cases exhibited negative expression, 35% exhibited mild expression, 40% exhibited moderate expression and 15% of cases exhibited strongly positive expression towards SMAD-4 (Table 10). Hence, overall predominantly moderate SMAD-4 expression was seen in OPMDS in our study with 40% of the cases.
In Group 2 (Oral squamous cell carcinoma) 80% exhibit negative expression and 20% exhibit mild expression towards SMAD-4 (Table 11). Hence, overall predominantly negative SMAD-4 expression was exhibited by OSCC specimens in our study.
On comparing the immunoreactive scores of both the groups: Group 1 and Group 2 (OPMDS and OSCC) a statistically significant difference is observed (p value = 0.034) (Table 12). These findings were in concordance with study conducted by Xia RH, et al. [5].
Thus, in the present study, statistically significant over all staining intensity (p = 0.003), percentage of immunopositive cells (p = 0.001) and immunoreactive scoring (p =< 0.001) was obtained by SMAD-4 in Group 1 (Oral potentially malignant disorders) and Group 2 (Oral squamous cell carcinoma). Thus, SMAD-4 can be considered as a prognostic factor in patients with Oral potentially malignant disorders and Oral squamous cell carcinoma.
From present study we came to an inference that SMAD-4 may play a vital role in tumorigenesis. In our study, SMAD-4 is found to be downregulated in OSCC in comparison to and OPMDS. A sequential upregulation of SMAD-4 expression is observed from OPMDS and then its sudden loss in OSCC suggesting a possible role of SMAD-4 in oral carcinogenesis. It may also act as a marker for early detection of malignant transformation with prognostic significance.
Conclusion
Besides the notion that SMAD-4 was a tumor suppressor and loss of SMAD-4 expression may lead to spontaneous oral squamous cell carcinoma development, patients whose oral potentially malignant lesions with higher levels of SMAD-4 expression displayed a significantly higher rate of malignant transformation. Our results suggested that SMAD-4 might be activated in early oral tumorigenesis but insufficient to halt carcinogenic process. The combination of SMAD-4expressionand histological grade of dysplasia was a better predictor for the malignant transformation of oral leukoplakia.
However further larger studies are recommended to further validate its role in oral carcinogenesis.
References
- Ray JG (2017) Oral potentially malignant disorders: Revisited. J Oral Maxillofac Pathol 21: 326-327.
- Aittiwarapoj A, Juengsomjit R, Kitkumthorn N, et al. (2019) Oral potentially malignant disorders and squamous cell carcinoma at the tongue: Clinicopathological analysis in a Thai population. Eur J Dent 13: 376-382.
- Warnakulasuriya S (2009) Global epidemiology of oral and oropharyngeal cancer. Oral Oncol 45: 309-316.
- Jemal A, Siegel R, Ward E, et al. (2009) Cancer statistics, 2009. CA Cancer J Clin 59: 225-249.
- Xia RH, Song XM, Wang XJ, et al. (2013) The combination of SMAD-4 expression and histological grade of dysplasia is a better predictor for the malignant transformation of oral leukoplakia. PLoS One 8:
- Moustakas A, Heldin C-H (2009) The regulation of TGF-β signal transduction. Development 136: 3699-3714.
- Wu MY, Hill CS (2009) TGF-β super family signaling in embryonic development and homeostasis. Devel Cell 16: 329-343.
- Kim SK, Fan Y, Papadimitrakopoulou V, et al (1996) DPC4, a candidate tumor suppressor gene, is altered infrequently in head and neck squamous cell carcinoma. Cancer Research 56: 2519-2521.
- Shenoi R, Devrukhkar V, Sharma BK, et al. (2012) Demographic and clinical profile of oral squamous cell carcinoma patients: A retrospective study. Indian Journal of Cancer 49: 21-26.
- Kumar S, Debnath N, Ismail MB, et al. (2015) Prevalence and risk factors for oral potentially malignant disorders in Indian population. Adv Prev Med 2015: 208519.
- Nair DR, Pruthy R, Pawar U, et al. (2012) Oral cancer: Premalignant conditions and screening-an update. J Cancer Res Ther 8: S57-S66.
- Lin SH, Lin CW, Lu JW, et al. (2022) Cytoplasmic IGF2BP2 protein expression in human patients with oral squamous cell carcinoma: Prognostic and clinical implications. Int J Med Sci 19: 1198-1204.
- Bornstein S, White R, Malkoski S, et al. (2009) SMAD-4 loss in mice causes spontaneous head and neck cancer with increased genomic instability and J Clin Invest 119: 3408-3419.
- Sakata J, Yoshida R, Matsuoka Y, et al. (2017) Predictive value of the combination of SMAD-4 expression and lymphocyte infiltration in malignant transformation of oral leukoplakia. Cancer Med 6: 730-738.
- Remmele W (1987) Recommendation for uniform definition of an immunoreactive score (IRS) for immunohistochemical estrogen receptor detection(ER-ICA) in breast cancer tissue. Pathologe 8: 138-140.
Corresponding Author
Dr. Gunveen Kaur, Senior Lecturer, Institute of Dental Sciences, Sehora, India.
Copyright
© 2024 Diviani, et al. This is an open-access article distributed under the terms of the Creative Commons Attribution License, which permits unrestricted use, distribution, and reproduction in any medium, provided the original author and source are credited.