A Pilot Study Comparing Uric Acid and Biomarkers of Renal Injury and Inflammation in Pediatric Sickle Cell Disease at Vaso-Occlusive Crisis and Steady State
Abstract
Hyperuricemia hastens the decline of renal function in chronic kidney disease and activates the pro-inflammatory Nlrp3 inflammasome. Studies from the 1970s posited that high rates of hyperuricemia seen in sickle cell anemia (SCA) patients were due to high nucleotide production resulting from a chronic ischemia activated bone marrow. As such, serum uric acid (UA) levels may vary between states of vaso-occlusion. It is currently unknown whether serum UA is variable over time, nor the effect of hyperuricemia on renal injury and inflammation in SCA. In this prospective study, we measured serum and urine UA, renal injury and inflammation biomarkers among patients with SCA hospitalized for a vaso-occlusive crisis (VOC) and again at a time of baseline state of health without acute pain (steady state). We found no difference in the mean serum UA between VOC and steady state (mean difference = 0.01 SE 0.32, p = 0.5151). We found at VOC that renal excretion of UA was positively correlated with C Reactive Protein (CRP) (R2 = 0.77, p = 0.0097), urine Interleukin-18 (IL-18; R2 = 0.51, p = 0.0463), and urine Kidney Injury Molecule-1 (KIM-1; R2 = 0.81, p = 0.0025). At steady state, we found negative correlations with renal excretion of UA and KIM-1 (R2 = 0.86, p = 0.001) and N-acetyl-β-D-glucosaminidase (NAG; R2 = 0.66, p = 0.0146). Our study is the first to describe lack of variation in serum UA between VOC and steady state. Future studies should be planned to determine mechanism of hyperuricemia development, and whether hyperuricemia is associated with sickle cell renal injury and inflammation.
Keywords
Sickle cell nephropathy, Nlrp3 inflammasome, Hyperuricemia, Biomarkers, Renal injury
Introduction
Sickle cell anemia (SCA) is the most common inherited condition in African Americans. Nearly all SCA patients are affected by sickle cell nephropathy (SCN), and 16-18% of mortality is attributed to the manifestations of SCN [1-3]. SCN is detectable early in the majority of infants with SCA as glomerular hyperfiltration, an important early mediator of chronic glomerular damage [4-6]. This is followed by an increasing prevalence (26-46%) of abnormal albuminuria in the teenage and young adult years [2,7]. The onset of albuminuria often heralds the decline in glomerular filtration rate (GFR) from the supra-normal hyperfiltration range eventually to a sub-normal chronic kidney disease (CKD) range in as many as 42% of young adults [2,6]. One large SCA cohort study reported a survival time of just 4 years after onset of end stage renal failure requiring dialysis, with a median age of death of 27 years [3,7]. By comparison, the expected remaining lifetime of dialysis-dependent African Americans aged 25-29 years is 15 years [8]. It has been shown that recurrent cycles of hypoxia-ischemia from vaso-occlusive crisis (VOC), chronic inflammation, and vascular endothelial dysfunction contributes to multi-organ damage in SCA, including damage of the kidneys [9]. Treatment with hydroxyurea may lessen the glomerular hyperfiltration and improve the urine concentrating ability in older children, but there is unclear benefit on whether hydroxyurea or any other treatment prevents the progression to CKD [3,10-12]. Identification of a modifiable therapeutic target that may mitigate SCN progression is necessary.
One such target may be uric acid (UA). UA is the result of purine nucleoside breakdown pathway, where hypoxanthine is converted by the enzyme xanthine oxidase (XO) to UA. It has a dual pro-oxidant and anti-oxidant physiologic role depending on the level in the blood. High serum UA (hyperuricemia) leads to vascular endothelial dysfunction, directly activates the Nod-like receptor protein 3 (Nlrp3) inflammasome and leads to release of pro-inflammatory cytokines, is associated with a faster decline of renal function in pediatric and adult CKD, and increases mortality rates among hemodialysis patients [13-19].
Small case series from the 1970-80s reported a high rate of hyperuricemia (34-45%) among sickle cell patients. The age range in the studies varied widely from 17 months to 45 years, but included mostly young adults and utilized a hyperuricemia definition of at least 6.5 mg/dL [20-22]. These studies posited that chronic hemolysis leads to increased bone marrow turnover and nucleotide production, and thus overproduction of UA as a byproduct. This hypothesis has not been evaluated formally, and in fact, hyperuricemia can result from one or multiple factors: overproduction of UA, inadequate renal excretion of UA, or a combination of these factors. A 'western' diet high in fructose or purines (meats) and associated with elevated body mass index (BMI) can lead to overproduction of UA as these substrates are converted by XO to UA. Renal under-excretion of UA can result from renal insufficiency as with CKD, or genetic polymorphisms in renal UA transporter proteins. In addition, filtered urate is exchanged for monocarboxylate anions including lactate via SLC5A8, SLC5A12 and URAT1/OAT10 transporters in the proximal tubule. Elevated lactic acid excretion will result in increased re-absorption of the filtered load of urate [23]. If the theory of hyperuricemia resulting from hemolysis and high bone marrow turnover or increased lactic acidosis is correct, then serum and urine UA levels may vary within a single patient during a time of a sickling vaso-occlusive crisis (VOC) when hemolysis, ischemia, and lactic acid excretion are higher relative to their baseline state of health (i.e. "steady state"). In fact, the modern-day prevalence and mechanism of development of hyperuricemia is unknown, and there has been no comparative study of the serum UA level at a time of VOC versus steady state in SCA. A determination of whether serum UA varies by disease state (VOC versus steady state) is first required to inform the design of large-scale studies to determine the impact of hyperuricemia specific to SCA.
In a secondary aim, we measured renal injury and inflammation biomarkers at both time points to explore plausible mechanistic relationships between UA, renal injury, and inflammasome activation. Based on prior SCN studies which associated renal injury biomarkers with presence of albuminuria in steady state [24,25], we chose urine N-acetyl-β-D-glucosaminidase (NAG), Kidney Injury Molecule-1 (KIM-1), and Endothelin-1 (ET-1) for analysis of renal injury biomarkers. Urine KIM-1 expression is significantly increased in renal proximal tubules following early ischemic and toxic injury. Likewise, urine NAG, a tubular lysosomal brush border enzyme, is released early in proximal tubular injury. Normal urine NAG is considered < 2U/L and is elevated in steady state SCA patients [24, 26,27]. Urine KIM-1 and NAG were strongly associated with albuminuria in steady state SCA [28]. ET-1 is a potent renal vasoconstrictor released after hypoxia which may also induce tubular fibrosis and proteinuria [27,29-31]. Urine NGAL was not chosen for analysis because one study found a majority of SCA patients at steady state had subnormal NGAL levels, and no association to albuminuria or age [24]. For the analysis of inflammation, we chose urine Interleukin-18 (IL-18), urine Nlrp3, and serum C-reactive protein (CRP). Soluble UA is an activator of the Nlrp3 inflammasome [18]. Nlrp3 is a signaling hub for abnormal pathogen- or danger-associated molecular pattern (PAMP or DAMP) triggers to activate pro-inflammatory cytokines such as IL-18 and Interleukin-1β. IL-18 is therefore a marker of inflammation, and in the urine has also been used as a marker of early acute kidney injury as a mediator of ischemic acute tubular necrosis [32].
In this prospective study, we determined whether the serum UA at VOC was greater than at steady state. Secondly, we examined correlations between the serum or urine UA with biomarkers of renal injury and inflammation at each time point.
Methods
This study was approved by the Virginia Commonwealth University Institutional Review Board and funded by the Children's Hospital Foundation Research Fund. This was a prospective observational pilot study of sickle cell disease patients (genotype Hemoglobin SS, SC, or Sβ0-thalassemia) at two time points. Patients aged 5-25 years that were hospitalized for management of a pain VOC were prospectively enrolled within the first 48 hours of admission. The diagnosis of pain VOC was determined clinically by the admitting hematologist. Participants were excluded if: They were discharged less than 24 hours after admission, had fever in the 48 hours prior to admission, required acute hemodialysis or extracorporeal membrane oxygenation during the admission, were prescribed diuretic or uricosuric medications, or had a diagnosis of diabetes mellitus or insipidus, congenital kidney and urinary tract abnormalities, or were pregnant. The participants were prospectively followed to their subsequent outpatient comprehensive sickle cell clinic visit > 2 weeks to < 6 months after hospital discharge. At this visit, participants were at their baseline state of health, i.e. "steady state" as determined by their primary hematologist and not experiencing an active VOC or taking narcotic pain medication on the day of the visit.
Demographic and anthropometric data including race, gender, and body mass index (BMI) were collected on all participants. As there is no clear definition that differentiates VOC from steady state, the PedsQL 3.0 Sickle Cell Disease Module was administered to participants at both time points to attempt to objectively assess differences in pain experience. This 43-item questionnaire measures health related quality of life including pain impact, with higher scores indicating better quality of life. Concurrent urine and blood samples were collected at both time points for: comprehensive metabolic panel, serum C-reactive protein (CRP), serum and urine UA, urine creatinine, complete blood count. Serum cystatin C and urine microalbumin were collected only at steady state. Cystatin C was measured using an FDA cleared immunoturbidimetric method. Estimated GFR (eGFR) was calculated using two equations, the modified Schwartz creatinine-based eGFR, and Cystatin C Bouvet eGFR equation validated for normofiltration and hyperfiltration ranges [4]. The serum creatinine (SCR), urine creatinine (UCR), and urine UA (UUA) were incorporated into a formula that estimates the production of UA, the "Simkin index."This formula calculates the excretion of UA per volume of glomerular filtration and is expressed in milligrams of urine UA per deciliter of glomerular filtrate (mg/dL GF):
The Simkin index is used clinically to express the renal excretion of UA while controlling for GFR, which is an important consideration in SCA because of the effect of glomerular hyperfiltration on renal clearance of creatinine. An elevated Simkin index indicates an over-production of UA. The Simkin index is considered elevated above 0.4 mg/dL GF for those with a supra-normal GFR (> 120 ml/min/1.73 m2), and above 0.6 mg/dL GF for those with normal GFR (80-120 ml/min/1.73 m2) [33-35]. Urine UA to creatinine ratio (UUA: Cr) was also compared between the two time points. The residual urine samples were refrigerated and then frozen at -80 ℃ within 8 hours of collection until analysis for the renal injury and inflammation biomarkers. Urine levels of KIM-1, ET-1 (R&D systems, Minneapolis, MN), IL-18 (from Medical Biological Laboratory International, Woburn, MA), and Nlrp3 (My BioSource, San Diego, CA) were analyzed by enzyme linked immunosorbent assay (ELISA). Urine NAG (from Millipore Sigma, Darmstadt, Germany) was analyzed by colorimetric ELISA. All analyses were in accordance with manufacturers' instructions.
To address the primary research question of whether serum UA is higher at VOC compared to steady state, we calculated our sample size using a two-sided repeated measures test for two means. Using α = 0.05, power = 80%, a clinically significant difference of 0.5 mg/dL UA and hypothetical standard deviation (SD) of 0.4, the per group sample size is n = 8. Allowing for a 25% drop-out rate, our goal enrollment was 10 participants. After reviewing the literature, we were unable to derive an expected SD of urine UA, prohibiting calculation of a sample size using urine UA. We therefore sought to estimate the sample mean and standard deviation of urine UA for future use in sample size calculations. We used summary statistics: mean (µ) or median, SD or standard error (SE), frequencies and range to describe the characteristics of the participants. The mean difference of the dependent variables of interest between the VOC and steady state time points were compared using two-sided paired t-tests. Linear regression was used to determine any correlation of serum UA or Simkin index with the renal injury and inflammation biomarkers at the VOC time point and again separately for steady state. P-values for all tests are reported and a significance level of α p < 0.05 was considered significant. Statistical analysis was performed in JMP Pro 14.1.0 and SAS v9.4, and power calculations in nQuery Advanced v13.4.
Results
Ten participants initially enrolled in the study at VOC, however one participant became pregnant after the VOC admission and therefore excluded from the remainder of the study, and another did not complete the steady state visit. Therefore, eight participants completed the full study, which fulfilled our minimum sample size requirement. Due to a processing error, only seven pairs of samples had serum CRP analysis, but the remaining tests were performed on eight pairs of samples. Seven participants had homozygous sickle cell disease and one had Hemoglobin SC disease. One subject was active on a chronic blood transfusion protocol with the last transfusion 6 days prior to admission, one had been on chronic transfusions more than 1 year prior to the study, and the remaining were not ever on a chronic transfusion protocol. All participants were prescribed hydroxyurea and folic acid. Additional demographic and clinical characteristics of the study population are listed in Table 1.
Serum and urine UA
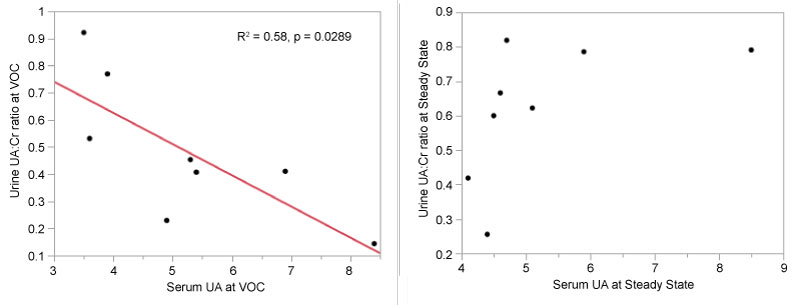
The primary research question in this study was to determine whether serum UA is higher at VOC compared to steady state. The mean, SD, and p-value of the mean differences at VOC and steady state are listed in Table 2. Two participants at VOC and two at steady state had hyperuricemia using a definition of UA > 5.5 mg/dL. The UA mean difference between VOC and steady state was 0.01 (SE 0.32), p = 0.5151. Hypothetically, if the intrinsic production of UA increases at VOC compared to steady state but renal excretion appropriately holds serum UA values constant, then an increase in the urine UA would result. The mean Simkin index was µ = 0.24 (SD 0.13) at VOC and µ = 0.29 (SD 0.14) at steady state, with no significant mean difference of 0.1367 (SE 0.156), p = 0.79. The mean urine uric acid to creatinine (UUA: Cr) ratio also did not differ between VOC and steady state (p = 0.7951).
Linear regression was used to determine correlations between serum UA and UUA: Cr at both time points as a decrease in renal excretion of UA may cause serum UA to rise. As shown in Figure 1, a significant negative correlation was found between the UUA: Cr and serum UA at VOC (R2 = 0.58, p = 0.0289, regression equation: UUA: Cr = 1.08 - 0.11*UA). This indicates that a higher UUA: Cr is correlated with a low serum UA, and vice versa. No correlation was found at steady state (p = 0.1612).
Inflammation and renal injury biomarkers
Modified Schwartz estimated GFR was lower at VOC compared to steady state (tended towards significance, mean difference = -12.69, p = 0.0785). The mean values of the renal injury and inflammation biomarkers were compared between VOC and steady state, shown in Table 2. Correlations between serum UA and each inflammatory or renal injury biomarker were also analyzed at each time point. There were no significant relationships (all p > 0.05) between serum UA and any of the following markers of renal injury or inflammation at VOC or steady state: urine KIM-1, ET-1, NAG, IL-18, Nlrp3, or serum CRP. However, there were correlations between some of these biomarkers and renal UA excretion (UUA: Cr and Simkin index) at each time point.
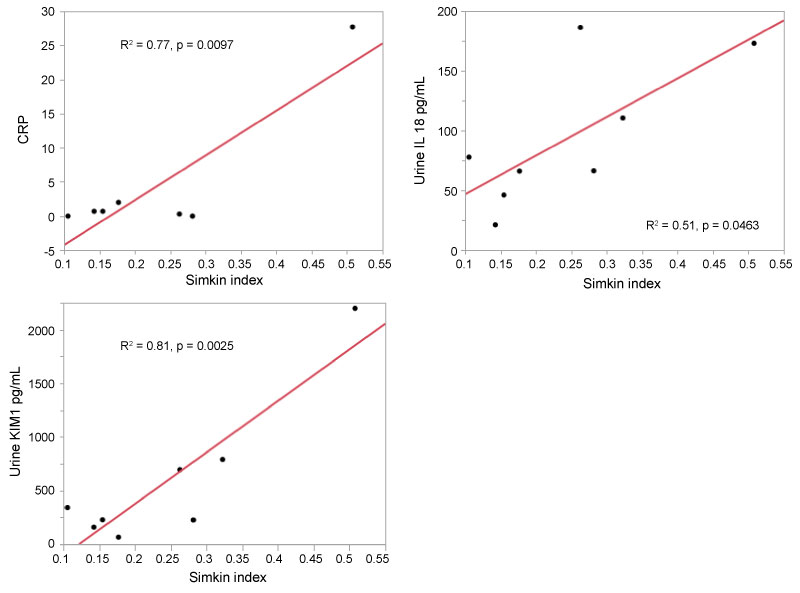
VOC (Figure 2A): At VOC, the Simkin index was positively correlated with serum CRP with an R2 = 0.77, p = 0.0097; regression equation CRP = -10.8 + 0.66*Simkin index. Simkin index was also positively correlated with urine KIM-1 with an R2 = 0.81 (regression equation F7,1 = 24.78, p = 0.0025; KIM-1 = -585.4 + 48*Simkin index), meaning that as Simkin index rose the value of urine KIM-1 also rose. Simkin index was also positively correlated with urine IL-18 with an R2 = 0.51 (regression equation F7,1 = 6.26, p = 0.0463; IL-18 = 14.4 + 3.23*Simkin index). That is, as Simkin index rose the value of urine IL-18 also rose.
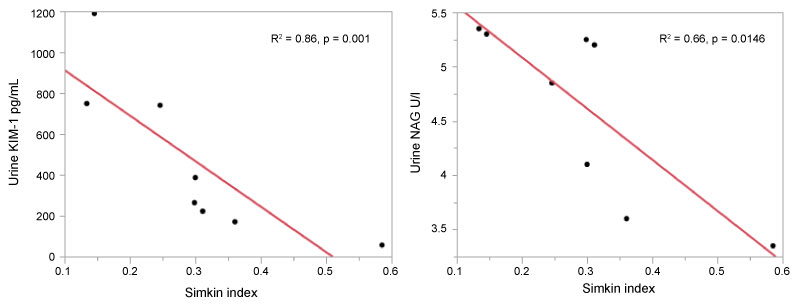
Steady State (Figure 2B): At steady state, opposing relationships were found between Simkin index and several renal injury biomarkers compared to the relationships found at VOC. While Simkin index was positively correlated with KIM-1 at VOC, there was a negative correlation at steady state, with an R2 = 0.67, F7,1 = 11.92, p = 0.0136; regression equation KIM-1 = 1135.5-2226.2*Simkin index. This regression formula indicates that an increase in Simkin index is correlated with a decline in urine KIM-1 at steady state.
While no correlation was found between Simkin index with urine NAG at VOC, at steady state it was negatively correlated (R2 = 0.66, F7,1 = 11.52, p = 0.0146, regression equation NAG = 6.03 - 0.05*Simkin index). That is, urine NAG decreased as Simkin index rose. No significant relationships were found between Simkin index and urine IL-18, Nlrp3, CRP, or ET-1 at steady state.
In summary, there was no difference between serum UA at VOC compared to steady state. However, linear regression revealed positive correlations between Simkin index and urine KIM-1, IL-18 and serum CRP at VOC. Conversely, there were negative correlations between Simkin index with urine KIM-1 and NAG at steady state.
Discussion
Limiting our analysis was the lack of a clinical definition that clearly identifies a VOC from steady state. Mean scores of the PedsQL 3.0 instrument tended towards a difference of being higher (improved quality of life scores) at steady state vs. VOC but were not significantly different in our limited sample size. Additionally, the application of this instrument is problematic in this study as it was validated at steady state and not for VOC.
The primary research question in this study was to determine if serum UA is greater during a hospitalized pain VOC compared to steady state, which would be consistent with the prevailing hypothesis that increased nucleotide production results in increased UA production. Through our analysis, we did not find evidence of a difference in mean serum UA at these time points. In fact, while our sample size is small, using the actual mean and SD results obtained in this study, we have > 97% power to detect a mean difference in UA at least as great as 0.5 mg/dL. Nevertheless, the overall low prevalence of hyperuricemia in this study population may have influenced this result. We also did not find a significant mean difference in the renal excretion of UA as calculated by the Simkin index or the UUA: Cr between the two time points. Our study was not specifically powered for this analysis because no prior mean and SD data are available, however, we can now use the mean and SD in these results to calculate sample size requirements for future studies. The lack of a mean difference in the serum UA between VOC and steady state is an important finding which can be used to plan future studies in a wider sickle cell population. Future studies are needed to determine the mechanism by which hyperuricemia occurs in SCA.
In this study, among the urine acute kidney injury biomarkers tested, only urine IL-18 was elevated at VOC compared to steady state, and both mean values were significantly elevated compared to previously reported normative values (normal = 0.4 +/- 0.2 pg/mL [36]). IL-18 uniquely identifies inflammatory states, and the finding that IL-18 and CRP are positively correlated with urine UA at VOC supports our hypothesis that UA activates Nlrp3 inflammation, and that patients experience a higher state of inflammation at VOC compared to steady state as described elsewhere [37-39].
However, where there were positive correlations at VOC of urine UA with KIM-1 and IL-18 consistent with known subacute kidney injury at VOC [40], we found opposing relationships between urine UA and KIM-1 and NAG at steady state. This can be explained by the known change in renal urate re-absorption depending on the presence of lactate and other carboxylate anions in the tubular lumen [23]. When urinary lactate is high in concentration in the tubular lumen, urate re-absorption is inhibited at the URAT1/OAT10 transporter. This results in uricosuria and a reduction in serum UA. However, when lactic acid is low in concentration in the tubular lumen, urate re-absorbtion becomes dependent on the presence and concentration of other carboxylate anions [23]. In VOC, the overall injury causing lactic acid production may also contribute to simultaneous subacute kidney injury and elevation of biomarkers, and the increase in urine UA itself may also contribute directly to Nlrp3-mediated renal injury [41].
The lack of a relationship between urine Nlrp3 at either time point may be related to the processing of this intracellular Nlrp3 molecule and the ability to consistently detect this protein in the urine [42-45]. Urine exosome analysis may be a more accurate way of examining intracellular activation of the Nlrp3 inflammasome. In addition, we stored the urine samples at -80 ℃ without a protease inhibitor for 3-6 months before analysis which may have affected the stability of the Nlrp3 molecule [46], although this method of storage has proven adequate for stability and fidelity of measurement of the other biomarkers analyzed [47].
Conclusion
Our study highlights the complexity of renal injury and renal uric acid excretion in SCA. While our sample size is small, we have > 97% power to detect at least a 0.5 mg/dL difference in means between VOC and steady state in our population. Our analysis shows that serum UA does not differ during the steady state as compared to a hospitalized VOC in SCA. While our study is underpowered to detect differences in urine UA and Simkin index between the two time points, it provides important mean and standard deviation results to plan for future studies on the mechanism of hyperuricemia development in SCA. Our pilot data also shows that UA is not overproduced in either state, with a mean Simkin index far below the threshold of UA overproduction. We report significant differences in the relationship of Simkin index to KIM-1, NAG, IL-18 and CRP at a time of VOC versus steady state. The association of urine UA to renal injury and inflammasome activation is supported here, and should be investigated further in larger sample sizes.
Acknowledgements
Funding for this research was provided by a grant from the Children's Hospital Foundation Research Fund and Children's Hospital Foundation. The project described was also supported by CTSA award No. UL1TR002649 from the National Center for Advancing Translational Sciences. Its contents are solely the responsibility of the authors and do not necessarily represent official views of the National Center for Advancing Translational Sciences or the National Institutes of Health.
Data Availability
The data used to support the findings of this study are available from the corresponding author upon request.
References
- EO Gosmanova, S Zaidi, JY Wan, et al. (2014) Prevalence and progression of chronic kidney disease in adult patients with sickle cell disease. J Investig Med 62: 804-807.
- KA Nath, RP Hebbel (2015) Sickle cell disease: Renal manifestations and mechanisms. Nat Rev Nephrol 11: 161-171.
- DR Powars (1991) Chronic renal failure in sickle cell disease: Risk factors, clinical course, and mortality. Ann Intern Med 115: 614-620.
- Ware RE, Rees RC, Sarnaik SA, et al. (2010) Renal function in infants with sickle cell anemia: Baseline sata from the BABY HUG trial. J Pediatr 156: 66-70.
- F Cachat, C Combescure, M Cauderay, et al. (2015) A systematic review of glomerular hyperfiltration assessment and definition in the medical literature. Clin J Am Soc Nephrol 10: 382-389.
- Lebensburger JD, Aban I, Pernell B, et al. (2019) Hyperfiltration during early childhood precedes albuminuria in pediatric sickle cell nephropathy. Am J Hematol 94: 417-423.
- Nielsen L, Canouï-Poitrine F, Jais JP, et al. (2016) Morbidity and mortality of sickle cell disease patients starting intermittent haemodialysis: A comparative cohort study with non- Sickle dialysis patients. Br J Haematol 174: 148-152.
- (2019) 2018 USRDS annual data report: Executive summary. Am J Kidney Dis.
- Kato GJ, Steinberg MH, Gladwin MT (2017) Intravascular hemolysis and the pathophysiology of sickle cell disease. J Clin Invest 127: 750-760.
- Alvarez O, Miller ST, Wang WC, et al. (2012) Effect of hydroxyurea treatment on renal function parameters: Results from the multi-center placebo-controlled BABY HUG clinical trial for infants with sickle cell anemia. Pediatr Blood Cancer 59: 668-674.
- B Aygun, NA Mortier, MP Smeltzer, et al. (2013) Hydroxyurea treatment decreases glomerular hyperfiltration in children with sickle cell anemia. Am J Hematol 88: 116-119.
- Roy NB, Fortin PM, Bull KR, et al. (2017) Interventions for chronic kidney disease in people with sickle cell disease. Cochrane Database Syst Rev.
- Rodenbach KE, Schneider MF, Furth SL, et al. (2015) Hyperuricemia and progression of CKD in children and adolescents: The Chronic Kidney Disease in Children (CKiD) cohort study. Am J Kidney Dis 66: 984-992.
- DI Feig (2012) The role of uric acid in the pathogenesis of hypertension in the young. J Clin Hypertens 14: 346-352.
- Matias ML, Romão M, Weel IC, et al. (2015) Endogenous and uric acid-induced activation of NLRP3 inflammasome in pregnant women with preeclampsia. PLoS One 10: e0129095.
- Miyaoka T, Mochizuki T, Takei T, et al. (2014) Serum uric acid levels and long-term outcomes in chronic kidney disease. Heart Vessels 29: 504-512.
- Hsu SP, Pai MF, Peng YS, et al. (2004) Serum uric acid levels show a 'J-shaped' association with all-cause mortality in haemodialysis patients. Nephrol Dial Transplant 19: 457-462.
- Tarcio Teodoro Braga, Maria Fernanda Forni, Matheus Correa-Costa, et al. (2017) Soluble uric acid activates the NLRP3 inflammasome. Sci Rep 7: 39884.
- M McDermott, S Kingsbury, Conaghan (2011) The role of the NLRP3 inflammasome in gout. J Inflamm Res 4: 39-49.
- GV Ball, LB Sorensen (1970) The pathogenesis of hyperuricemia and gout in sickle cell anemia. Arthritis Rheum 13: 846-848.
- BM Rothschild, CW Sienknecht, SB Kaplan, et al. (1980) Sickle cell disease associated with uric acid deposition disease. Ann Rheum Dis 39: 392-395.
- B Stiburkova, AJ Bleyer (2012) Changes in serum urate and urate excretion with age. Adv Chronic Kidney Dis 19: 372-376.
- K Mandal, DB Mount (2015) The molecular physiology of uric acid homeostasis. Annu Rev Physiol 77: 323-345.
- Sundaram N, Bennett M, Wilhelm J, et al. (2011) Biomarkers for early detection of sickle nephropathy. Am J Hematol 86: 559-566.
- JI Scheinman (2006) Tools to detect and modify sickle cell nephropathy. Kidney Int 69: 1927-1930.
- Voskaridou E, Terpos E, Michail S, et al. (2006) Early markers of renal dysfunction in patients with sickle cell/β-thalassemia. Kidney Int 69: 2037-2042.
- S Unal, C Kotan, A Delibas, et al. (2015) Cystatin C, Beta2 Microglobulin, N-Acetyl-beta-D-glucosaminidase, Retinol-Binding Protein, and Endothelin 1 Levels in the evaluation of sickle cell disease nephropathy. Pediatr Hematol Oncol 32: 250-257.
- Hamideh D, Raj V, Harrington T, et al. (2014) Albuminuria correlates with hemolysis and NAG and KIM-1 in patients with sickle cell anemia. Pediatr Nephrol 29: 1997-2003.
- Pierre-Louis Tharaux, Isabelle Hagège, Michel Vayssairat, et al. (2005) Urinary endothelin-1 as a marker of renal damage in sickle cell disease. Nephrol Dial Transplant 20: 2408-2413.
- De Miguel, JS Speed, M Kasztan, et al. (2016) Endothelin-1 and the kidney: New perspectives and recent findings. Curr Opin Nephrol Hypertens 25: 35-41.
- Ranque B, Menet A, Diop IB, et al. (2014) Early renal damage in patients with sickle cell disease in sub-Saharan Africa: A multinational, prospective, cross-sectional study. Lancet Haematol 1: e64-e73.
- X Lin, J Yuan, Y Zhao, et al. (2015) Urine interleukin-18 in prediction of acute kidney injury: A systemic review and meta-analysis. J Nephrol 28: 7-16.
- P Sharma, A Yasin, AX Garg, et al. (2011) Diagnostic accuracy of cystatin C-based eGFR equations at different GFR levels in children. Clin J Am Soc Nephrol 6: 1599-1608.
- PA Simkin (2003) New standards for uric acid excretion and evidence for an inducible transporter. Arthritis Rheum 49: 735-736.
- F Perez-Ruiz, M Calabozo, GG Erauskin, et al. (2002) Renal underexcretion of uric acid is present in patients with apparent high urinary uric acid output. Arthritis Rheum 47: 610-613.
- T Sueud, NR Hadi, R Abdulameer, et al. (2019) Assessing urinary levels of IL-18, NGAL and albumin creatinine ratio in patients with diabetic nephropathy. Diabetes Metab Syndr 13: 564-568.
- SK Ballas, K Gupta, P Adams-Graves (2012) Sickle cell pain: A critical reappraisal. Blood 120: 3647-3656.
- FA Mohammed, N Mahdi, MA Sater, et al. (2010) The relation of C-reactive protein to vasoocclusive crisis in children with sickle cell disease. Blood Cells Mol Dis 45: 293-296.
- S Krishnan, Y Setty, C Dampier, et al. (2009) Inflammatory biomarker CRP levels at baseline are associated with hospitalizations for childhood sickle cell vaso-occlusive crises. Am J Hematol.
- Audard V, Moutereau S, Vandemelebrouck G, et al. (2014) First evidence of subclinical renal tubular injury during sickle-cell crisis. Orphanet J Rare Dis 9: 67.
- Wang W, Wang X, Chun J, et al. (2013) Inflammasome-Independent NLRP3 Augments TGF- β Signaling in Kidney Epithelium. J Immunol 190: 1239-1249.
- SM Conley, JM Abais, KM Boini, et al. (2017) Inflammasome activation in chronic glomerular diseases. Curr Drug Targets 18: 1019-1029.
- X Zhang, AP Zou, PL Li (2015) Ceramide-induced activation of NADPH oxidase and endothelial dysfunction in small coronary arteries. Am J Physiol Circ Physiol 284: H605-H612.
- Xia M, Abais JM, Koka S, et al. (2016) Characterization and activation of NLRP3 inflammasomes in the renal medulla in mice. Kidney Blood Press Res 41: 208-221.
- Zhang C, Boini KM, Xia M, et al. (2012) Activation of nod-like receptor protein 3 inflammasomes turns on podocyte injury and glomerular sclerosis in hyperhomocysteinemia. Hypertension 60: 154-162.
- Zhou H, Yuen PS, Pisitkun T, et al. (2006) Collection, storage, preservation, and normalization of human urinary exosomes for biomarker discovery. Kidney Int 69: 1471-1476.
- Schuh MP, Nehus E, Ma Q, et al. (2016) Long-term stability of urinary biomarkers of acute kidney injury in children. Am J Kidney Dis 67: 56-61.
Corresponding Author
Kaspar CDW, Division of Nephrology, Children's Hospital of Richmond at Virginia Commonwealth University, Pediatrics, 1000 E. Broad St Box 980498 Richmond, VA 23298, USA, Tel: 804-628-3866.
Copyright
© 2019 Kaspar CDW, et al. This is an open-access article distributed under the terms of the Creative Commons Attribution License, which permits unrestricted use, distribution, and reproduction in any medium, provided the original author and source are credited.