Comparison of Multiparameter Flow Cytometry and ClonoSEQ Studies for Precursor B-Lymphoblastic Leukemia Minimal Residual Disease Detection on Bone Marrow Samples
Abstract
Introduction: Minimal residual disease (MRD) detection for precursor B-lymphoblastic leukemia (B-ALL) has become standard of care. We retrospectively compared MRD evaluation using COG Multiparameteric flow cytometry (MFC) and ClonoSEQ technique to assess the test characteristics.
Methods: Seventy-four bone marrow samples from thirty-one B-ALL patients were collected at Roswell Park Cancer Center (RPCC) between January 2021 and March 2022. MRD value was calculated for both MFC and ClonoSEQ.
Results: COG MFC and ClonoSEQ results were concordant in 59/74 samples (80%) with positive concordant results in 12 samples (16%) and negative concordant results in 47 samples (64%). Discordant results were seen in 15/74 samples (20%); with 14 samples (19%) showing ClonoSEQ+/MFC- results and only 1 sample (1%) showing MFC+/ClonoSEQ- result. ClonoSEQ+/MFC- cases had MRD values ranging from 1 to 1400 cells/million nucleated cells with 86% of cases showing MRD values of < 100 cells/million nucleated cells. Newly identified dominant sequences were detected using ClonoSEQ in 2/31 patients (6%) during follow up. Eight patients out of 27 MRD positive cases underwent hematopoietic stem cell transplantation (HSCT), one of whom died briefly after transplant of post-transplant complications.
Conclusion: Our results show strong correlation between COG MFC and ClonoSEQ (r = 0.96), and both methods are complementary.
Keywords
Precursor B-lymphoblastic leukemia, Minimal residual disease¬, Multiparametric flow cytometry, Next generation sequencing, Sensitivity
Introduction
Minimal or measurable residual disease (MRD) in acute leukemia is defined as the presence of leukemic blasts from the limit of detection (usually 0.001% - 0.01%) to 5% [1]. Precursor B-lymphoblastic leukemia (B-ALL) patients in morphologic remission may still have measurable disease detected by highly sensitive methods. The choice of an optimal method for MRD measurement depends on the test characteristics and clinical scenarios [2]. MRD values are reported to have a general prognostic and therapeutic implication for B-ALL [3]. B-ALL patients with end-induction MRD less than 0.01% had 5-year event-free survival (EFS) higher that those with MRD 0.01%-0.1% [4]. MRD measurements are now standard of care for managing B-ALL patients. Blinatumomab, a bi-specific T-cell engager (BiTE), is approved for use in B-ALL patients in first or second remission with MRD ≥ 0.1% (10-3). It has shown high response rate and prolonged leukemia-free survival [5]. MRD evaluation also serves as a prognostic indicator and therapy modification variable in stem cell transplantation, where this has led to more improvement in childhood and adult ALL cure rates [6].
Different methods for MRD detection are available where cells are either identified through differential patterns of marker expression by multiparametric flow cytometry (MFC) or through differential gene expression through analysis by PCR or next-generation sequencing (NGS). On comparing MFC to NGS, the turnaround time (TAT) is much shorter for MFC than NGS with a much lower cost. In addition, MFC has been widely implemented in many flow cytometry laboratories for MRD testing. One of the advantages of NGS though is that the sample can be frozen and stored after DNA extraction to be analyzed later unlike MFC which requires fresh sample. It should also be noted that to date more work has already been done in MFC field with standardized protocols being set in different consortia whereas the NGS still has limited standardization. One of the main limitations for PCR is the need for using patient specific reagents. To overcome this, MRD assessment combining both PCR and NGS approaches have been developed so that PCR "consensus primers" are used to allow the amplification of the complete set of immunoglobulin (Ig) gene sequences in a patient sample instead of relying on unique patient-specific PCR primers and probes [7].
To date, MFC and real-time quantitative-PCR are considered the gold standard methods for MRD detection. NGS was shown to have a high concordance with these techniques in addition to being highly sensitive and versatile [8]. ClonoSEQ is a platform received first approval of an NGS-based assay by the U. S. Food and Drug Administration (FDA) for MRD measurement in B-ALL and multiple myeloma [9]. It uses both the multiplex PCR and the NGS techniques to identify and track unique disease-associated Ig heavy chain (IgH), and kappa (IgK) and lambda light chain (IgL) gene rearrangements as well as IgH-BCL1/2 translocations in the malignant B cells [10].
So far, there is no national or international consensus as to when, where and by which method(s) the MRD studies should be performed, although regional recommendations do exist [11]. In this retrospective study, we compared MRD evaluations for B-ALL at different time points during follow up by two different techniques: MFC using the standardized COG panel and the NGS-based ClonoSEQ. We aimed to compare the tests characteristics of both MRD evaluation methods. We also studied immunophenotypic patterns in positive MRD cases; evaluated impact of Blinatumomab targeted therapy on MRD testing; and observed frequency of disease relapse, Philadelphia chromosome and transplant status during MRD testing for those pre-B ALL patients.
Materials and Methods
Sample collection for MRD testing
This retrospective study included 75 bone marrow samples from 31 B-ALL patients (17 males and 14 females) collected at the Department of Hematopathology, Roswell Park Cancer Center (RPCC) during the time from October 2020 to April 2022. Samples were obtained at clinical remission and at approximately 1-6-months intervals thereafter. All patients had a diagnosis of B-ALL initially established by histopathology morphologic evaluation, phenotyping by flow cytometry and immunohistochemistry, and genetics studies performed at RPCC. All samples were subjected to MRD evaluation using COG MFC panel in addition to NGS performed in parallel using ClonoSEQ (Adaptive Biotechnologies Corporation, Seattle WA, USA). DNA was extracted from original diagnostic sample as a baseline. Baseline DNA sample was sent along with subsequent bone marrow for ClonoSEQ MRD analysis.
Bone marrow sample examination
All bone marrow samples including bone marrow aspirate, touch imprints and biopsy were examined microscopically including a 500-cell manual differential. Routine hemotoxin and eosin (HE) stain and immunohistochemistry study were also performed on biopsy cores and clot sections.
MFC for B-ALL MRD testing
MFC for B-ALL MRD was performed using a 5-tube 8-color panel on a FACS Canto X flow cytometer (BD Biosciences), where the first 3 tubes represent the COG protocol [4]. The third tube contains SYTO-16 used for quantification of nucleated cells. The fourth tube is customized for RPCC, where CD24 is to analyze B cells. CD66b is added to exclude neutrophils since CD24 is also expressed on neutrophils. A target of 1,000,000 events was set, resulting in analytic sensitivity of 0.01%. However, the actual number of collected events ranged from 400,000 to 1 million events due to the suboptimal sample quality in some cases. MRD value was reported as a percentage of leukemic cells of nucleated mononuclear cells.
ClonoSEQ for B-cell clonality MRD analysis
Detailed methodology for ClonoSEQ assay can be found elsewhere [10]. Briefly, the assay amplifies genomic regions present as diploid copies in normal gDNA to quantify the total nucleated cell content of a sample. A sequence is considered acceptable for tracking if it comprises at least 3% of all B-cell receptor sequences at a given locus and at least 0.2% of all nucleated cells in the sample (dominant sequence). The dominant sequence is well separated from the background repertoire. Sequence uniqueness is assessed by comparison with a large database of previously observed Ig rearrangements. Depending on its incidence in the database, each sequence is assigned a uniqueness score that reflects its likelihood of being detected in a healthy repertoire. Sequences with poor uniqueness scores are excluded from MRD tracking to avoid false MRD results. Once suitable disease-associated sequences have been identified, these ID sequences are compared with those found in successive MRD sample(s) for tracking.
Statistical analysis
Statistical comparison of events collected for MFC and ClonoSEQ was performed by Welch Two Sample t-test, whereas the correlations between COG MFC and ClonoSEQ MRD test results were evaluated by Pearson correlation analysis. The data were expressed as mean ± standard deviation (SD) and the p-value of less than 0.05 was considered as statistically significant.
Results
Study population
Patients' age ranged from 2 to 76-years-old with a median age of 46-years-old, including 5 children and 26 adults. Patients' demographic data, their Philadelphia chromosome status and transplant status are shown in Table 1.
Morphologic evaluation
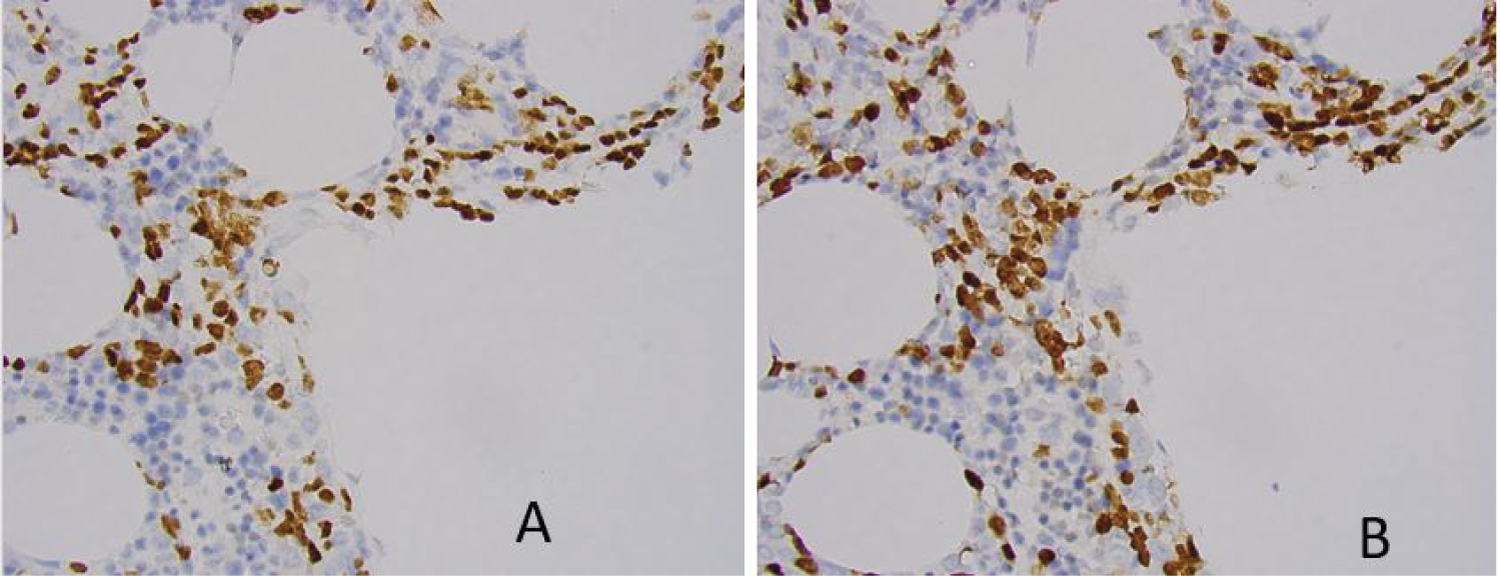
As part of minimal residual disease evaluation, immunohistochemistry is utilized to assess the distribution of the immature B-cells in the bone marrow biopsy core. Three bone marrow specimens showed tight clusters of immature B-cells. However, all three cases turned out to be MRD negative by both MFC and by ClonoSEQ methods. An example of immature B cell clusters demonstrated by immunohistochemistry study on biopsy core sections are shown in Figure 1.
Antigen expression profile by MFC MRD study
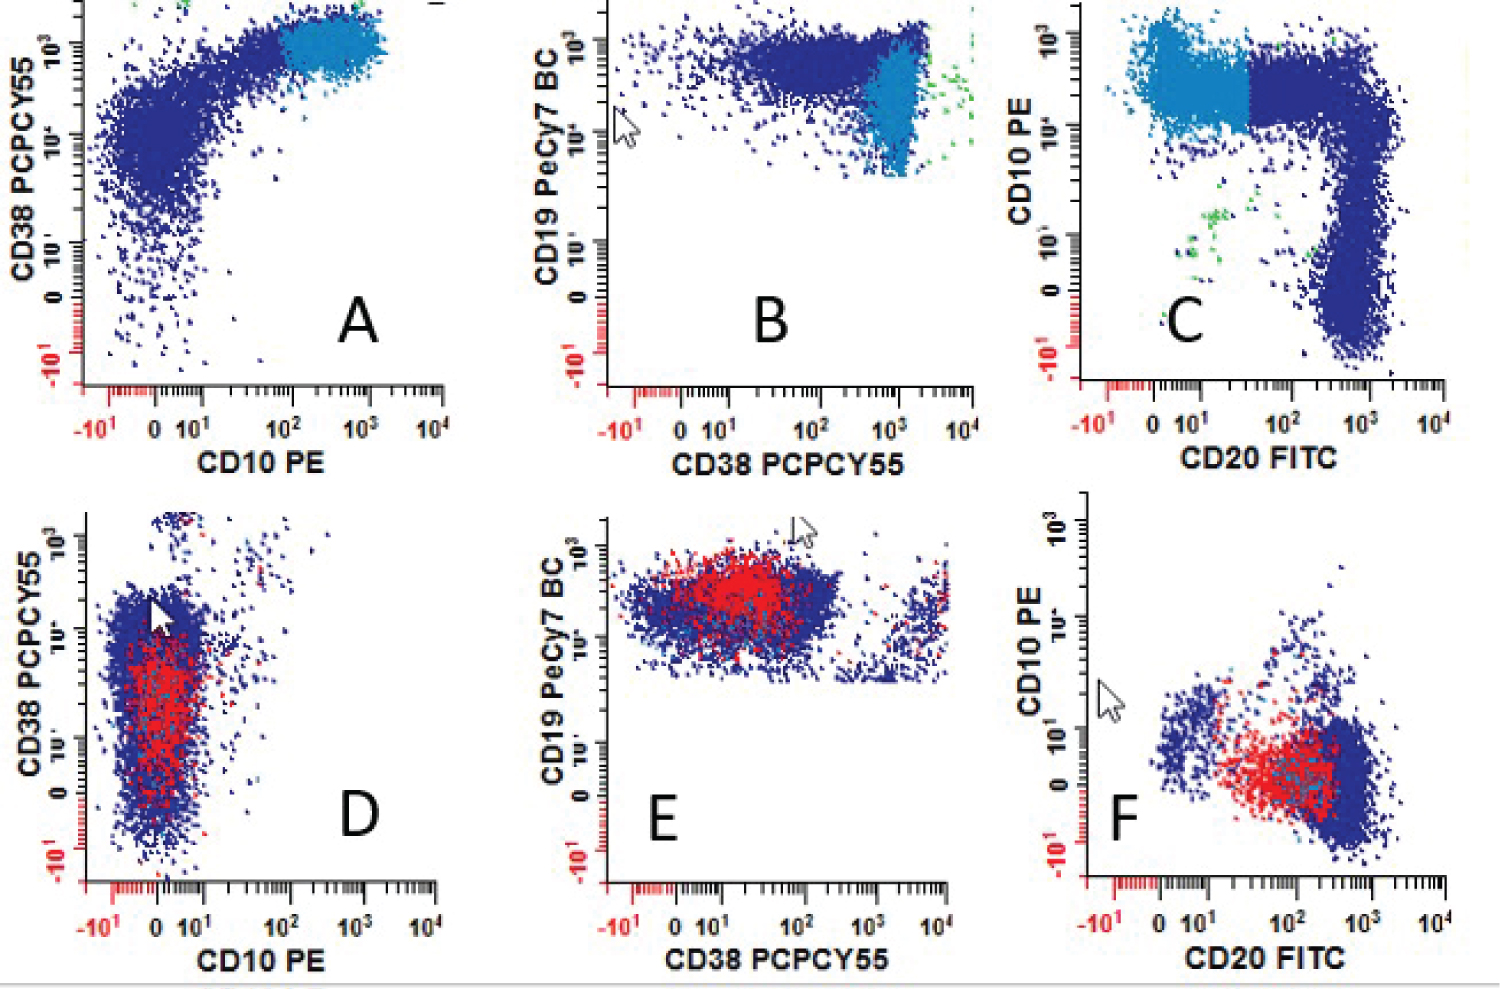
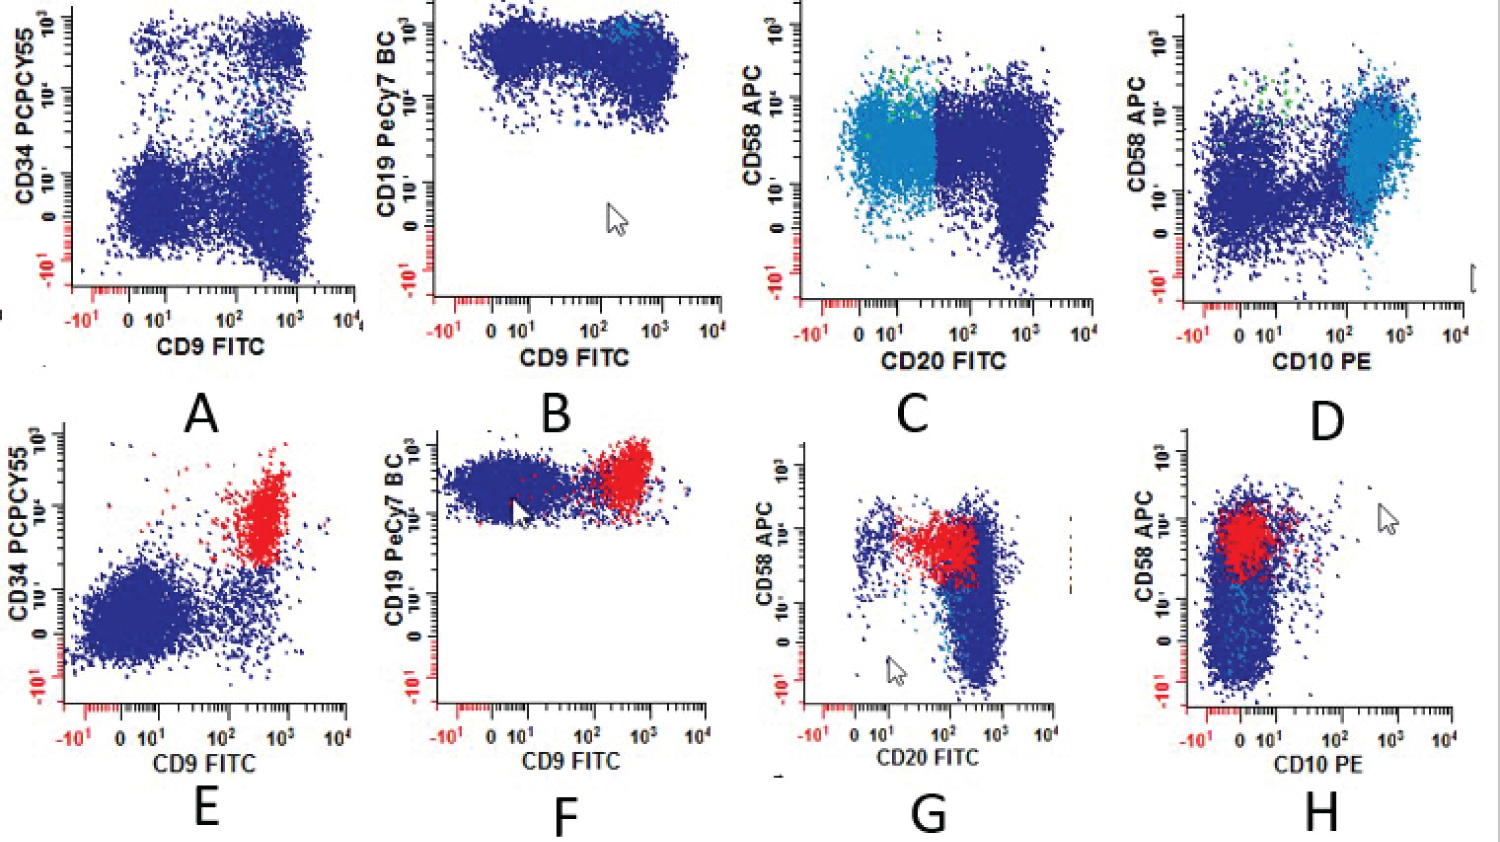
For cases that were positive by COG MRD MFC, antigen expression patterns including antigen intensity (semiquantitative) were recorded. The frequency of aberrant antigen expression was analyzed and summarized in Table 2. Examples for different intensities of CD38 antigen expression are illustrated in Figure 2 and the expression patterns for CD9 and CD58 are shown in Figure 3. Antigen expression intensity determination follows College of American Pathologist (CAP) Flow Cytometry Proficiency Testing recommendations.
Comparison of MFC and ClonoSEQ for the detection of B-ALL MRD
As shown in Table 3, among the 74 evaluated bone marrow samples from 31 B-ALL patients, COG MFC and ClonoSEQ results were found to be concordant in 59 out of 74 samples (80%) with positive concordant results in 12 samples (16%) and negative concordant results in 47 samples (64%). Discordant results were noted in 15 out of the 75 samples (20%); where 14 samples (19%) showed positive results using the ClonoSEQ evaluation but were MRD negative when evaluated by MFC. Only 1 sample (1%) was MRD positive by MFC while MRD was not detected by ClonoSEQ. The average events collected for MFC (779,915 ± 306,291, n = 74) were much lower than that for ClonoSEQ (2,571,168 ± 1,112,501, n = 73) (p < 0.05). On further analysis of the cases showing MRD positivity by ClonoSEQ but not by MFC, it was noted that the MRD values ranged from 1 to 1400 cells/million nucleated cells. It is worth mentioning that 86% of these cases showed MRD values of < 100 cells/million nucleated cells. If using 20 events as cut-off (only more than 20 abnormal events are true positive), the concordance rate is 95% (Table 3). A strong positive correlation between COG MFC and ClonoSEQ results was noted among all evaluated cases (r = 0.96).
Effect of Blinatumomab therapy on CD19 measurements
Many patients had gone through Blinatumomab immunotherapy as part of the treatment protocol at RPCC. MFC and ClonoSEQ were performed 1 to 14 months after Blinatumomab therapy on 14 bone marrow samples from 8 patients. 5 patients are either relapsed B-ALL or had positive MRD by MFC or ClonoSEG. All 14 samples were MRD negative by MFC but 3 cases were MRD positive by ClonoSEQ. 2 out of the 3 samples had ClonoSEQ MRD value below LOD while one had 12/million cells. CD24/CD66b approach was also used to identify abnormal B-cells on these three cases (MFC-/ClonoSEQ+) with the same MFC results. Of note, all three patients with MFC-/ClonoSEQ+ results are currently clinical stable without relapsed B-ALL disease. B-cells with positive CD19 expression and total CD3 events were measured. B-cells with CD19 expression was detected in about 15,081 normal B-cells that constituted about 1.6% of total white blood cells, while T-cells with CD3 expression was detected in about 25,449 events that contribute 16% of total nucleated cells measured by SYTO16.
Dominant sequences identified by ClonoSEQ
There was one case where no dominant sequence was identified from the diagnostic sample yet follow up samples showed dominant sequences. Newly identified dominant sequences were detected using ClonoSEQ in 2 out of the 31 studied patients (6%) along their follow up course, where 1 newly identified dominant sequence was reported in one case and 2 newly identified dominant sequences were reported in the other. During the subsequent follow up samples for these 2 patients, MRD was assessed based on the originally identified dominant sequences detected in the diagnostic sample.
Clinical outcome of studied pre-B ALL patients
Only 1 patient relapsed out of the 28 MRD positive cases and the patient was Philadelphia positive. Eight patients out of 28 MRD positive cases underwent hematopoietic stem cell transplantation (HSCT), of which only one patient died soon after the transplant due to post-transplant complications. None of the other patients had relapsed by the time this study was conducted. The follow up duration ranged from 1 to 20 months with a median follow-up of 8 months, during which disease progression was confirmed in only one patient.
Discussion
It has been extensively studied and widely accepted that MRD status is an important prognostic factor in adult and pediatric B-ALL patients [12,13]. Currently, the most common methods to test MRD for B-ALL are qPCR and MFC with NGS emerging [13,14]. Comparing the test characteristics of MFC and NGS for B-ALL MRD will help to develop future testing algorithm.
Phenotypic features of B-ALL MRD
As part of B-ALL MRD evaluation, immunohistochemistry is usually utilized to assess the distribution of the immature B-cells in the bone marrow biopsy core. Occasionally bone marrow aspirate sample is inadequate or unavailable for these highly sensitive MRD monitoring methods by MFC and NGS. Bone marrow examination remains essential, especially therapy could affect marker expression that challenges MRD evaluation by MFC. Presence of cluster of immature cells is usually concerning for residual leukemic blasts. Ayyana, et al. reported small and large clusters of immature cells are present in 12 out of 18 (66.7%) acute leukemia patients in sustained remission [15]. Similar to their observations, we found three cases in our study where small and large clusters of immature B-cells are present but proven to be B-ALL in remission without MRD by MFC and ClonoSEQ. It is very unlikely MRD was falsely negative by both MFC and ClonoSEQ methods, given their high sensitivity. It is also true that MRD value may very low, e.g., less than 1% by MFC and molecular methods, while there is resistant disease with more than 20% B-lymphoblasts, as reported by Rathe, et al. [16]. Despite MRD monitoring by MFC and NGS cannot fully replace bone marrow morphology in assessing disease status in acute leukemias, as recommended in a series of case report by Rathe [16], the finding in our study and others indicate the limitation of morphologic evaluation on B-ALL residual disease evaluation. Clusters of immature B-cells may not necessary indicate residual leukemic cells and could represent regenerate B-cell precursors.
The interpretation of MRD MFC data, especially at MRD levels < 0.01%, is still expert-based and requires a lot of experience [17]. The qualitative designation of positive and negative MRD results largely depends on the presence of clusters abnormal events. Most hematopathologists/flow cytometrists feel comfortable assigning qualitative significance to a clustered distribution of at least 20 cells (limit of detection, LOD). When a clearly positive cluster of cells is evident that bears a phenotype consistent with the patient's disease and/or previously measured phenotype but the number of events is less than 20 events, suspicious for MRD may be reported. Cases with suspicious for MRD findings also classified as positive in our study. Although the number of events may be defined, the distance from normal and homogeneity of the population are more complex to be objectively defined and are subject to variability based on subjective interpretation. To differentiate abnormal from normal events, there are certain B-cell maturation patterns to help the determination include asynchronous antigen expression, e.g., CD34 expression without CD10; cross-lineage antigen expression, e.g., CD15 expression on the leukemic blasts, over or under expression: brighter CD10 or lack of CD38, aberrant light scatter, etc [18]. In COG protocol, MRD was identified based on the position of cells on dual parameter displays in areas known not to contain any normal elements (so-called empty spaces) [4]. In our study, we observed the most frequent phenotype changes, and the most reliable discriminator is the CD38 and CD10 expression intensities, especially the combination of both. The importance of this finding should be emphasized in B-ALL MRD evaluation. CD38 is usually expressed in lower intensity in B-lymphoblasts (moderate or dim) than in hematogones (bright). CD10 can be expressed either stronger or dimmer/negative in B-lymphoblasts than expressed in hematogones. Our findings are similar to those reported by others [19]. Negant, et al. [20] also noted that the combined use of both markers is more useful in the differentiation between both populations than using either of them alone. On examining the MFI ratio of CD38/CD10, they reported that this ratio was significantly higher on hematogones compared to that in B-lymphoblasts.
The use of Blinatumomab and other targeted therapy has compounded MRD testing for B-ALL disease monitoring, as pointed out by many investigators [5,21]. Topp, et al., reported after Blinatumomab 16 of 20 patients converted from MRD positive to MRD negative examined by PCR method [5]. In our study, we observed three cases where MFC was negative, but ClonoSEQ was positive after Blinatumomab therapy while remaining 5 samples were negative for both MFC and ClonoSEQ. The three MFC-/ClonoSEQ+ cases may represent CD19 negative persistent B-ALL MRD cases. CD19 negative B-ALL MRD was reported in 21-30% of patients after targeted therapy [22]. However, all three cases in our study had very low ClonoSEQ MRD value either below LOD or less than 20 abnormal events/one million cells that are below MFC detection. We did not find CD24/CD66b approach is helpful in identifying abnormal B-cell population for those three cases. It is challenging to monitor MRD after CD19 target therapy by MFC. One may consider NGS or other molecular approach in this clinical scenario. Nevertheless, these three patients are clinically stable without clinical relapse of B-ALL. The normal B-cells (1.6% on average) detected by MFC from 14 bone marrow samples may represent regenerating B-cell precursors and/or mature B-cells. The presence of CD3 T-cells (16% of nucleated cells on average) argues against the loss of cytotoxic effect of Blinatumomab molecules.
The B-ALL MRD MFC interpretation also compounded by other factors that include but are not limited to technical constraints, for example poor sample quality, low tumor burden, immunophenotypic shifts and clonal selection [12].
NGS evaluation for B-ALL MRD
NGS has high sensitivity, assumed to be 10-7, for MRD detection and has recently been introduced to clinical study through commercial assays such as LymphoTrack (Invivoscribe) and ClonoSEQ [22]. NGS for MRD testing has also been used for other hematopoietic malignancies [8] such as multiple myeloma [23] and chronic lymphocytic leukemia [24]. NGS based MRD testing has 1- to 2- logs higher sensitivity than that by MFC [3]. In our study, those positive MRD detected by ClonoSEQ but not by MFC had low MRD values. One strength of the ClonoSEQ for B-ALL MRD evaluation is its ability to track multiple receptor sequences from the same clonal malignant cells and tracking multiple sequences improves the precision of the assay [10].
ClonoSEQ assay requires diagnostic sample with relatively high disease burden to identify disease-associated clonotypes, namely dominant sequence(s). This requirement may limit access to ClonoSEQ testing sometimes. At RPCC, DNA is routinely extracted from diagnostic bone marrow samples, which is submitted along with MRD follow up samples. Hematopathologists and clinicians also need to realize that not all expanded clonal gene rearrangements detected by NGS arise from an underlying malignancy. Thus, identification of the diagnostic dominant sequence is very important for MRD measurement. We observed one case where no dominant sequence identified for leukemic blasts in diagnostic sample by ClonoSEQ, which may be due to lacking a rearranged Ig locus [9]. Not all lymphoid malignancies necessarily display a detectable Ig rearrangement, and this highlights the importance of concurrent use of other MRD detecting methods such as MFC. Other causes that may lead to failure to detect any diagnostic clone include primer issues and biologically incomplete gene rearrangement, etc. [23].
In our study, we observed three cases with clonal evolution where new clonal Ig rearrangements detected by ClonoSEQ. So far, there is limited research on clonal evolution of Ig gene rearrangement during B-ALL follow up. More study is needed to understand the clinical significance of clonal evolution in B-ALL patients.
Comparison of MFC and NGS for B-ALL MRD evaluation, how sensitive is enough?
The comparison between MFC and NGS for B-ALL MRD evaluation has been previously studied. Torra, et al. reported at least one immunoglobulin clonal sequence identified in 91% of pre-treatment specimens [14]. In follow up samples, both MFC and ClonoSEQ were performed and 82% of cases were concordant. Almost all discordant cases were ClonoSEQ positive and MFC negative. Patients with negative MRD by both NGS and MFC had excellent OS and RFS. In contrast, patients who were positive for MRD by both NGS & MFC had the poorest outcome, whereas patients who were NGS positive but MFC negative had an intermediate outcome. In a study by Wood, et al., [25], high throughput sequencing (HTS) was used to compare with COG MFC MRD detection in cases of B-ALL. Using a threshold of 0.01%, both methods showed similar 5-year EFS and OS for MRD-positive and negative patients. However, MRD was detected at levels higher than 0.01% in fifty-five patients by HTS but not by MFC. These cases represented 38.7% of patients and were found to have a worse 5-year EFS compared to other cases who had MRD levels below 0.01% by HTS (p = 0.036). Meanwhile, 17 patients were reported to be MRD+ by MFC with values > 0.01% but their MRD values by HTS were found to be < 0.01%. The MRD values for 11 out of the 17 patients ranged from 0.001% to 0.01% by HTS but no further statistical analysis was possible because of the small number of patients in this group (17).
In our study, the two methods (MFC and ClonoSEQ) were compared regarding their ability to detect the presence of any residual leukemic cells. Overall, the concordance rate was 80%. Discordant cases were mostly MFC-negative and Clonoseq-positive (n = 14, 19 %), whereas only one MFC-positive and ClonoSEQ-negative sample was seen (n = 1, 1%). Correlation of the measured tumor burdens between the two methods in the entire cohort as well as in the concordant cases was very high (r = 0.96). Our findings are like those reported by Torra except we do not have survival data due to relatively short follow up time period.
ClonoSEQ detects very low levels of residual clonal cells in our study. Some cases found to have more than 0 but less than 1 residual clonal cells per million nucleated cells. However, in the employed COG MFC MRD panel, a cluster of 20 events is required to report definite residual disease. The clinical significance of such low levels detected by ClonoSEQ and their impact on the patient's prognosis is unclear at this point. MRD results are highly dependent on the quality and concentration of the samples, which is directly related to preanalytical conditions [24]. At RPCC, samples from the 1st and 2nd pull are submitted for morphological and molecular evaluations (ClonoSEQ included) whereas samples for flow cytometric evaluation come from subsequent pulls which may play a role in the lower quality of the sample and lower incidence of detection of abnormal populations due to the dilution of the specimens. In our study, total events obtained for MFC MRD is average at 779,915 cells while 2,571,168 cells for ClonoSEQ study. The volume and cellularity of sampled input material may also be a problem during treatment in cases of bone marrow aplasia [10]. Other previously noted possible explanations for discordance between molecular (such as PCR) and MFC results in MRD evaluation included: Non-specific amplification of DNA in PCR, oligoclonality, clonal evolution, quality of clonal PCR-markers, immunophenotypic shifts and immunophenotypic modulation post-therapy among others [26]. The case of MFC+/ClonoSEQ- in our study exemplifies that MFC and NGS are complimentary for B-ALL MRD testing.
Impact of clinical conditions to the MRD monitoring
Compared to Ph- B-ALL, MRD monitoring for Ph+ B-ALL patients are less defined [3]. We had 9 cases of Ph+ B-ALLs in our study, only 2 out of 9 patients had been transplanted. All patients but one was in molecular remission with negative MRDs. We did not observe higher positive MRD incidence in Ph+ B-ALL cases compared with those Ph- cases. Presumably this might be due to highly effective clinical chemotherapy/immunophenotherapy regimes. It seems that no difference is observed in our limited case study between Ph+ B-ALLMRD by MFC and NGS and Ph- B-ALL MRD testing, but definite determination relies on further investigation.
Conclusions
In conclusion, our results show a very strong correlation between COG MFC and ClonoSEQ results among all evaluated cases (r = 0.96) and are concordant in 80% of cases. At this point in time, we believe that both methods are complementary and that using different strategies to detect B-ALL MRD is important. The significance of very low levels of MRD detected by ClonoSEQ is unknown at this time and requires long-term follow up to evaluate prognosis on those patients.
References
- Buckley SA, Appelbaum FR, Walter RB (2013) Prognostic and therapeutic implications of minimal residual disease at the time of transplantation in acute leukemia. Bone Marrow Transplant 48: 630-641.
- Correia RP, Bento LC, de Sousa FA, et al. (2021) How I investigate minimal residual disease in acute lymphoblastic leukemia. Int J Lab Hematol 43: 354-363.
- Short NJ, Jabbour E (2017) Minimal residual disease in acute lymphoblastic leukemia: How to recognize and treat It. Curr Oncol Rep 19: 6.
- Borowitz MJ, Wood BL, Devidas M, et al. (2015) Prognostic significance of minimal residual disease in high-risk B-ALL: A report from Children's Oncology Group study AALL0232. Blood 126: 964-971.
- Topp MS, Kufer P, Gokbuget N, et al. (2011) Targeted therapy with the T-cell-engaging antibody Blinatumomab of chemotherapy-refractory minimal residual disease in B-lineage acute lymphoblastic leukemia patients results in high response rate and prolonged leukemia-free survival. J Clin Oncol 29: 2493-2498.
- Lovisa F, Zecca M, Rossi B, et al. (2018) Pre-and post-transplant minimal residual disease predicts relapse occurrence in children with acute lymphoblastic leukaemia, Br J Haematol 180: 680-693.
- Kruse A, Abdel-Azim N, Kim HN, et al. (2020) Minimal residual disease detection in acute lymphoblastic leukemia. Int J Mol Sci 21: 1054.
- Sánchez R, Ayala R, Martínez-López J (2019) Minimal residual disease monitoring with next-generation sequencing methodologies in hematological malignancies. Int J Mol Sci 20: 2832.
- Monter A, Nomdedéu JF (2019) ClonoSEQ assay for the detection of lymphoid malignancies. Expert Rev Mol Diag 19: 571-578.
- Ching T, Duncan ME, Newman-Eerkes T, et al. (2020) Analytical evaluation of the clonoSEQ Assay for establishing measurable (minimal) residual disease in acute lymphoblastic leukemia, chronic lymphocytic leukemia, and multiple myeloma. BMC Cancer 20: 612.
- Tierens A, Stockley TL, Campbell C, et al. (2021) Consensus recommendations for MRD testing in adult B-cell acute lymphoblastic leukemia in Ontario. Curr Oncol 20: 1376-1387.
- Cheng S, Inghirami G, Cheng S, et al. (2018) Simple deep sequencing-based post-remission MRD surveillance predicts clinical relapse in B-ALL. J Hematol Oncol 11: 105.
- Liu Z, Li Y, Shi C (2021) Monitoring minimal/measurable residual disease in B-cell acute lymphoblastic leukemia by flow cytometry during targeted therapy. Int J Hematol 113: 337-343.
- Torra OS, Othus M, Williamson DW, et al. (2017) Next-generation sequencing in adult B cell acute lymphoblastic leukemia patients. Biol Blood Marrow Transplant 23: 691-696.
- Ayyanar P, Kar R, Dubashi B, et al. (2021) Post chemotherapy changes in bone marrow in acute leukemia with emphasis on detection of minimal residual disease by immunohistochemistry. Cureus 13: e20175.
- Rathe M, Preiss B, Marquart HV, et al. (2020) Minimal residual disease monitoring cannot fully replace bone marrow morphology in assessing disease status in pediatric acute lymphoblastic leukemia. APMIS 128: 414-419.
- Theunissen P, Mejstrikova E, Sedek L, et al. (2017) EuroFlow Consortium. Standardized flow cytometry for highly sensitive MRD measurements in B-cell acute lymphoblastic leukemia. Blood 129: 347-357.
- Cherian S, Soma LA (2021) How I diagnose minimal/measurable residual disease in B lymphoblastic leukemia/lymphoma by flow cytometry. Am J Clin Pathol 155: 38-54.
- Chernysheva O, Grivtsova LY, Popa A, et al. (2020) B-cell precursors: Immunophenotypic features in the detection of minimal residual disease in acute leukemia. In: M Aribi, Normal and malignant B-cell. Intechopen.
- Nagant C, Casula D, Janssens A, et al. (2018) Easy discrimination of hematogones from lymphoblasts in B cell-progenitor acute lymphoblastic leukemia patients using CD81/CD58 expression ratio. Int J Lab Hematol 40: 734-739.
- Mikhailova E, Semchenkova A, Illarionova O, et al. (2021) Relative expansion of CD19-negative very-early normal B-cell precursors in children with acute lymphoblastic leukaemia after CD19 targeting by blinatumomab and CAR-T cell therapy: Implications for flow cytometric detection of minimal residual disease. Br J Haemat 193: 602-612.
- Hansen MH, Cedile O, Larsen TS, et al. (2021) Perspective: Sensitive detection of residual lymphoproliferative disease by NGS and clonal rearrangements-How low can you go? Exp Hematol 98: 14-24.
- Medina A, Puig N, Flores-Montero J, et al. (2020) Comparison of next-generation sequencing (NGS) and next-generation flow (NGF) for minimal residual disease (MRD) assessment in multiple myeloma. Blood Cancer J 10: 108.
- Thompson PA, Srivastava J, Peterson C, et al. (2019) Minimal residual disease undetectable by next-generation sequencing predicts improved outcome in CLL after chemoimmunotherapy. Blood 134: 1951-1959.
- Wood B, Wu D, Crossley B, et al. (2018) Measurable residual disease detection by high-throughput sequencing improves risk stratification for pediatric B-ALL. Blood 131: 1350-1359.
- Gaipa G, Cazzaniga G, Valsecchi MG, et al. (2012) Time point-dependent concordance of flow cytometry and real-time quantitative polymerase chain reaction for minimal residual disease detection in childhood acute lymphoblastic leukemia. Haematologica 97: 1582-1593.
Corresponding Author
You-Wen Qian, MD, Division of Hematopathology, Department of Pathology and Laboratory Medicine, Roswell Park Cancer Center Basic Science Building, Room 529 Elm St & Carlton St Buffalo, NY 14203, USA, Tel: 716-845-2300 x5631
Copyright
© 2023 Momen N, et al. This is an open-access article distributed under the terms of the Creative Commons Attribution License, which permits unrestricted use, distribution, and reproduction in any medium, provided the original author and source are credited.