The Identification of Stomach Cancer with Semi-Automatic Region Growing Segmentation Method
Abstract
This study was conducted so as to identify the cancerous area in the stomach in a semi automatic way using image processing techniques. The aim was to identify the area suspected of being cancerous by studying the point which the doctor suspected of being cancerous in the patients. Although we cannot say that the whole area which was diagnosed as cancerous, it would be helpful for doctors to identify the area and the site of the biopsy taken. In this way, the results of the biopsy would make it possible to offer more accurate results to the patients and the doctors in order to come up with more precise results. In our study, Accuracy, Sensitivity, Specificity, Confusion Matrix and ROC analysis values were calculated through examination after endoscopic images were taken from the patients. When the results were evaluated, it was seen that sensitivity values of 98.93% were achieved in terms of choosing the proper point, and when irrelevant areas were marked, a sensitivity value of 0% was obtained or an excellent result (92.35%) was obtained through ROC analysis. It can be concluded from the high predictive values applied that the system of semi automatic image processing is fast, reliable and risk-free and therefore could be of help to the physician.
Keywords
Stomach cancer, Region growing, Segmentation, Semi-automatic, Image processing, ROC Analysis, Confusion matrix
Introduction
Stomach cancer is among the most common cancer cases today. Stomach cancer ranks fourth as regards incidence (7.8 percent) and second as regards cancer-related deaths (9.7%) [1]. The early phase of the prognosis of stomach cancers is rather good but it is generally asymptomatic. Therefore, delays are frequent in the diagnosis and unfortunately nearly 65% of the patients are detected during a locally advanced or metastatic stage [2]. As in other types of cancer, this leads to bad results in prognostic terms and affects the chances of survival directly [3]. In a study carried out in Turkey, it was found that the age at which to receive a diagnosis for stomach cancer is 57 on average and the ratio of male to female was found to be 1/2 [4]. With the introduction of video endoscopes in the 1990s, a new era started in the endoscopic examinations. Endoscopes that are used today make it possible to obtain direct images and biopsy by penetrating into every point of the digestive system by means of their flexibility and their mobility. At the same time, they are tolerated by the patient pretty well [5].
Image processing techniques have come into widespread use in medical applications in recent years. One of the most important steps in image processing is the process of segmentation. Also in the study we conducted, the identification of stomach cancer could be achieved in a semi automatic way by using endoscopy images of the patients visiting the Gastroenterology Department in the Medical Faculty of Selcuk University. The area identified to be cancerous in a semi-automatic way and the areas detected to be cancerous by a specialist doctor were compared, and accuracy rates were calculated. Image processing methods were utilized to locate the cancerous area in a semi automatic way. The process of segmentation was carried out in a semi-automatic way as the methods of image processing.
The few existing popular segmentation techniques for medical image segmentation are: Thresholding, statistical methods, clustering, graph and region-based methods [6]. In our study, the method of Seed Based Region Growing (SBRG) was used in the process of segmentation. As a result of this segmentation process, the area that was located was compared with the cancerous area taken from specialist doctors by using the Delphi method and their analyses were extracted.
Material and Method
Material
Our study continued for a period of seven months in the Gastroenterology Department of the Medical Faculty of the Selcuk University, from June 2016 to February 2017. The patients included in the study were those diagnosed with stomach cancer and whose biopsy results were obtained. Endoscopy images of the patients were taken through Olympus Gif Q260 endoscopy device. The image processing was initiated after the images of patients were examined again by a specialist doctor.
Method
Because we took advantage of the help by a specialist doctor in the identification of the cancerous area, we thought that the Delphi method was appropriate for the finalization of this process. In order to obtain more accurate results from the study conducted, the more properly a specialist doctor can choose the cancerous area, the more accurate and successful the results to be obtained will be. For this reason, the specialist doctor continued to use the Delphi method in choosing the cancerous area until the most precise area was chosen. A number of segmentation methods were applied in the studies carried out on the Figure. However, our study focused on the region growing (RG) method because a response was obtained through this method. Endoscopy images on which semi automatic segmentation process was conducted helped to identify the cancerous area with the help of image processing. It was compared with SPRG which was used in the process of segmentation. Region Growing(RG) segmentation method not only considers spectral, shape, scale information, but also has the ability to cope with significant noise corruption, handle occlusions [7].
These methods are reviewed below in detail.
Delphi method: Taking its name from a place called Delphi, where a famous Greek oracle who prophesied about the future lived, this technique has been in widespread use in such scientific research as administration, medicine, military and in various fields of education [8]. The Delphi technique was developed in the 1950s by two researchers named Olaf Helmer and Norman DaIkey, who worked for the firm, RAND, in the United States especially for the purpose of making interpretations in military issues [9].
The main purpose of the Delphi Method is to reach a compromise on controversial issues on the basis of experts' opinions [10]. Upon the success of the Delphi method, computerized Delphi method software was developed. The purpose of this software is to accelerate the operational period of the Delphi method, to change the tours and predictions into questionable records and semi-automate or fully automate some stages of the managerial role. Also in our study, the computerized Delphi method was utilized for the identification of the cancerous area in the endoscopy image provided by the doctor. Opinions of experts in their respective fields play a great role in the Delphi method. The following steps were followed in our study.
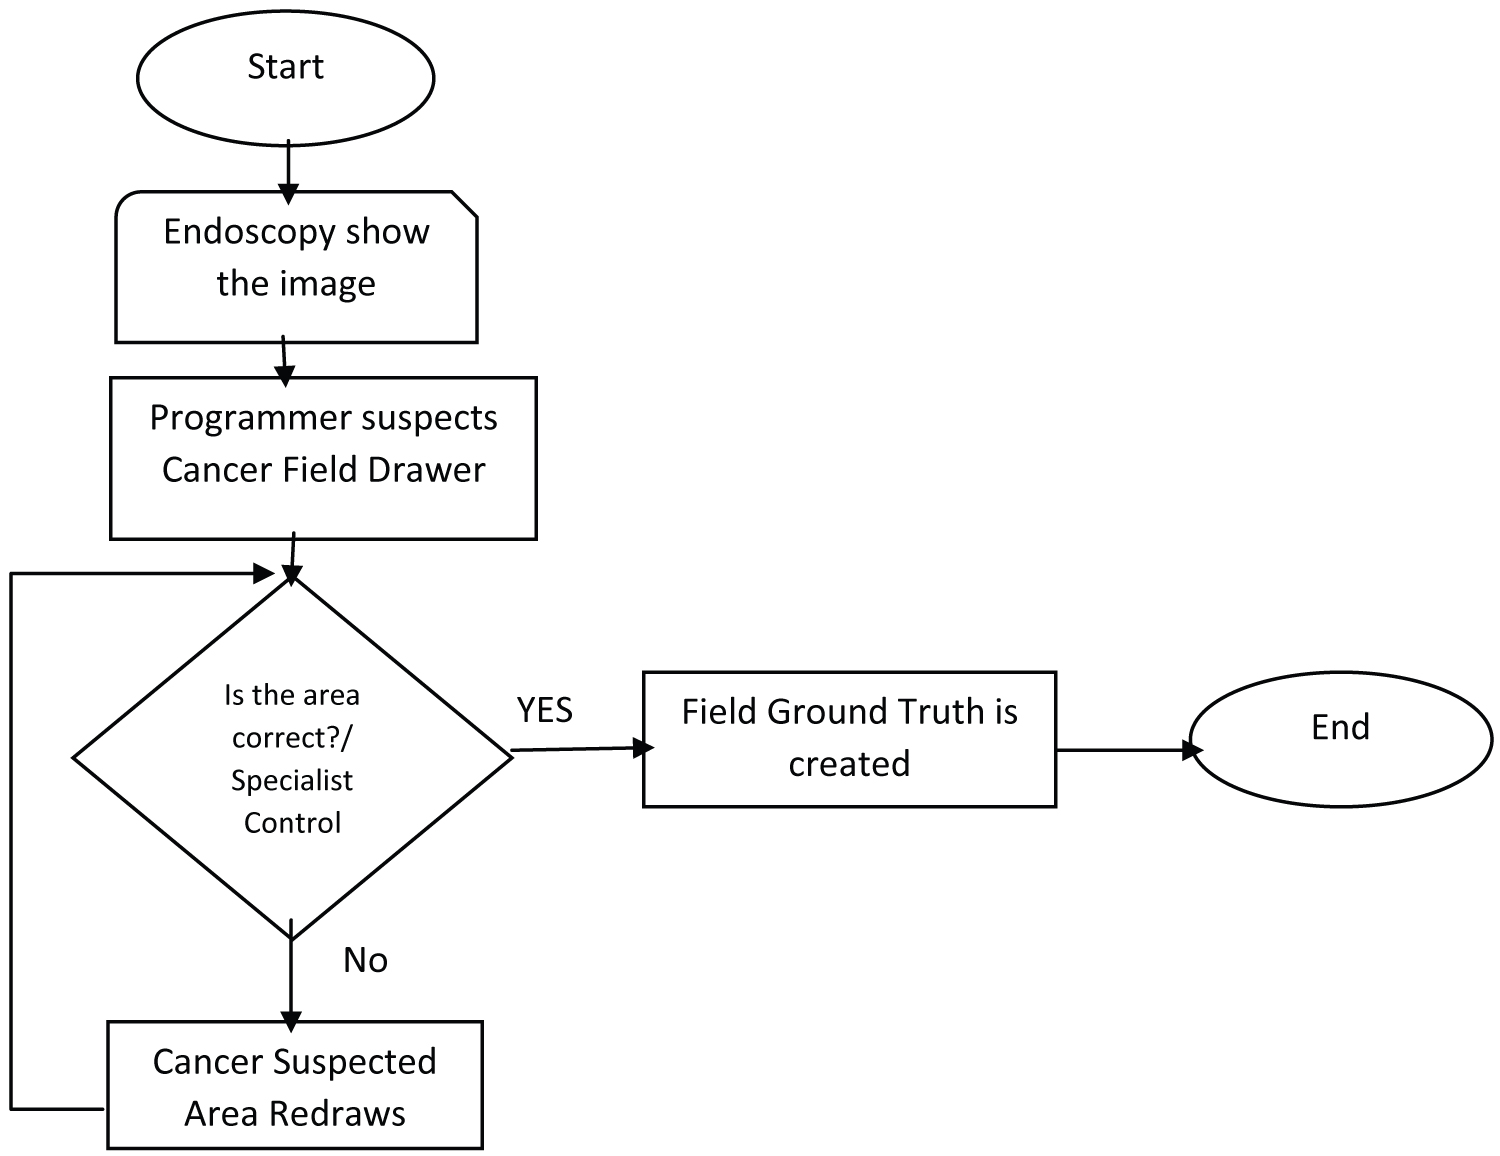
Process steps of Delphi methods:
1. Start.
2. Show the endoscopy image to the specialist doctor and ask the doctor to show the area he suspects.
3. A programmer is made to make a plot, and the area is shown to the doctor again.
4. The specialist doctor makes the required corrections if there is a missing or surplus area. The programmer plots area again and shows it to the doctor.
5. This procedure continues until the doctor gives his approval.
6. The end.
7. The flow chart of this process is shown in Figure 1.
Image processing: Image processing technology is used in several areas increasingly such as medical visualisation, industrial production, security systems, biometric identification, astronomy, military and satellite visualisation. Image processing techniques are used in several areas such as classification of apples, detecting faults on the produced fabrics, in olive harvesting machines, in the health sector, detection of cancerous cell etc. [11-14]. Today image processing has started to come up in many parts of our lives with the rapid improvement of digital technologies. In recent years, we have frequently seen image processing particularly in the field of medicine. Image processing techniques are used especially in the diagnosis of diseases and in better interpretation of images as well as in presenting the doctors with the proposals of the solution. The computerized diagnosis system in the field of medicine is composed of different stages. The first is the stage of pre-processing in which the image is improved; the second is the segmentation stage in which the symptoms of the diagnosis are segmented, and the third is the stage of perception based on the deductions of the symptoms. The segmentation stage is the most important stage of image processing. This stage also played a significant role in solving the problem in our study.
Segmentation: Image segmentation is a fundamental problem in computer vision, and numerous approaches for the efficient partitioning of images into several regions, or subsets, were derived [15]. After segmentation, the aim is to keep only the sections that are sought and to exclude the unnecessary parts from the image. The characteristics of a well-segmented image can be listed as follows [16]:
• Obtaining regular and homogeneous areas in an image segmented in a gray shade or in texture,
• The interiors of the areas should be simple and contain small pores,
• The areas close to each other but different from one another should have differing values concerning the regular characteristics,
• The boundaries of the areas should be simple, shouldn't display recesses and ledges, and the boundaries of the areas should be spatially in correct position.
Seed Based Region Growing Segmentation (SBRGS): The underlying idea for the region growing method is to find the pixel cluster which has similar properties so as to form a region. The steps taken can be listed as follows: First, we have to choose a pixel as a starting point for each of the required segmentation. At the second stage, we signed similar or identical properties of the pixel to the regions that have similar characteristics around seed pixel region. These new pixels serve as a new seed pixel to continue the above process until no more pixels that meet the condition can be included [17].
In the practical application of this method, we need to address three questions:
a) Choosing or determining one of the seed pixels which can correctly represent the required region;
b) Fixing the formula which can contain the adjacent pixels in the growth;
c) Making rules or conditions to stop the growth process.
The seed region growing algorithm proposed by Adams and Bisch of, Metmert and Jack way further described the dependency relationship between pixels in the seed growth:
a) The first order of dependence occurs when the number of pixels has the same difference ratio as their vicinity.
b) The second order of dependence occurs when a pixel has the same difference ratio as their vicinity [18].
The seeded region growing algorithm, or simply region growing algorithm, operates by grouping (i.e., growing) pixels or sub-regions into larger regions based on a predefined similarity criterion [19]. Some seed pixels are initially selected based on some criteria (e.g. color, intensity, or texture). Once the initial seeds are placed, the growth process seeks to obtain homogeneous image regions, i.e., it tries to find an accurate segmentation of the image in regions with the property that each connected component of a region contains exactly one of the initial seeds. The presence of noise may result in over-segmentation, which is typically handled with a subsequent region merging process. Two major concerns must be handled when performing segmentation based on region growing: Where to place the initial seeds in the image domain and which homogeneity criterion should be adopted to characterize the image regions [20].
RG segmentation method is a well-known spatial segmentation algorithm. In this algorithm, the segmentation process starts with starting seed points using predefined criteria. These seed points act as the existing starting points of different regions in the Figure obtained. When the region growing process starts, it starts at a certain region, and the pixels neighboring this seed point is tested and this seed is added to the region. In this way, each pixel in the image is assigned to a certain region in the divided Figure. Once the region growing is over, the connection of the region is carried out. Different parts of an image are connected into a single region on the basis of certain similarity criteria. Region growing technique is simple and the image pixels that have similar properties can be properly separated in order to form regions or objects that have similar properties [21]. The segmentation scheme in the region can be described in several steps [22]:
where Ri is the ith region in an image R, and the image is divided into n regions
i.e., two regions i and j are disjoint.
This is to say that any logical predicate P defined over two adjacent regions are false; i.e., two regions are dissimilar. Similarly, it is required that the region Ri is a connected region. It is observed in the literature that there are two main disadvantages of the region growing approach: It needs the selection of suitable seed points and minor intensity variation gives over-segmentation. It may be noted that here we have proposed a novel boundary preserving region growing technique to get rid off the above mentioned disadvantages [21].
Seed region growing (SRG) is an image segmentation method proposed by Adams and Bischof. This method is initiated with a set of "seed" points, attaching the adjacent pixels which have similar properties with the seed (such as the grayscale or the specific range of color) to every seed on the growth of the region [23].
The semi-automatic selection points are used to carry out the region growing process in the original image. At each stage, we start with a single selection point and in the proposed scheme, we assume that the region growing process is a binary segmentation process in order to divide the whole image into an object or into background classes. We used the traditional region growing process for this special mission, and we made some modifications to it [21]. At this stage, the process starts to check the four adjacent pixels coming from a certain point in the image and the criterion for the connection between them. We put the label for the selection point on an adjacent pixel if it meets the criterion for pixel connection. A higher threshold value may lead to the selection of a larger region which includes the whole image so as to check the connection because of poor visibility and low noise in medical images. In order to prevent this, the process is terminated if the difference between in class variance of the object and the background is below the predefined threshold value.
In summary, we can list the advantages and disadvantages of region growing as follows:
Its advantages:
1. Region growing methods can accurately separate the regions that have the properties we have defined.
2. We can obtain original images that have clear sides with a good rim segmenting method.
3. The concept is simple. We need only one seed point to represent the region we desire, and then we grow the region in this area.
4. We can determine the seed points and the criteria which we want to apply to the area.
Its disadvantages
1. It may take longer in time and process for us to calculate.
2. Gaps or over-segmentation may occur because of the change in the noise or intensity.
3. This method may not distinguish the shading of the real images.
The Application of semi-automatic region growing method
The algorithm is implemented in MATLAB R2015a and is operated on Intel(R)_Core(TM)_i7-3630QM_CPU_@_2.40GHz PC with 8 GB RAM and Windows10 operating system.
The GUI interface of our study is shown in Picture 1.
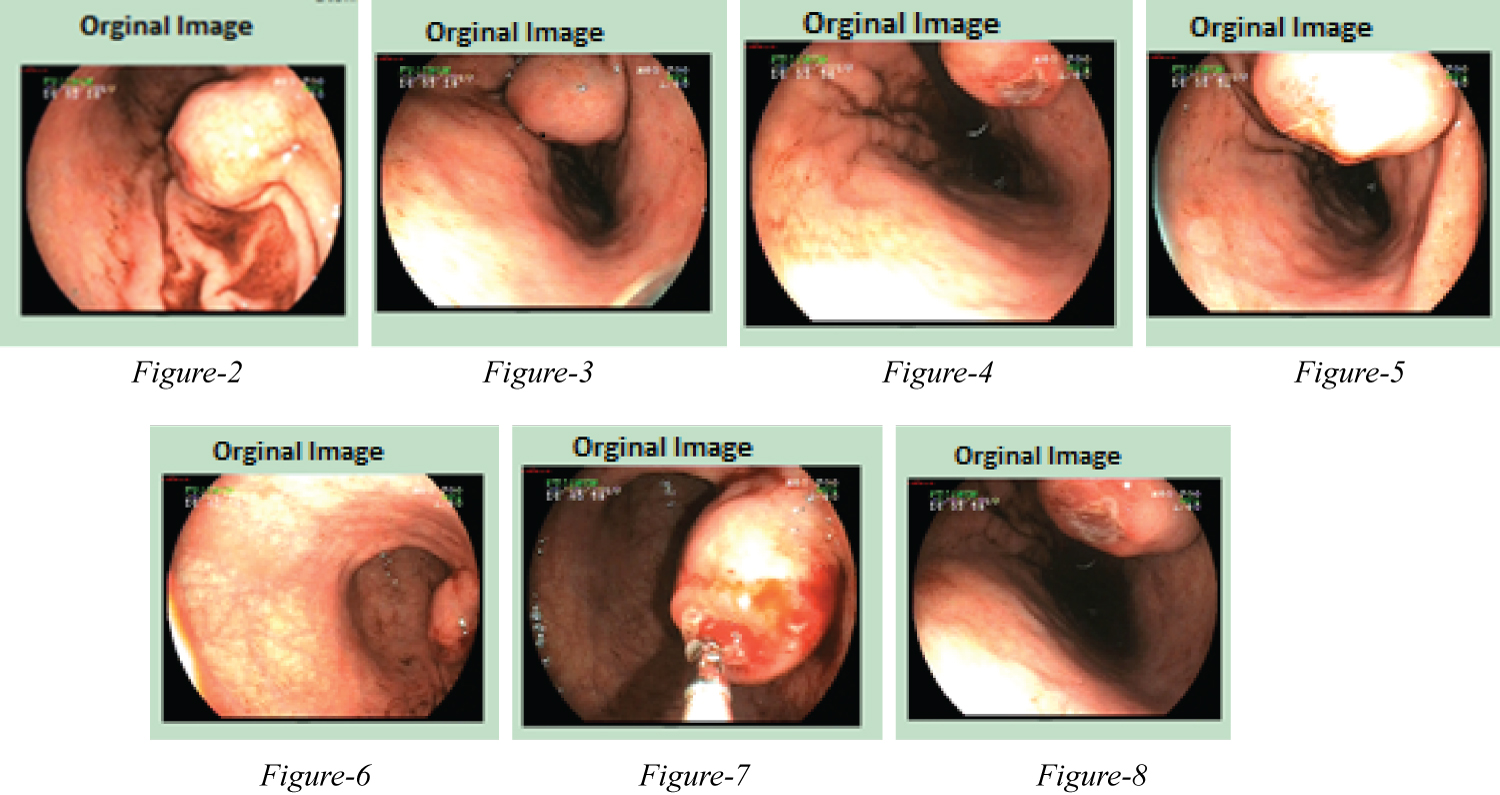
Primarily the Delphi method was used to identify the areas determined by a specialist doctor to be cancerous in the Figures obtained from the endoscopy images taken from different patients in the Gastroenterology Department of the Medical Faculty at Selcuk University, and thus the cancerous area was identified. Semi automatic region growing segmentation method which we designed was applied to seven Figures of our choice from different patients. The original Figures are presented in Figure 2, Figure 3, Figure 4, Figure 5, Figure 6, Figure 7 and Figure 8.
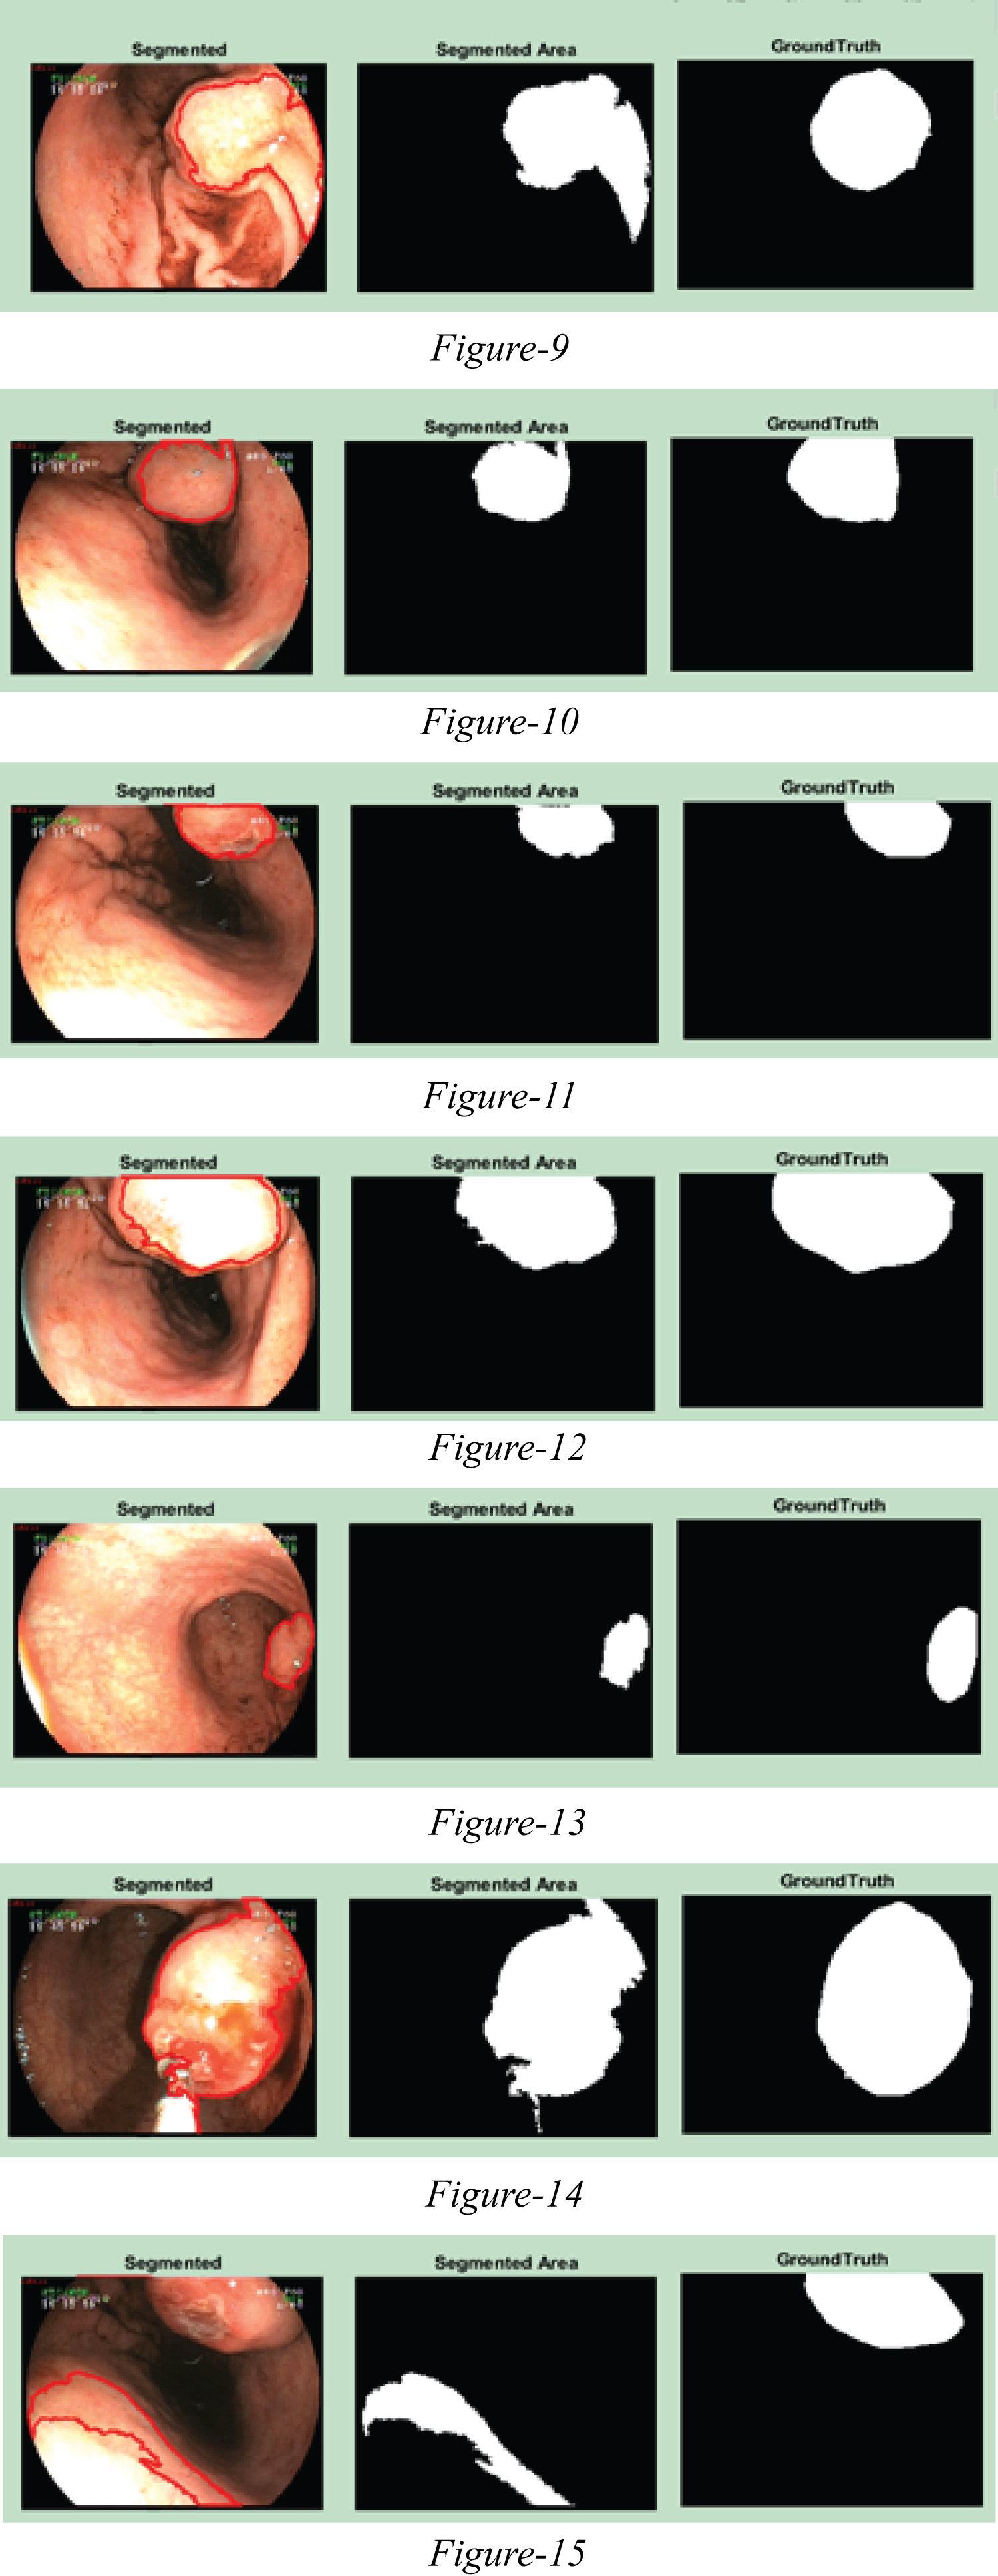
When the images given in Figure 2, Figure 3, Figure 4, Figure 5, Figure 6, Figure 7 and Figure 8 are examined by our system, Region Growing segmentation, segmented area and Ground-Truth values given in Figure 9, Figure 10, Figure 11, Figure 12, Figure 13, Figure 14 and Figure 15 become visible.
Results and Discussions
While 6 application samples out of 7 Figures generated results with the RG algorithm by choosing a smooth area, we tried to obtain a result, based on the RG algorithm, by choosing a random point in our application for the Figure 7. To assess the effectiveness of the proposed algorithm, the results obtained using the proposed methodology is compared with the area designated by the specialist doctor as the cancerous area. Confusion matrix and ROC analyses were performed in order to see the success of the study that was conducted.
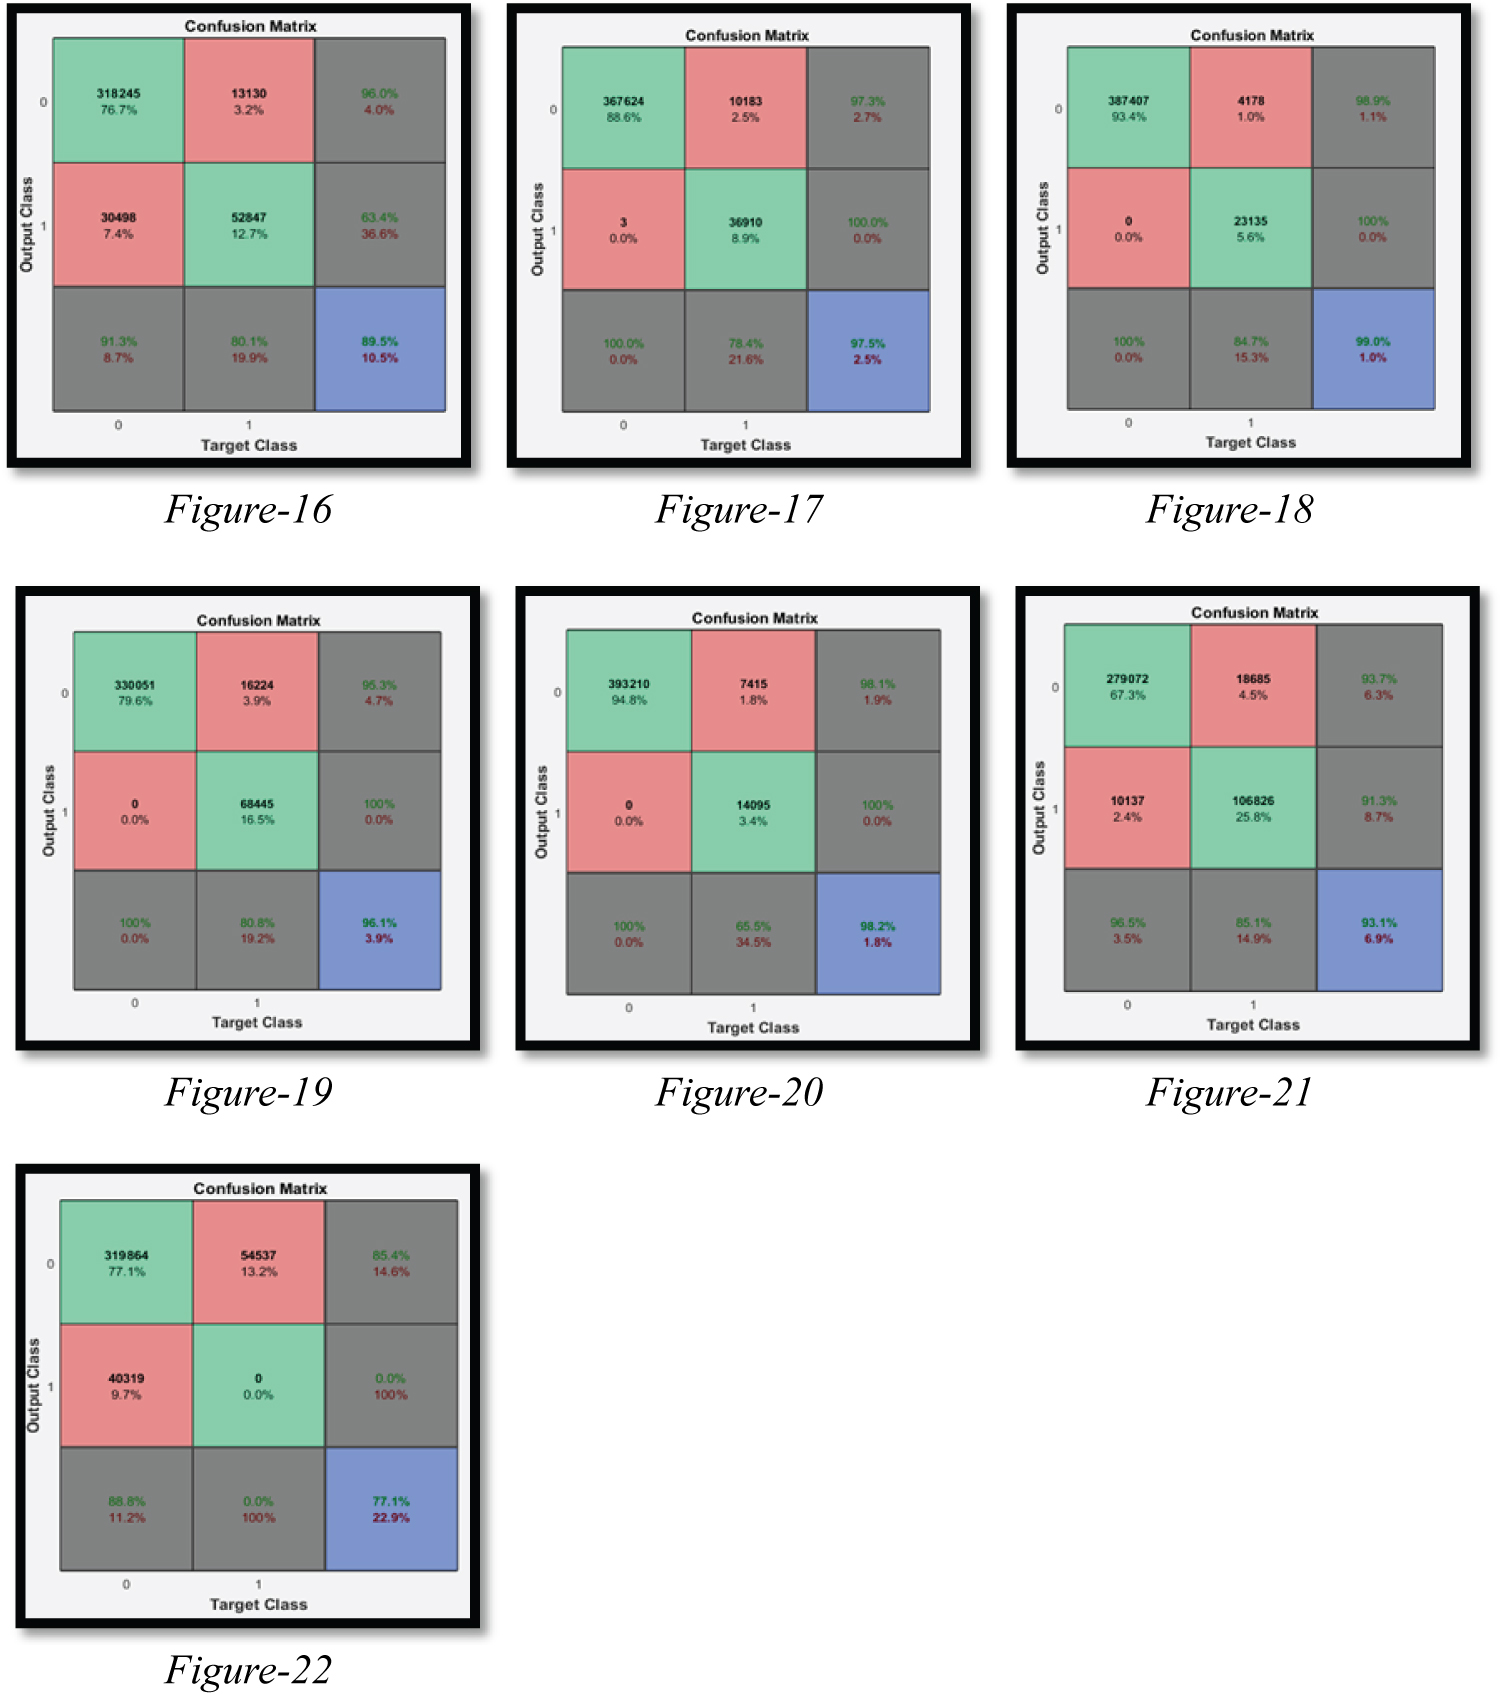
Confusion matrix
Confusion Matrix offers information regarding true and predicted classifications conducted by a classification system. The performance of such systems is generally assessed by using data on the matrix. The confusion matrix values of each image from Figure 2, Figure3, Figure 4, Figure 5, Figure 6, Figure 7 and Figure 8 belonging to each patient are given respectively in Figure 16, Figure 17, Figure 18, Figure 19, Figure 20, Figure 21 and Figure 22.
ROC analyses
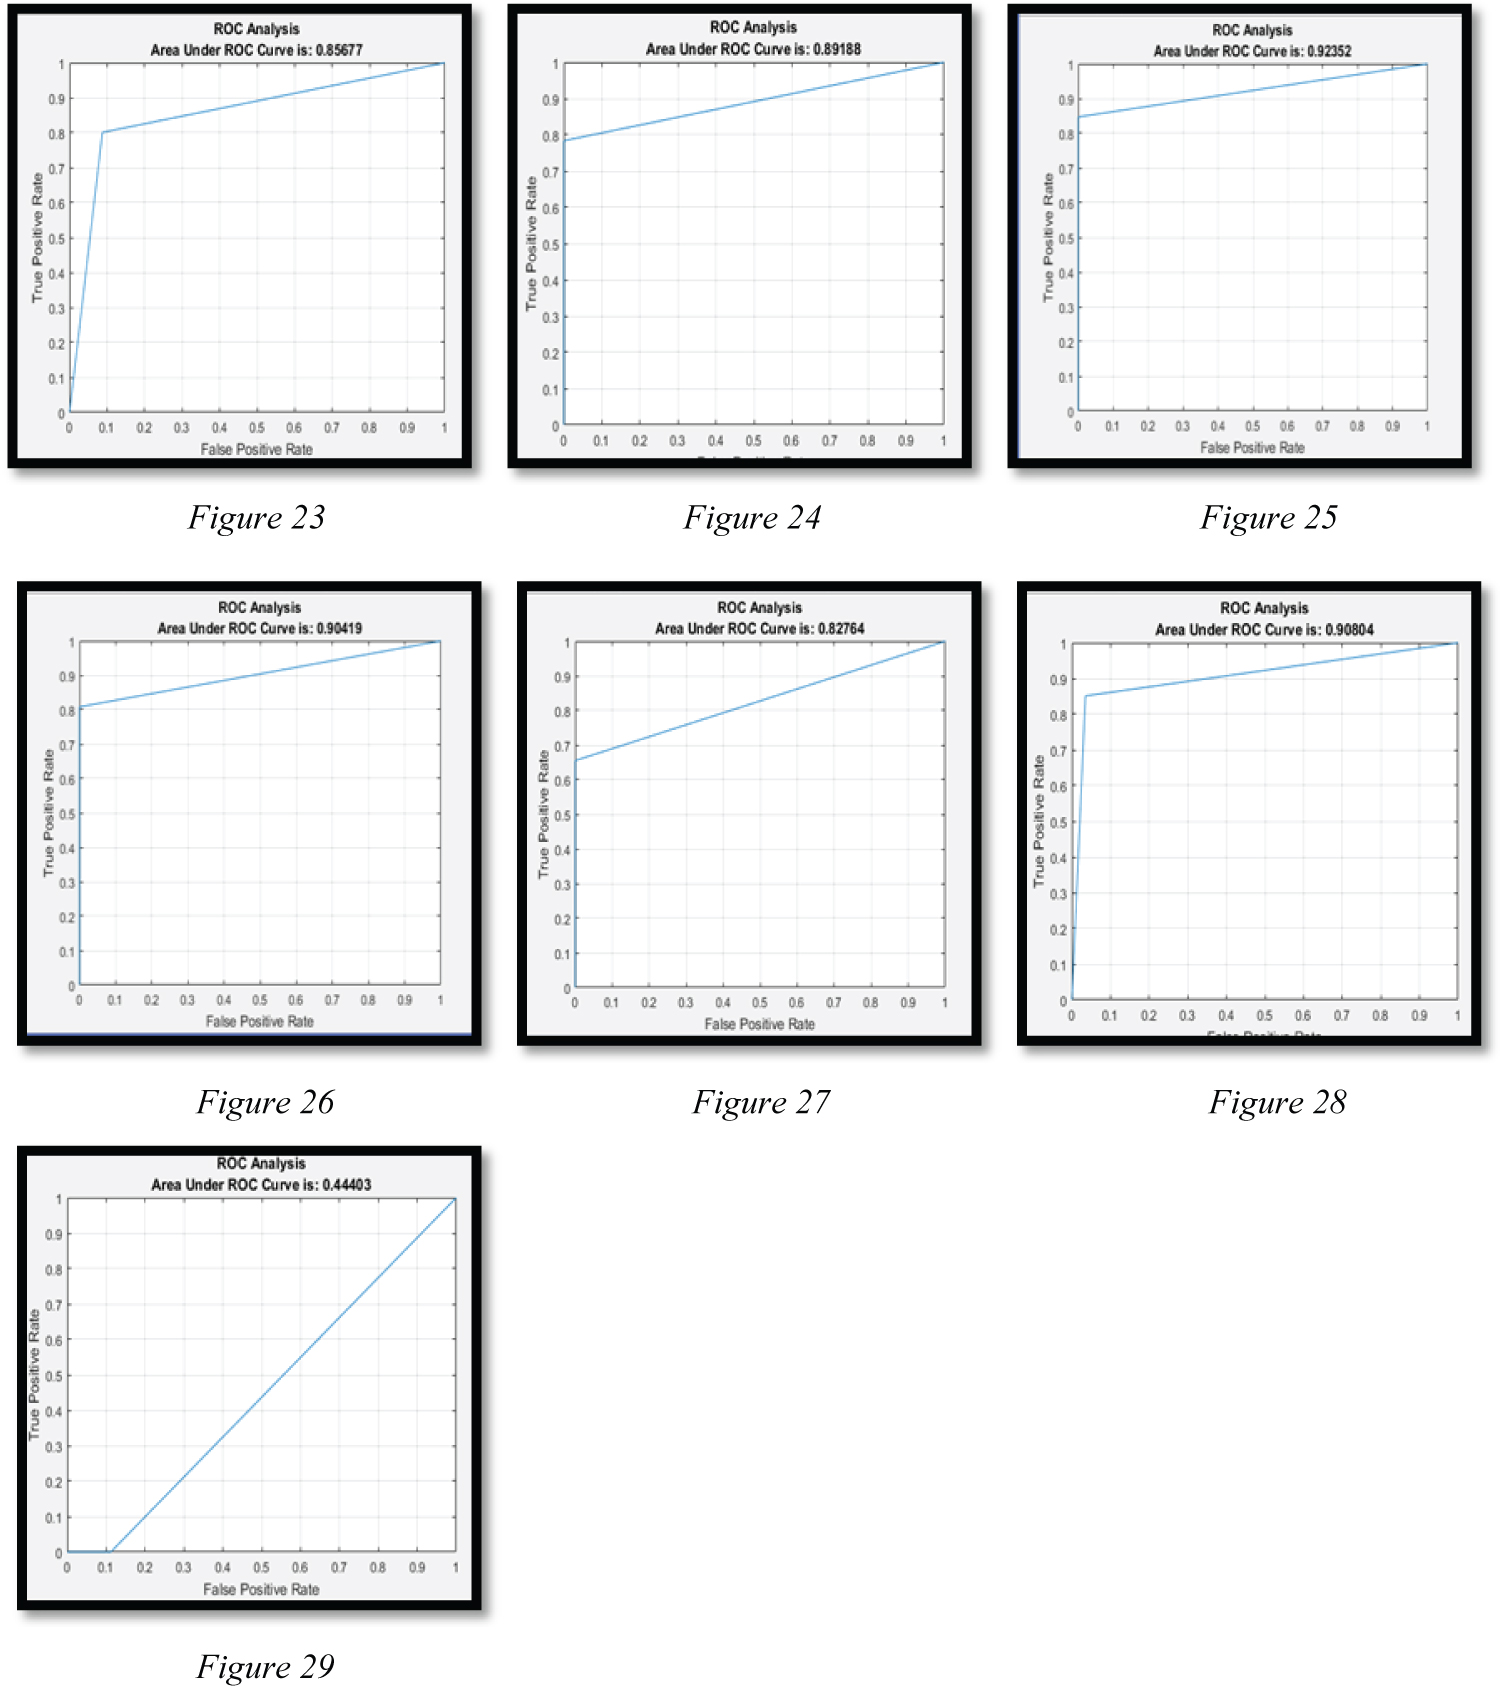
ROC curve is frequently used because it helps the diagnosis test to prove its accuracy and because it made possible to make a reliable comparison between tests. ROC curve is obtained by marking the sensitivity values which will be calculated after accepting all the values of a variable that it takes in the range of change as a point of section respectively against the false positive rate of the test. In the coordinate system that ROC curve will form, the positive value of the diagnosis test (sensitivity) takes its place on the Y-axis, whereas the false positive value takes its place on the X-axis.
ROC curve is drawn by connecting the points that correspond to true positive and false positive in each section point. In the literature, if ROC analysis values are 0.5 or below, it is considered a failure, while it is regarded as excellent if these values are 0.9 or above. ROC analysis values belonging to each image between Figure 2, Figure3, Figure 4, Figure 5, Figure 6, Figure 7 and Figure 8 from each patient are given respectively in Figure 23, Figure 24, Figure 25, Figure 26, Figure 27, Figure 28 and Figure 29.
Here Confusion Matrix and ROC analysis values belonging to each Figure are respectively given in Table 1.
In conclusion, the regional Ground-truth images specified by our algorithms are considered for evaluating the performance. The ground-truth images are prepared with the help of a specialist doctor.
In order to calculate these measures, pixel by pixel matching of the output is made with the ground-truth image. These measures are computed as follows:
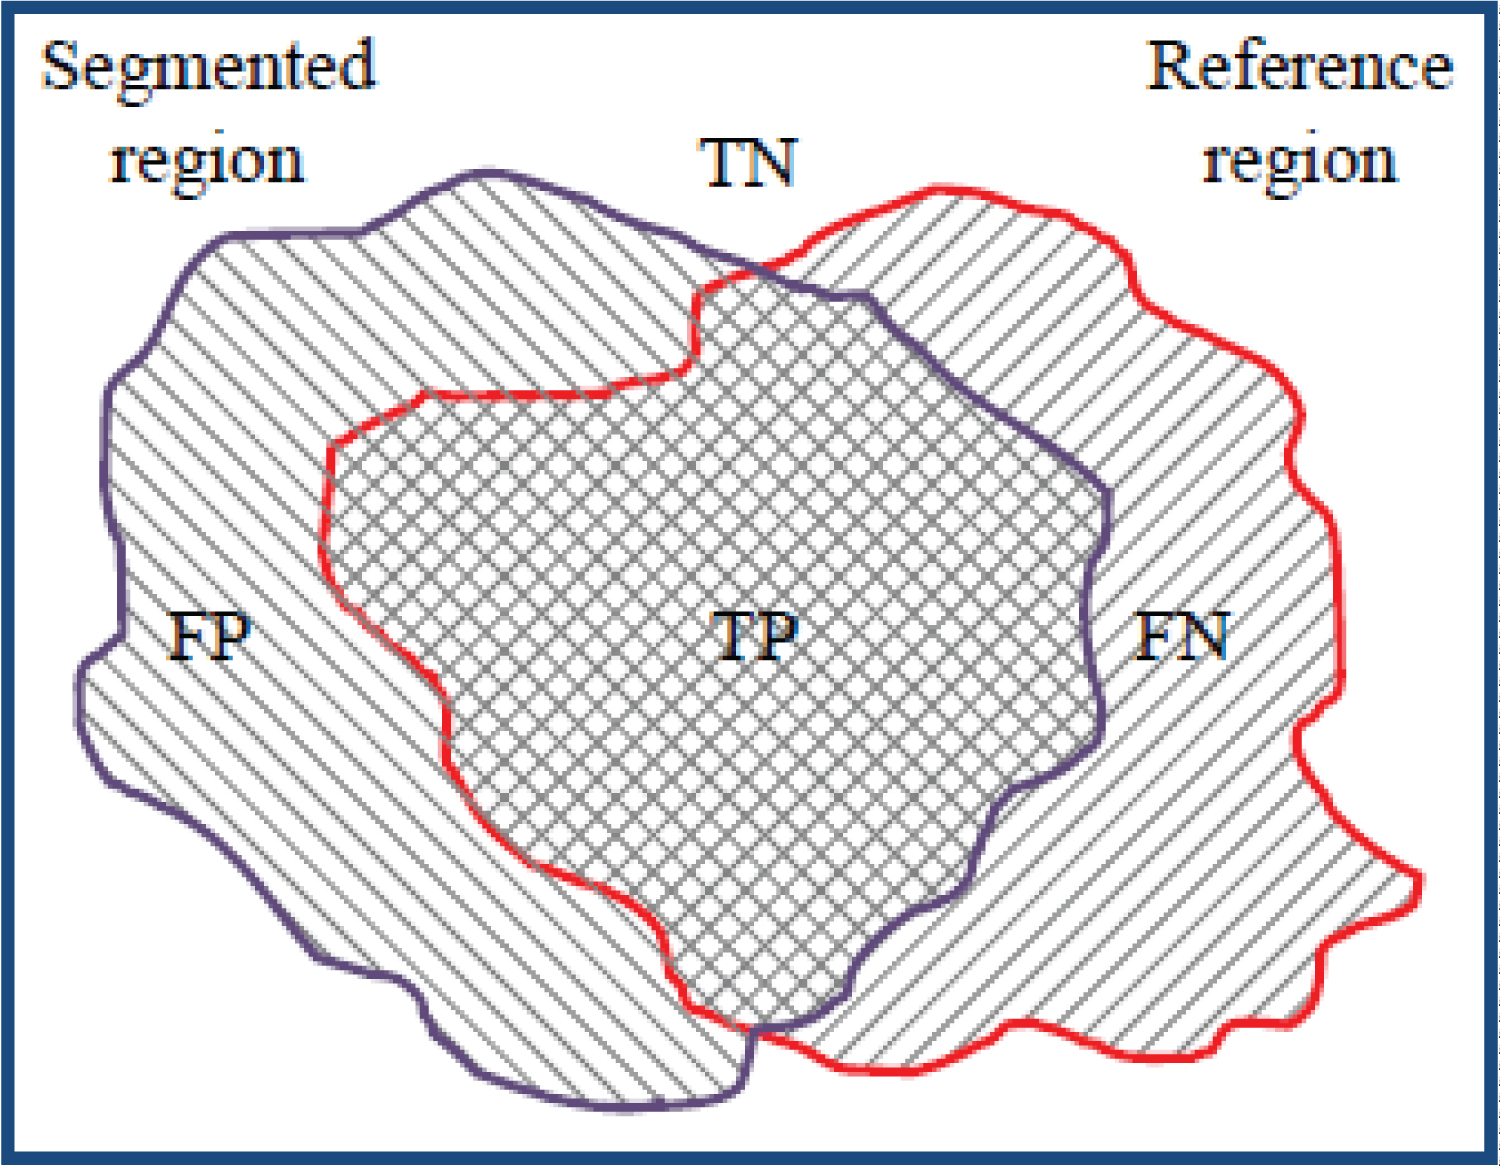
Here, true positive (TP) and true negative (TN) are the number of pixels correctly labeled as positive (object) class and negative (background) class, respectively. False positive (FP) is the number of pixels incorrectly labeled as an object class. Similarly, false negative (FN) is the number of pixels originally from object class but not labeled so. Accuracy gives the effectiveness of estimating the probability of true class label. Sensitivity and specificity assess the effectiveness of the algorithm for a particular class. Accuracy provides more weight on the common classes than on rare classes. Precision is the fraction of retrieved instances that are relevant, while recall is the fraction of relevant instances that are retrieved.
This Figure 30 shows TP, TN, FP and FN illustration; TP indicates positive pixels which have correctly been labeled positive; FP indicates incorrect negative pixels which have been labeled positive; FN indicates positive pixels which have incorrectly been labeled negative pixels and TN indicates negative pixels which have correctly been labeled negatively.
Accuracy, Sensitivity and Specificity are calculated as follows:
The values from the results of the application on 7 Figures obtained with the help of two equations given above are given in Table 1.
As can be understood from Table 1, when confusion matrix and ROC analysis curve results are examined, the devised system can yield results with higher accuracy when it is used by authorized people. This serves a useful function which could be employed in the diagnosis of stomach cancer in medicine.
Acknowlegements
This study was supported by Selcuk University Coordination Office of Scientific Research Projects (BAP).
References
- Parkin DM, Bray FI, Devesa SS (2001) Cancer burden in the year 2000. The global picture. Eur J Cancer 37: S4-S66.
- Crew KD, Neugut AI (2006) Epidemiology of gastric cancer. World J Gastroenterol 12: 354-362.
- Celayir M, Biricik FS, Bilici A (2015) The Effects of Initial Symptoms on the Prognosis in Patients with Stomach Cancer.
- Alacali M (2012) Gastric Cancer, Screening And Prevention Methods. Ank Med J 12: 195-198.
- Ferlengez E, Ferlengez AG, Steel A, et al. (2012) Endoscopic and Clinical Characteristics of Patients Diagnosed at the Gastroduodenoscopy Unit of a Secondary Level State Hospital Our Gastroduodenoscopy Results. Haseki Tip Bulletin 50: 131-135.
- Subudhi BN, Thangaraj V, Sankaralingam E, et al. (2016) Tumor or abnormality identification from magnetic resonance images using statistical region fusion based segmentation. Magn Reson Imaging 34: 1292-1304.
- Carvalho EA, Ushizima DM, Medeiros FNS, et al. (2010) SAR imagery segmentation by statistical region growing and hierarchical merging. Digital Signal Processing 20: 1365-1378.
- Woudenberg F (1991) An evaluation of delphi. Technol Forecast Soc Change 40: 131-150.
- Dalkey N, Helmer O (1962) An experimental application of the delphi method to the use of experts. The RAND Corporation, USA.
- Yüksel H, SEKER SE (2016) Türkiye'de organ ve doku bagisinin bilgisayarli argüman delfi yöntemiyle öngörülmesi. Uluslararasi Saglik Yönetimi ve Stratejileri Arastirma Dergisi 2: 12-24.
- Sofu MM, Er O, Kayacan MC, et al. (2013) Elmalarin Görüntü Isleme Yöntemi ile Siniflandirilmasi ve Leke Tespiti. Gida Teknolojileri Elektronik Dergisi 8: 12-25.
- Çelik HI, Dülger LC, Topalbekiroglu M (2012) Görüntü isleme teknikleri kullanarak kumas hatalarinin belirlenmesi. Tekstil Teknolojileri Elektronik Dergisi 6: 22-39.
- Kuncan M, Ertunç HM, Küçükyildiz G, et al. (2014) Görüntü isleme tabanli zeytin ayiklama makinesi. Otomatik Kontrol Ulusal Toplantisi 459-464.
- Sengür A, Türkoglu I, Ince C (2009) Endoskopik görüntülerin degerlendirilmesinde görüntü isleme temelli akilli bir karar destek sistemi. PAJES 15: 33-42.
- Heimowitz A, Keller Y (2016) Image segmentation via probabilistic graph matching. IEEE TRANS IMAGE PROCESS 25: 4743-4752.
- ÖZSEN O (2004) Mamogramlar üzerinde uygulanan görüntü isleme tekniklerinin incelenmesi.
- Tang J (2010) A color image segmentation algorithm based on region growing. 2010 2nd International Conference on Computer Engineering and Technology.
- Shapiro L, Stockman G (2000) Computer Vision 103: 2005-2024.
- Gonzalez RC (2009) Digital image processing. Pearson Education, India.
- Borges VRP, de Oliveira MCF, Silva TG, et al. (2016) Region Growing for Segmenting Green Microalgae Images. IEEE/ACM Transactions on Computational Biology and Bioinformatics 15: 257-270.
- Gonzalez RC, Woods RE (2014) Digital image processing. Pearson Education, Singapore.
- Subudhi BN, Thangaraj V, Sankaralingam E, et al. (2016) Tumor or abnormality identification from magnetic resonance images using statistical region fusion based segmentation. Magn Reson Imaging 34: 1292-1304.
- Lee AY, Wertz JA, Harris (2002) Operator isused to improve the exact position of point feature. 39: 153-155.
Corresponding Author
Ali YASAR, Computer Programming, Guneysinir Vocational School of Higher Education Selcuk University, Guneysinir, Konya, 42190, Turkey.
Copyright
© 2021 Ali Y, et al. This is an open-access article distributed under the terms of the Creative Commons Attribution License, which permits unrestricted use, distribution, and reproduction in any medium, provided the original author and source are credited.