Basics inside Techniques Regarding Quality in Anemometric Digital Data for Wind Energy Facility Designs
Abstract
The objective of the work is to consolidate and architect of quality analysis methods that can be used in a set of data, in order to apply them and make them as consistent and close to the real of the measured. The analysis is based on criteria and recommendations for obtaining data quality referenced in methodologies developed by WMO, NREL, BRSN. It is found that the presentation of three sets of data (raw, signaled and treated) is essential in any data series and characterizes an efficient means for practical use and verification of the understanding of the energy potential. It is also verified that besides having final data closer to the real, the data that went through a testing process, making them a more qualified level than those that did not have this verification.
It is concluded from the results of the analysis that for a quality data series, careful and detailed work is required, which goes through the criteria of data validation for the measurement location, boundary consistency analysis, surrounding historical series, comparison with estimated values and comparison between sensors, as well as following the analysis recommendations, aimed always to expand the knowledge Sustainable Energy Planning.
Keywords
Data quality analysis, Anemometric data, Digital data, Data set, Sustainable Energy Planning
Introduction
An essential factor for the development of projects in the use of energy potential is the knowledge of the availability of the energy resource. A great scientific effort has been developed in the last decade by several Brazilian research groups to reduce the barrier due to lack of scientifically reliable information on the energy potential available in the national territory [1].
Studies based on satellite data indicate the availability of primary energy for a region, but present uncertainties arising from the methodology adopted and the spatial resolution at which they were performed. Certainly, the most accurate estimate of the energy potential for a specific location is determined by the installation of accurate measurement instruments in the area of interest. Intermittent sources, which are those that cannot be supplied continuously due to uncontrollable factors, suffer from variations, but through consistent studies, potential can be prevented as much as possible.
Wissmann (2006) stresses that it is not enough just to measure, it is necessary to process, correct, generate, and ensure temporal and spatial consistency to the measured data in the most efficient way possible [2].
Data used for energy potential purposes needs to go through a rigorous quality control process since this data will later be used for energy forecasting.
The measurement aimed at calculating the wind energy potential is usually aggregated in a station or tower with specific instruments defined by international standards in order to generate data closer to the real one available in situ.
Taking into account the need for good data for energy potential analysis, this paper will look at the development of the process of quality analysis in anemometric data in the case study. Data that are the basis for an energy modeling of the wind renewable resource.
Concepts and definition
This paper shows the recommendations and methods for the analysis of data quality based on authors who bring details about data treatment always aiming to guide data closer to the real. Conceptualized institutes such as the WMO (World Meteorological Organization), BSRN (Baseline Surface Radiation Network) and NREL (National Renewable Energy Laboratory), will also be referenced herein to reinforce the foundation of the authors.
Data quality checking is a process to analyze data in order to qualify them as being suspect or not suspect. Data correction modifies observations that have been signaled as suspect so that they go through the quality control process after correction. Thus, the effects of good data quality analysis are to (i) ensure that the data are homogeneous, consistent, and continuous, and (ii) flag any abnormal data that need further investigation and eventual correction [3].
The main goal of controlling data quality is to identify erroneous or questionable records in the data and to prevent bad data from being used in analyses. A thorough evaluation of a quality system is of particular importance, as obvious errors sometimes remain in the data sets and interesting weather features are occasionally identified as errors [4].
The relevance of data for the knowledge of the behavior of a system is essential in the development of research, thus correlating the theory evidenced about the analyzed system with the real world, where the system is implemented and the singularities of this system, proposing to solidify the investigation, based on experiments and tests [5].
Knowing the type of data being analyzed is important as a first step in checking the quality of the data. This data can be found in many different forms and at different stages, depending on the source that made it available.
But before explaining data analysis, it is important to identify the types of data series most commonly used for energy potential analysis, and for this work, the objective is historical on-site data.
Historical data series: A historical data series is a set of data about a variable that shows the evolution of its value over time and is usually obtained on the spot.
Martim, Pereira (2011) point out that due to the large territorial extension in Brazil, the spatial distribution of stations does not present a good uniformity throughout the territory [1]. Moreover, the costs of maintenance and operation of large networks are high and often the stored data present high deviations from the actual values due to problems arising from the need for corrective maintenance not performed.
Such a compromise in the data directly affects the historical data series in such a way that they are found with several faults and data gaps. However, the use of a historical measurement is paramount to the overall knowledge of climatological variables, when measuring instruments are installed and used in deeper analysis of the measured, in order to observe the characteristics of a region. The measurement of historical series in situ brings a more realistic view of the measured, which can be compared with other forms of data generation such as satellite images.
Synthetic data series: A synthetic data series consists of a set of estimated data, using generators that, in turn, are mathematical simulation models that estimate the occurrence of variables and have, as their objective, the generation of a set of numerical values, called synthetic series, with the same statistical characteristics as the historical series.
Synthetic data generation is a statistical disclosure control technique that is applicable to a data set and aims to generate data from the original data using models that reproduce as faithfully as possible the structure of the original data, namely the characteristics of each variable and the relationships that exist among the variables [6].
The better the variables and the relationships they establish among themselves are represented, the better the model used to generate the data and consequently the better the information that will be generated. The data generated should translate the information as close as possible to the original information, that is, the creation of synthetic data should be guided by the goal of minimizing the loss of information while ensuring respect for the confidentiality of the respondents [6].
Satellite data series: Satellite data are data calculated by various sensors installed in satellites, which are converted by algorithms into variables such as wind speed, solar radiation, etc. Despite the high initial costs of a remote sensor, the possibility of obtaining information with good spatial and temporal coverage makes remote sensing a viable alternative, adequate to the reality of extensive regions with difficult access.
Meneses and Almeida (2012) define remote sensing as a science that aims to develop the acquisition of images of the Earth's surface through the detection and quantitative measurement of the responses of the interactions of electromagnetic radiation with terrestrial materials [7]. Remote sensing applies concepts from statistics, wave propagation, computer science, and mathematics to the interpretation and mapping of features on the Earth's surface. The large volume of data intrinsic to satellite images, associated with the relative complexity of calculations, requires significant computational resources for the storage and processing of remote sensing information.
Objective
The objective of this work is to examine the methods of quality analysis employed in data sets, comparing them with a compilation of international and national recommendations, and to apply them to a set of data collected in situ, in order to compare the treatment given. The aim is also to present a way of determining the availability of wind energy resources in a given region in a more coherent way, which can then be used to forecast energy resources.
State of the Art
As an intrinsic part of the work, the state of the art will bring the main information, recommendations and indications to obtain reliable data for any form of data analysis.
Factors affecting data quality according to WMO
To obtain adequate quality data, appropriate measures must be taken in each of its phases, such as planning according to user needs, equipment selection and installation, operation, calibration, maintenance, and training activities.
Factors affecting data quality are cited in this section, and are done with reference to more comprehensive information available in the Guide to Meteorological Instruments and Methods of Observation (WMO-No. 8) and other WMO manuals and guides [8].
• The quality of a measurement system can be assessed by comparing the needs of the users with the system's ability to fulfill them.
• Translating the expressed needs into functional specifications and technical specifications is a very important and complex task, which requires a good knowledge of user requirements, meteorological measurement technology, observation methods, WMO regulations, and the relevant operational conditions and administrative-technical infrastructures.
• The instruments must be carefully selected considering the uncertainty, range and resolution required, the climatological and environmental conditions implied by the user's application, the working conditions and technical infrastructure available for training, installation and maintenance;
• Before installation, a guarantee is required that the instruments will meet the original specifications;
• Data compatibility problems can arise when instruments with different technical characteristics are used to take the same types of measurements;
• The structure of a weather station depends on the schedule of use and the site level of the weather phenomena to be observed;
• Proper selection of instruments is a necessary but not sufficient condition for obtaining good quality data. No measurement technique is perfect, and all instruments can produce various systematic and random errors;
• Quality data is not only a function of the quality of the instruments and their correct location and orientation, but also depends on the techniques and methods used to obtain these data and convert them into representative data;
• Errors can also be introduced through the conversion techniques or computational procedures applied to convert the sensor data;
• As real-time quality control procedures have their limitations and some errors can remain undetected, such as long-term sensor drift and data transmission errors, performance monitoring is required in meteorological analysis centers and through management networks;
• Instruments need regular inspection and calibration to provide reliable data. This requires the availability of adequate standards and facilities for calibration and testing;
• The quality of the data provided by an instrument is considerably affected by the quality of its maintenance, which in turn depends mainly on the ability of the maintenance personnel and the maintenance concept;
• Quality data also depends on the skills of the technical personnel in charge of testing, calibration and maintenance activities, and the observers making the data observations in real time;
• Quality assurance implies the availability of detailed information about the observation system itself, and in particular about all the changes that occur during the time it is in operation.
These are the main topics highlighted by WMO, and which are premises for good data quality.
Essential recommendations for data analysis
In this topic we will study and observe important recommendations for data analysis according to Feng et al (2004), Guide to Meteorological Instruments and Methods of Observation (WMO-No. 8) (2004) and according to the Electrical Energy Research Center - CEPEL (2014).
Feng et al. (2004) describes quality analysis as ensuring that by means of techniques it will be possible to identify erroneous or suspicious data resulting from sensors and observation sources. Some important points are noted by Feng et al. for quality analysis: [9].
• Checking extreme maximum and minimum daily values: this method compares daily values of several variables from individual stations with extreme values set by the user according to studies and indications.
• Internal consistency check: checking that identifies errors with a reasonably large daily value range and "uniform line" checking of data, finding data of the same value for at least seven consecutive days. Reek et al. (1992) [10] found that many of these errors are typographical and even unit difference errors. All identified erroneous data are signaled. For erroneous data detected by the "uniform line" check, all consecutive data are signaled as suspect values except the first value.
• Temporal abnormal check: the checks cited above have identified some obvious erroneous values in the data series, but may not detect abnormalities that have the following problems: (1) when data values are much larger (or smaller) than neighboring values, but are not larger than the threshold to be detected by the consistency check; (2) when the data creates a large step change from the previous daily value.
• Spatial abnormal check: This method detects abnormalities by comparing data from neighboring stations. Correlation coefficients are calculated for each month between daily data at one station and the ten nearest stations. The minimum correlation criterion for it to be significant is the 95% confidence level. Stations with high positive correlation are used to create their linear regression for the same variable between neighboring stations and the analyzed station.
• Missing data: in developed calculations of monthly values, missing data (or data gaps) can induce temporal and spatial errors [11]. It should be noted that the number of neighboring stations is not fixed in time, the number varies depending on the availability of station data for the year/month in question. Consequently, the regression models also change over time. Furthermore, neighboring stations may be optimal for a given calendar month, but not optimal for a different month.
These were the main points addressed by Feng et al (2004) that permeate data quality and enable us to have greater veracity in the data set.
Now the main recommendations for data analysis cited by the Electrical Energy Research Center (CEPEL), which has been working to improve the conception and supply of technological solutions aimed at the electrical sector, will be highlighted.
According to the Electrical Energy Research Center (CEPEL) [12], there are several procedures for evaluating raw data and the qualification of this data, such as:
• Whether the measured value is within the physical limits of the variable;
• Whether there is consistency between different sensors;
• If there is historical consistency;
• Comparison with model-estimated values.
These procedures are the ones recommended by CEPEL and can be improved with time and studies, to guarantee a higher quality to the data used.
Through these two references, we can elaborate a more coherent data analysis that guides a more detailed scope, thus generating data that is more coherent with the real value.
Data quality analysis
Given these procedures and the considerations made by Guide to Meteorological Instruments and Methods of Observation (WMO-No. 8) (2004), Feng et al. (2004) and CEPEL (2014), procedures were developed to verify the consistency of data based on several essential criteria, and always aiming at data quality [8,9,12].
Consistency between different sensors: After recognizing the measuring range of an instrument or sensor it is feasible to observe the consistency between two sensors to ascertain the veracity of the recorded value. This technique uses redundancy to prove the consistency of the measured data and can be called Sensor Fusion.
In order to increase the reliability and integrity of the sensed data, the use of more than one sensor is often performed. The process of combining data from multiple sensors of the same or different natures is called Sensor Fusion. Its main objective is to provide systems with data of higher quality, thus allowing the reduction of flaws in the decision-making process [13].
The advantages in using Sensor Fusion are numerous and Salustiano (2006) highlights the following: [13]
• Fault tolerance: even if one sensor fails, the data obtained by the other sensors that have not failed continue to provide similar data;
• Reliability: the measurement of a sensor is confirmed by the measurement of other sensors;
• Synergy: data from a single sensor may be insufficient or incomplete, but complementary sensors can be used to generate assumptions that would be impossible to make using only one sensing element;
• Reduction in ambiguity and uncertainty: the combination of data reduces ambiguity in the interpretation of the measured value, and scattered values within the set of measurements can be discarded given some adopted criterion;
• Expansion of spatial and temporal coverage: while some sensors perform the task of obtaining data from the environment, others can perform their internal data preparation tasks, cover other areas of the environment, or fill in reading time scales that would be impossible to fill in with the limitations of the sensors employed;
• Robustness against interference: The use of several sensors that operate in different bands of the energy spectrum allows the system to be more immune to specific interferences;
• Increased resolution: when multiple independent measurements of the same property are merged, the resolution of the resulting value is better than the resolution of the single sensor measurement;
• Cost: It may be less costly (in terms of processing time, computational resources) to use multiple sensors.
Physical limits of the variable according to the measuring instrument: Each measurement device has a recorded minimum and maximum limit. Through this information, it is possible to detect whether the equipment is operating properly or not. This is the first test of the consistency of the variable's physical limits .This measuring range is the limit set by the sensor so that any record outside this value certainly presents an error diagnosis, which can be originated from various sources such as lack of calibration, or incorrect offset and slope. The range of each sensor or equipment is provided in technical documents from the manufacturer by means of datasheets and/or manuals.
Table 1 and table 2 illustrate the measuring range of two sensors: an anemometer and a temperature and humidity sensor, where it is possible to see the limit specifications of each.
Consistency of physical limits: Consistency control of physical limits is in the detection of values that exceed a predetermined physical limit, values identified as abnormal can be excluded by the expert observer.
WMO (2004) [8] describes that the purpose of examining the consistency of the physical limits of a variable as being an act of checking whether instantaneous data values (one-minute average or sum) are within acceptable range limits. The limits of different meteorological parameters depend on the climatological conditions of the location and the type of station and instruments.
Physical limit of the variable according to standard normals: Another consistency that must be taken into consideration are the limit values according to the Climatological Normalsin Brazil - Period 1961-1990, developed by the National Institute of Meteorology (INMET). The climatological normals have average values calculated for a relatively long and uniform period, comprising at least three consecutive decades.
According to the World Meteorological Organization (WMO) itself, climatic data are often more useful when compared to standardized normal values, thus considered those obtained according to its own technical recommendations. Thus, the calculation and publication of Standardized Climatological Normals is of utmost importance [14].
This data is made available by INMET on the site, in the Climate section, where it is possible to obtain it according to the user's needs, and then a .xls file is generated.
The consistency of the limits of the variables in focus with the climatological normals already gives a good analysis of the reality and behavior of the variables, thus helping to make the data more reliable and as close to the real value as possible.
Physical limit of the variable according to local climatic conditions: The consistency of the physical limit of the variable must also be based on and evaluated according to the climatic conditions of the location, since altitude, atmospheric pressure, and the place where one is inside the planet earth, substantially modify the climatic conditions. Given this fact, a deeper analysis of the conditions of the analyzed location is indispensable. The use of data from stations in the vicinity and satellite data can be used to analyze this consistency.
The limits of each acceptable range should be set so that they include almost (but not absolutely) all the values expected for the site. Technicians can adjust these limits as they gain experience. In addition, the limits should be adjusted seasonally. For example, limits for air temperature and solar radiation should be lower in winter than in summer [15].
Consistency with historical series: Consistency with historical data series is one of the most significant observation phases because homogeneity and correlation tests can be applied to the data at hand. This historical series must comprise a sufficient period for observing the seasonality of the variables under study.
The central idea of this type of test is to determine how a set of data behaves when compared to a similar set obtained in another period. Historical consistency testing can be of three main types: bounds checking, successive or behavioral differences, and parameter relationship. This is done by setting limits obtained empirically or subjectively from the engineering experiences of the analyst [16].
This analysis is done in order to look for atypical behavior for the location of study. Normally, depending on the season, the locality or the variable, the hourly concentration values change without major upsets. If, when analyzing the data, sudden very high peaks are noticed, and with low values in the previous hour and also later, this value should be highlighted for a possible study of the reason that generated it.
Comparison with model-estimated values: Comparison between estimated models can also be used for data consistency analysis. The methods of estimating values for climatological data (solar radiation, wind speed, wind direction, air humidity, precipitation, temperature) change depending on the variable to be estimated.
These value estimation models can be method-based: (i) physical, (ii) traditional statistical and (iii) hybrid. The physical method uses equations to mathematically describe the physical processes that occur in the atmosphere, the physical models generally use global databases of meteorological measurements or atmospheric mesoscale models, and require computer systems to obtain more accurate results; the statistical method, in turn, works as part of the applied mathematics in order to find plausible results; and the hybrid method has the characteristic of mixing the methods in order to remedy the weaknesses found for estimating a value [17].
This comparison between models and measured data serves to analyze how close or not the data are to the models, in order to parameterize the phenomena and abnormalities detected in the data.
Presentation of acceptable range tests
Data validation and processing are essential processes for the quality and reliability of any data group and are part of quality analysis.
The climatological limits used in one of the validation tests at the installed site were established using the limits developed by NREL (National Renewable Energy Laboratory), BSRN (Baseline Surface Radiation Network) and WMO (World Meteorological Organization).
It can be seen that the tests of acceptable measurement intervals according to the WMO, in the document Guidelines on Quality Control Procedures for Data from Automatic Weather Stations of 2004, are more permissible than the tests of NREL, Wind Resource Assessment Handbook - Fundamentals for Conducting a Successful Monitoring Program, 1997, by putting to the test the climatic conditions in the area of influence where the sensors measuring the climatological variables are installed [16].
In this sense, this topic presents the indication of acceptable range tests for the measured variables within the context of the installation location of the measurement equipment, but this does not exclude the importance of performing other test routines as recommended by the bibliographic references on the subject.
According to NREL (1997) the tests presented in a reasonable range for the most expected average wind speed is 0 to 25 m/s [15]. However, the offset calibration provided in many calibrated anemometers will prevent zero values. Negative values indicate a problem. Speeds above 25 m/s are possible and should be verified with other information.
Table 3 represents the most commonly used validation tests for wind speed and wind direction, bringing in the range criteria for wind speed (horizontal and vertical) and wind direction. A reasonable range for the most expected average wind speed is 0 to 25 m/s. However, the offset calibration provided in many calibrated anemometers will prevent zero values. Negative values indicate a problem. Speeds above 25 m/s are possible and should be verified with other information [15].
The tests for air humidity and precipitation are based on recommendations from WMO (2004) [8]. However, the validation criteria for climate data are merged between WMO and NREL for a proper fit. Table 4 illustrates the standards adopted for temperature, humidity, precipitation, and atmospheric pressure.
Characteristics and Architecture for the Pilot Unit Case Study
The analysis is based on the verification and description of the procedures and methods used to assess the quality of the data from a pilot measurement unit: an anemometer station. The measurement unit is linked to the ANEEL Strategic Research and Development Project R&D-0061-0043/2014, entitled "Integration of Wind and Solar Photovoltaic Plants to Existing Hydropower Plants: An approach via Energy Complementation with the practical support of pilot plants with different technologies", developed in the city of Rosana- SP, and installed in the vicinity of the Hydroelectric Plant Engenheiro Sergio Motta [18].
Pilot unit anemometer station
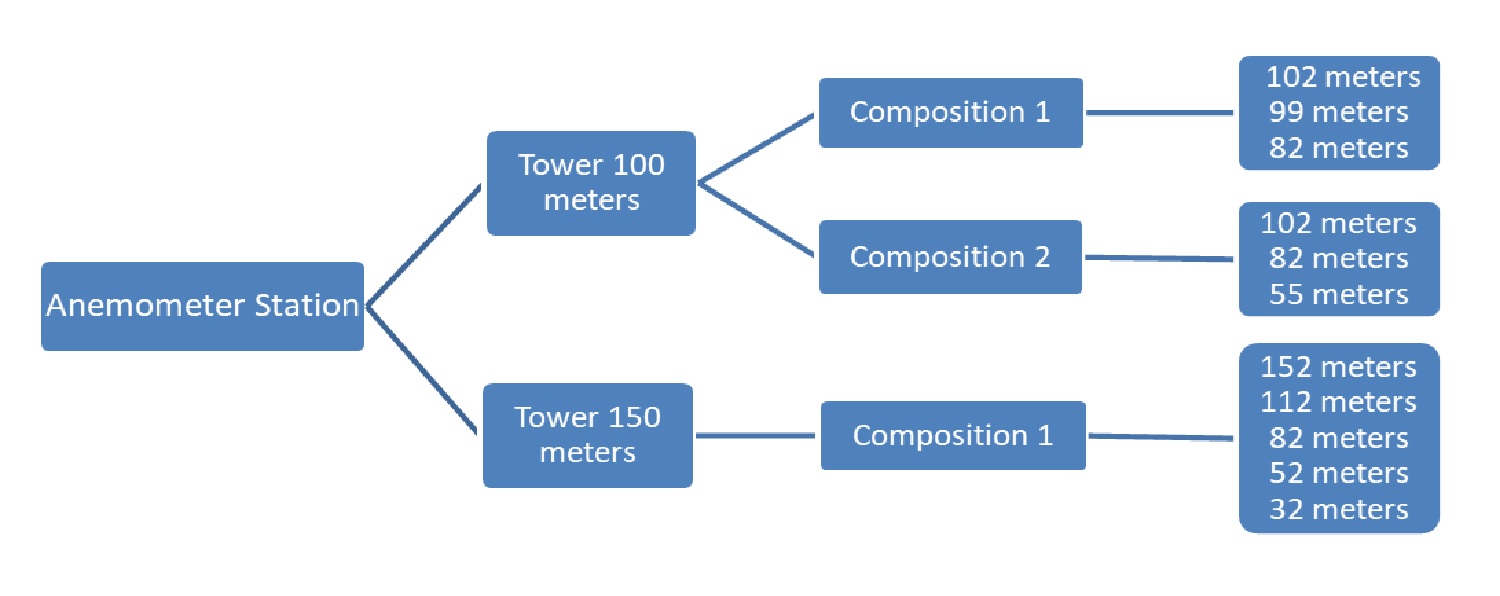
The anemometer station has been installed since December 16, 2014, in the vicinity of the Hydroelectric Plant Engenheiro Sergio Motta, located near the cities of Rosana and Primavera, state of São Paulo. Table 5 shows the information about the location of the tower installation. The station tower had two configurations of height and installation site, with a 100-meter and a 150-meter-high tower. The 100-meter tower had three anemometers and the 150-meter tower had five anemometers. Figure 1 shows the compositions and heights adopted by the two towers.
Composition 1 of the 100-meter tower had 3 anemometers installed according to the ANEEL standard (Table 6) , but for a better exploration and possible modeling of primary energy, the greater the vertical coverage, the better the observations of wind behavior. Given this observation was performed the exchange of heights of one of the sensors installed in Configuration 2, in which the sensor of 99 meters high became 52 meters (Table 7) [19].
As of December 17, 2016, the tower is modified in location and became 150 meters high, with 2 more anemometers, having a total of 5 anemometers (Table 8) [18].
Slope and Offset are calibration adjustment parameters of the raw data (Hetz, Volts) in which the data is parameterized to indicate the difference from a reference value. Slope and Offset errors can compromise the validity of the data and even make its use unfeasible. A check in the sensor manuals is recommended to verify that the values covered are correct. Table 8, illustrates the installation heights of the equipment and the five anemometers on the 150-meter-high tower.
Analysis and Description of Data Quality Checking Procedures
This topic will describe how the process of quality analysis of the data collected from the anemometer station, called anemometer data, was developed.
Raw data
The anemometric data was delivered to users via email and link via cloud hosting (Dropbox), but without remote access to the data. The raw data does not have a defined frequency of collection time (days, month).
As part of the raw data three files are generated by the equipment:
• A txt file, which has: Decoding Information, Download Information, Sensor Configuration and Errors, Sensor Information Diagnosis.
• A log file, with encrypted information.
• A file in wnd, an extension that loads the data generated by the sensors. This file can be opened by the EOLCharting® software, or through it generate a copy file with extension txt, which can be manipulated by software and will load the same records.
The data is measured minute by minute and integrated every ten minutes.
The logs for each piece of equipment in the 100-meter-high tower have:
• Anemometer sensors - average, minimum, maximum and standard deviation. For two anemometers the TI30 (turbulence index).
• Climate sensors - mean, minimum, maximum and standard deviation.
The logs from the 150-meter-high tower have:
• Anemometer sensors - average, minimum, maximum and standard deviation. For two TI30 anemometers (turbulence index).
• Climate sensors - average.
Calibrated Data
The anemometric data went through a Slope and Offset calibration process, a process in which the raw data in Volts and Hertz are arranged in a mathematical formula that corrects possible errors, coming after passing through the data logger for conversion into the measurement units.
The calibrated data were divided into three groups:
• Group 1. Anemometers at 102, 99 and 82 meters high;
• Group 2. Anemometers at 102, 82 and 55 meters high;
• Group 3. Anemometers at 152, 112, 82, 52 and 32 meters high.
These files have the extension xlsx.
Treated Data
The tests for acceptable ranges used in the anemometric data were based on appropriate criteria according to the company performing the data processing. The validation criteria applied were: [20]
• Average wind speed (10 min): Speed values between 0 m/s and 50 m/s;
• Maximum wind speed (1 sec): Speed values between 0 m/s and 70 m/s;
• Atmospheric pressure: Values ranging from 800 hPa to 1060 hPa
• Temperature: Temperature ranges from -15°C to 50°C
• Air humidity: Humidity values ranging from 0% to 110%.
These files have the extension xlsx.
The validation criteria on the solar radiation variable are not defined in the reports.
Observation of Data and Anomalies
Several types of anomalies can be found in data logging, being subject to both external influences, such as broken cabling, damaged equipment, insects or birds on the sensors, lack of power supply; and internal influences, poor calibration, incorrect configuration, faulty sensor electronics, among others.
In the case under study, the station installed for monitoring and subsequent modeling of primary energy, a station with anemometric measurements has basic meteorological sensors (atmospheric pressure, air humidity, air temperature and rainfall level). During some months of data collection and study, abnormal variable values were noted for the measurement location, which should be reported or signaled [21]. Some of these anomalies were visible even after the acceptable range tests were applied.
Some sources of abnormalities are perceived simply by the observation of a user with technical knowledge of meteorological and anemometric variables; however, a concrete analysis is always necessary through a technical visit to check the installation site of the sensor and/or station. The graphs were generated with the aid of the EOL Charting Tool software, proprietary software for graphical wind analysis, and also through graphs in Excel.
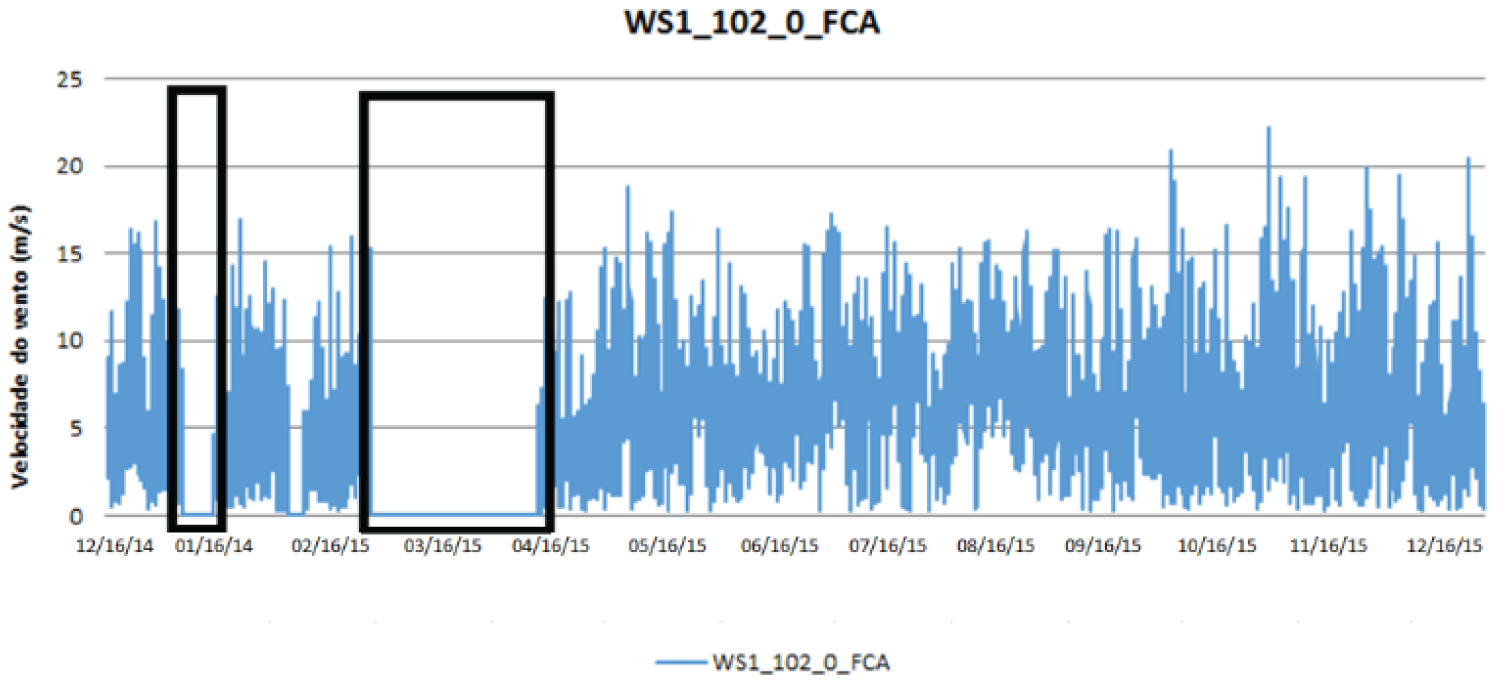
From 12/16/2014 to 12/16/2015 in the calibrated dataset there were gaps in the records due to missing data, as illustrated in figure 2. This lack affected all variables measured by the station.
For wind direction data according to Webmet.com entity validation criteria, it is physically correct to admit values between 0° and 360°, table 9 illustrates the directions in degrees and the coordinate of which it indicates. Their distribution changes depending on the measurement location, whereby each location has predominant directions [20].
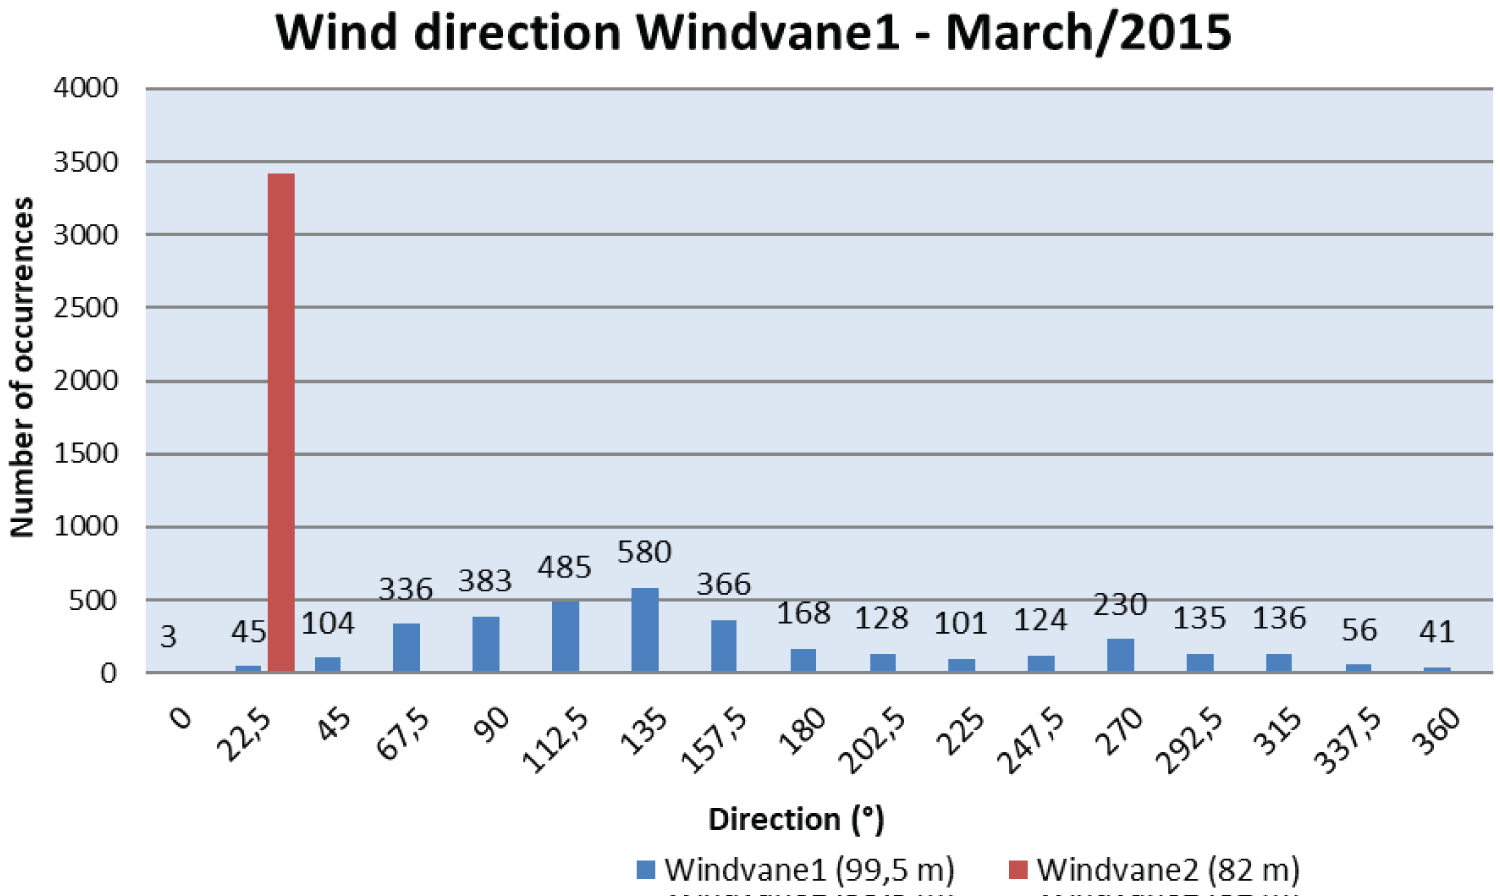
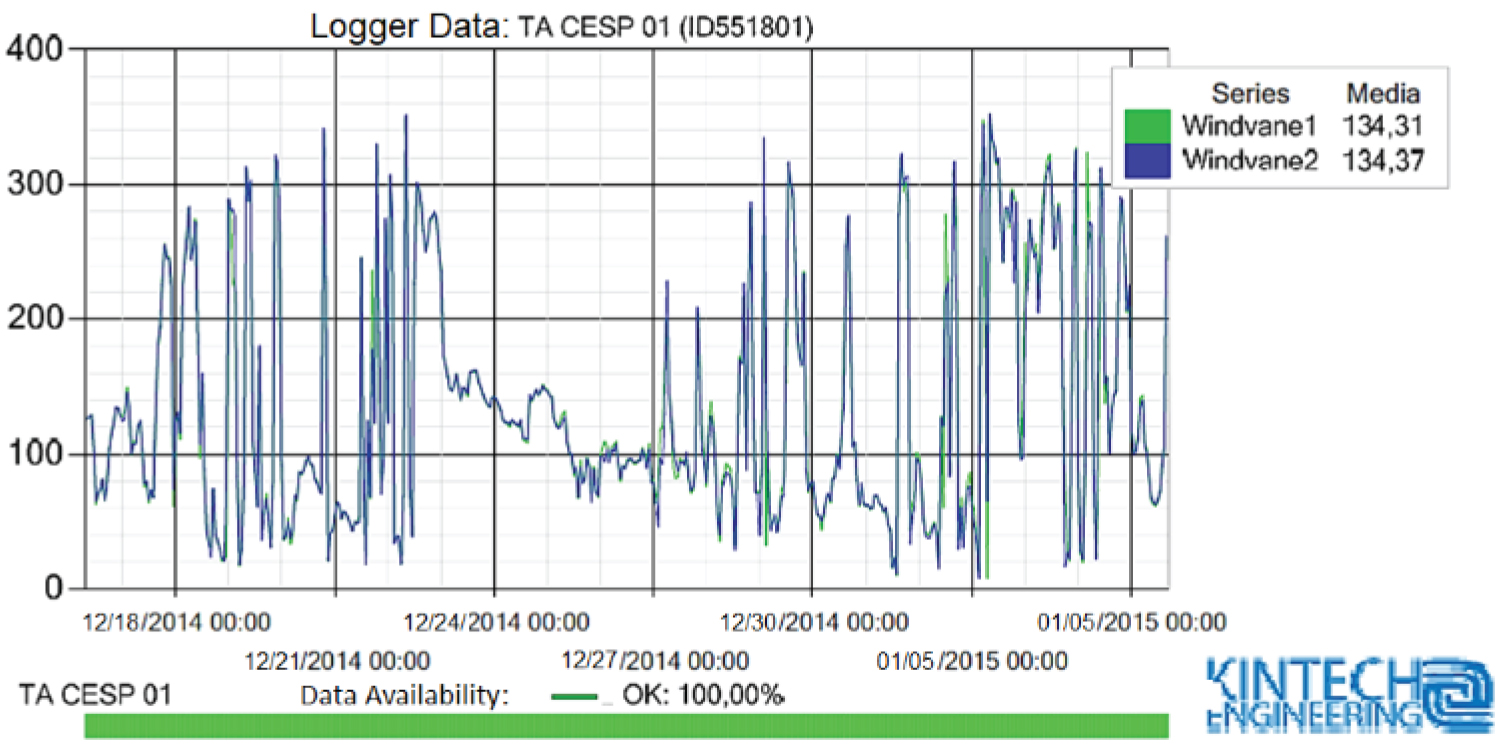
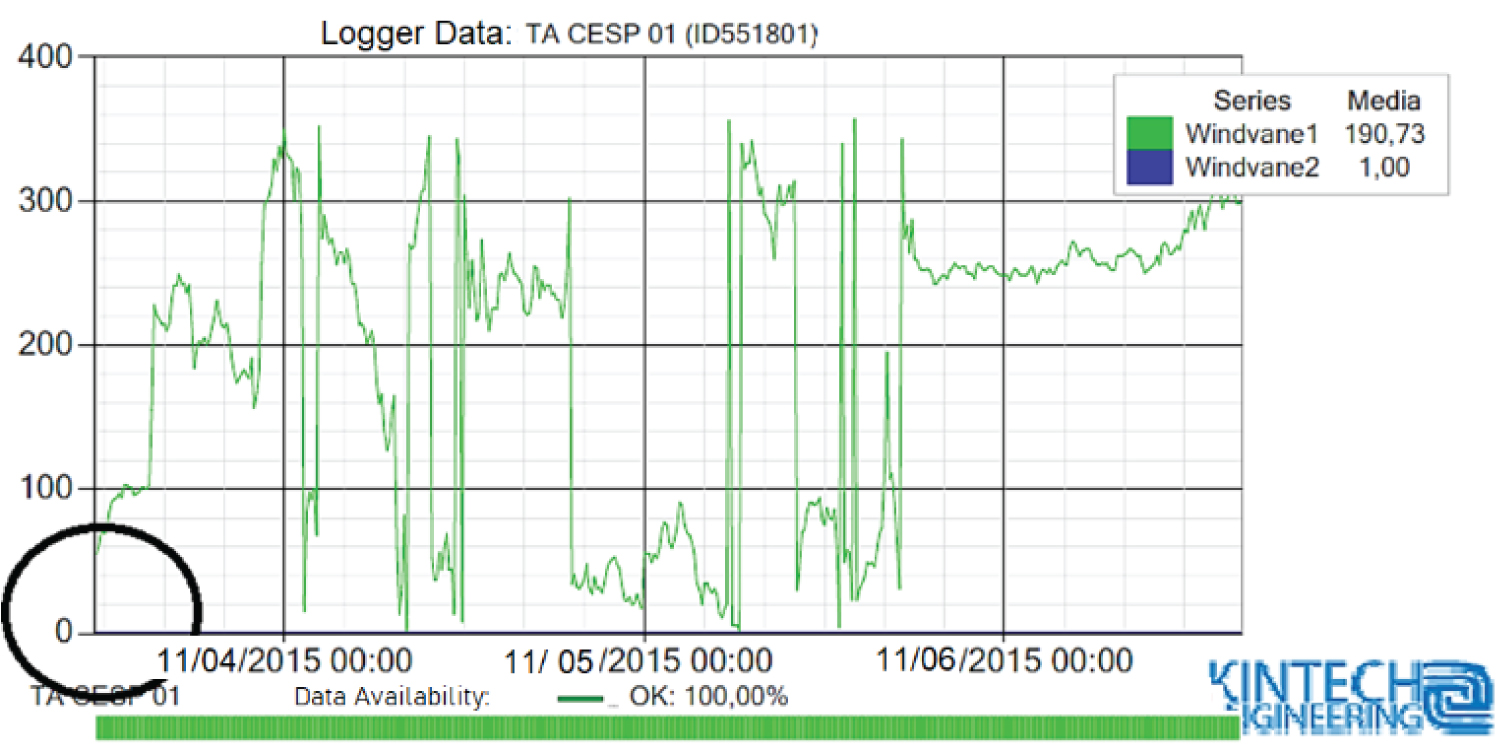
Figure 3 illustrates the predominance in the region of installation of the anemometric station in March/2015, where it is possible to notice an abnormality in one of the measurement sensors, the Windvane 2. Windvane 2 presents a characteristic in which all its data are identified in a single value. In Windvane 1 it is noted that the wind direction values are well distributed, with a greater predominance in some directions such as 112°, 135° and 157.5°. Figure 4 illustrates the normal average for the region.
The abnormality found can be noticed in figure 5 in which Windvane 2 presents a constancy value of 1. Usually, this value is registered when there is no measurement in a channel that has already been detected as input and output to the data logger. Any type of very persistent constancy should be checked by the observer.
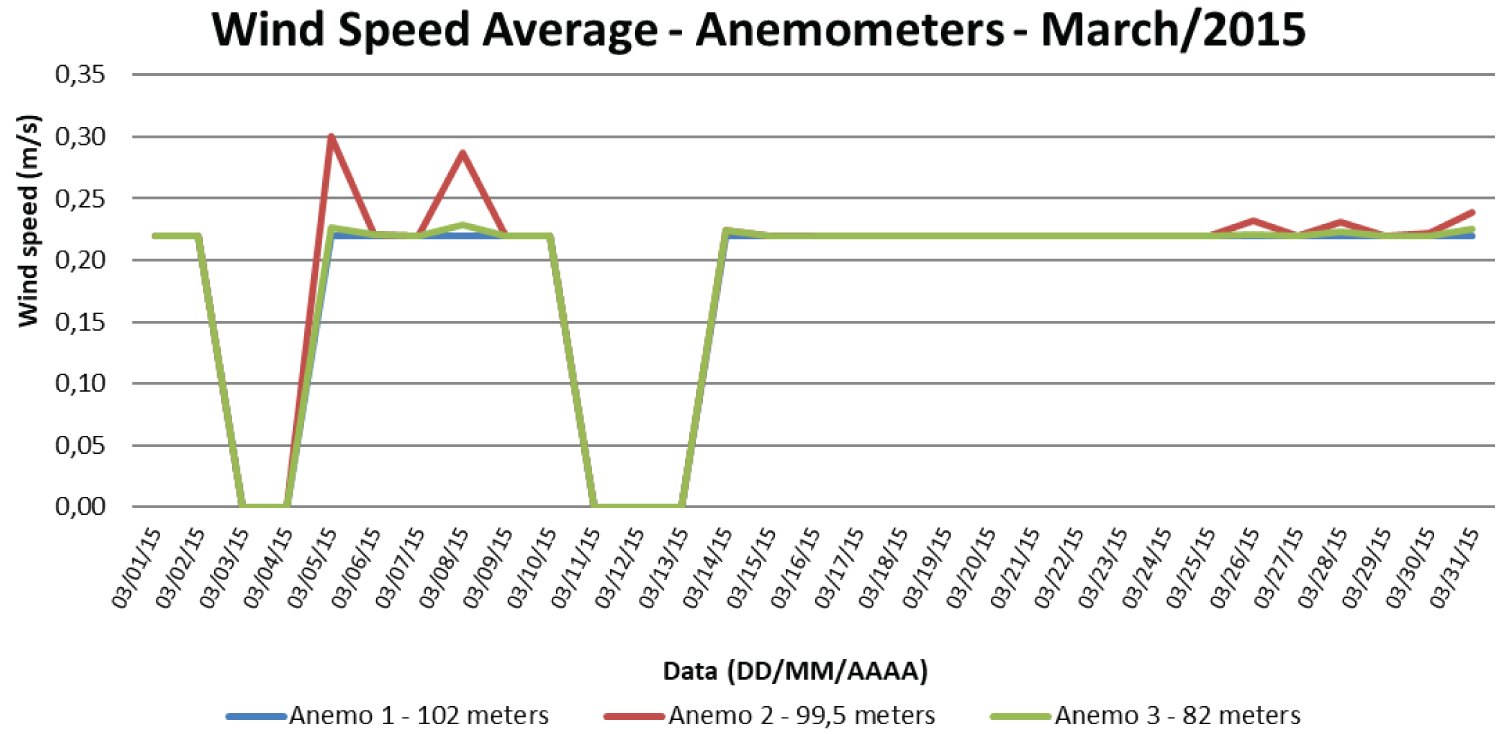
Wind speed is a variable that has an intermittent characteristic, not constant. And in figure 6 the graph reveals inconsistent values and with little variation during the days of measurements in all anemometers installed. These types of errors are quite easy to identify, due to the persistence in the type of error, and the very low values of wind speed measurements.
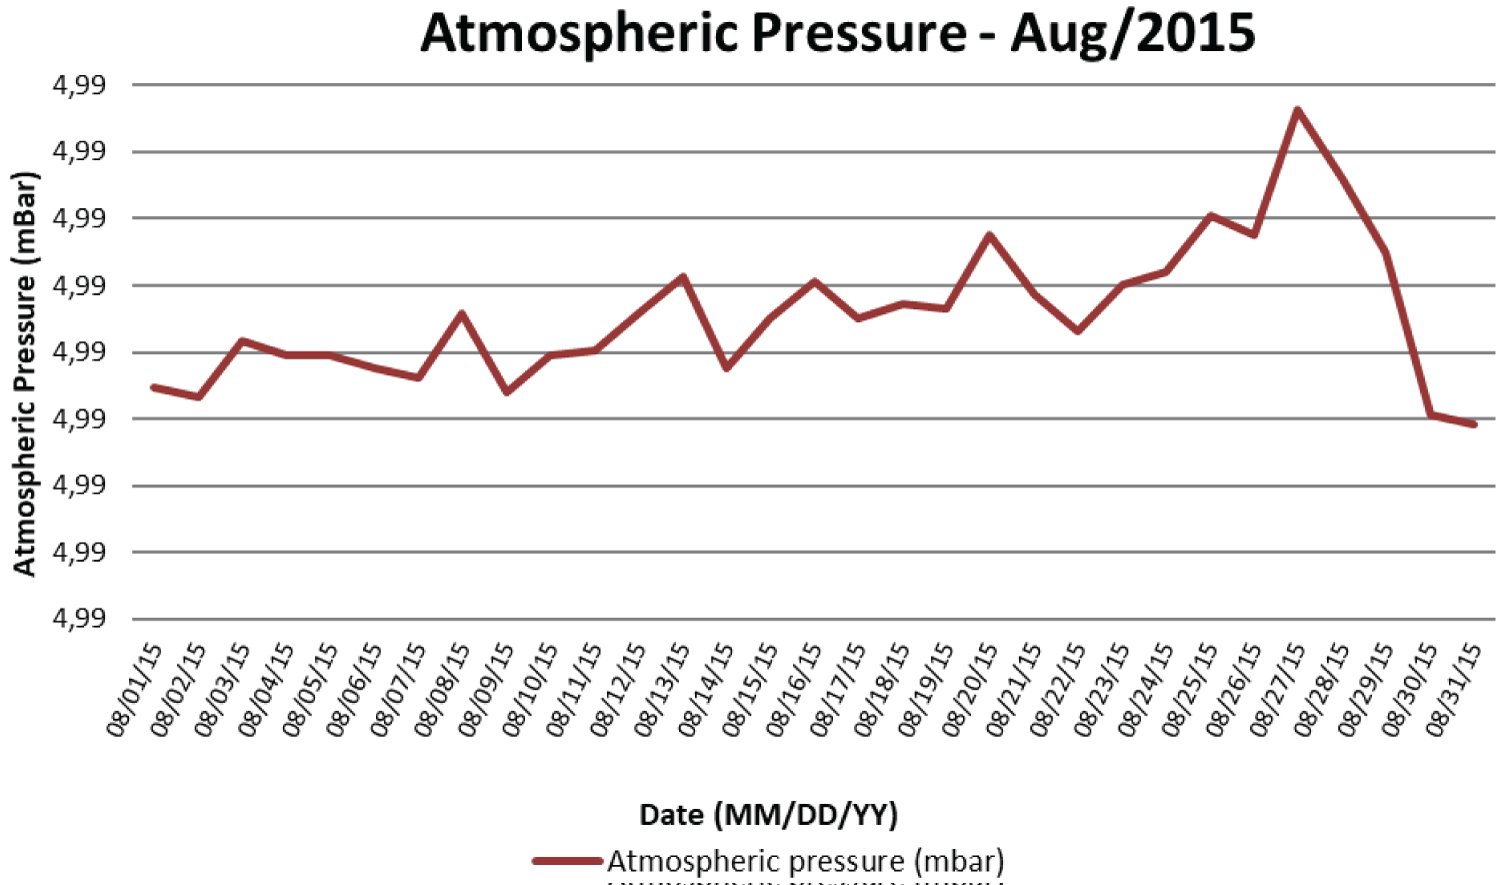
The measurement of atmospheric pressure presents peculiar variations in different regions of the planet Earth, as do many other climatic measurements. The atmospheric pressure is directly influenced by the altitude and temperature of the place being measured. This variable has a characteristic of its own, in which it suffers variations in its measured records, but does not undergo large variations, as it is influenced by variables that do not undergo abrupt changes such as altitude and air temperature.
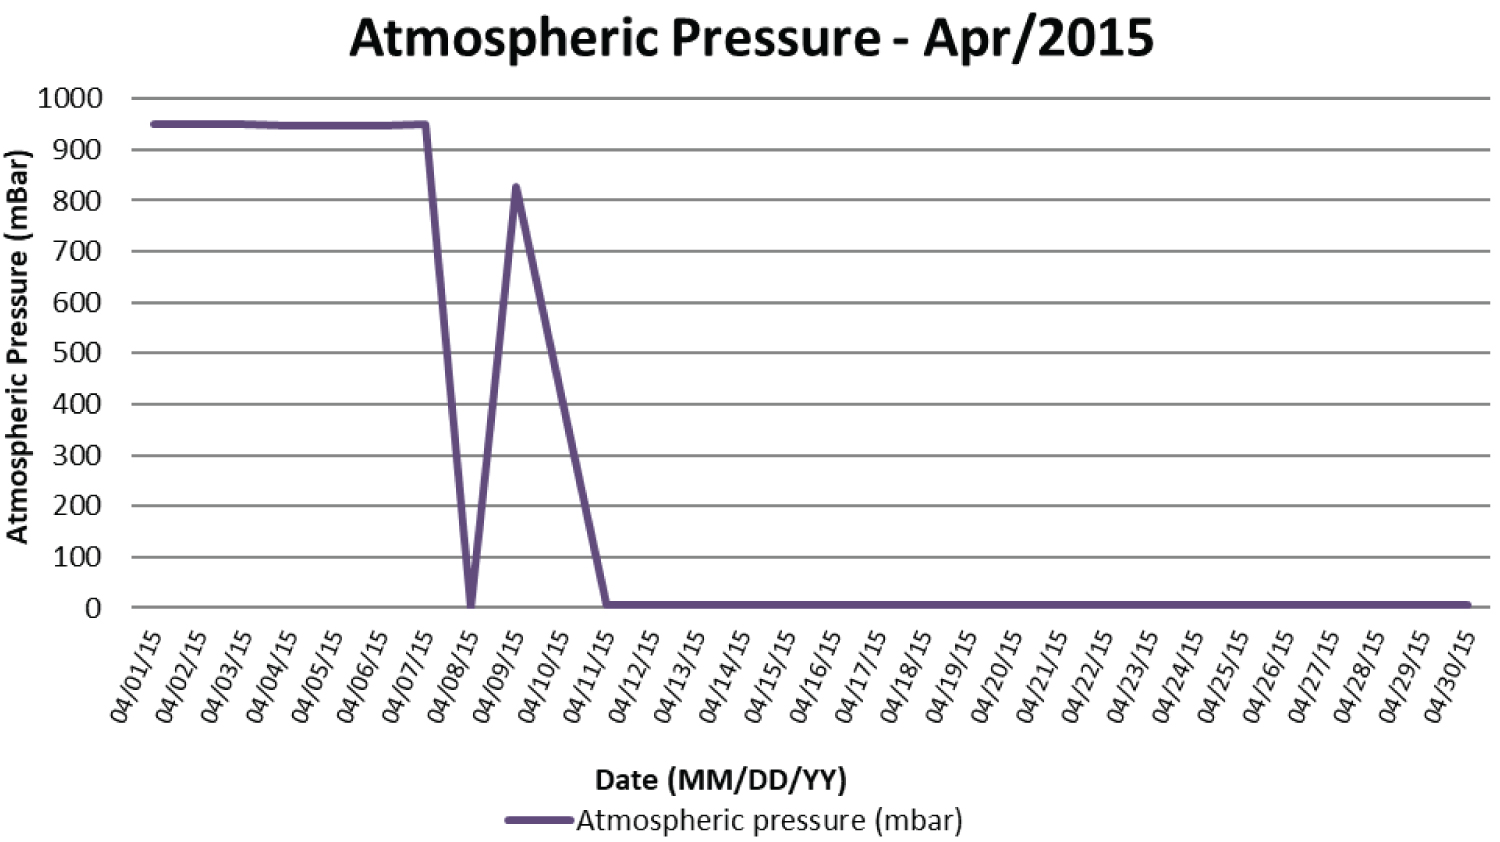
Figure 7 illustrates records of inconsistent values for atmospheric pressure measurement anywhere on the planet Earth, where its variation is between 4.99 mBar. In figure 8 we can see a very rapid variation in atmospheric pressure values, reaching the point of zeroing their values, thus making the data inconsistent. These abnormalities are simple to be visualized and verified and can be corrected if the raw encrypted data has not been reached.
Within the required data sets, the treated data was not finalized in its complete process. The EA data went through a calibration process, but not the application of the comparison tests and purging of abnormal values. The signaled data was not obtained either, which generated data corrected for configuration errors, but not for the other types of errors that a measuring instrument is susceptible to.
Data incompleteness is another essential part of the process that takes place in the processed data, that in the beginning of the station's operation the data suffered a loss of some days and were left with large gaps, the incompleteness process solves these gaps and makes the data more reliable.
Measurement history
The wind measurement history recorded in the project executed at the Engenheiro Sergio Motta Hydroelectric Plant covers the period from December/2014 to July/2017, being a total of 32 months of records.
Within this measurement history, the project also holds the records of quality control reports of the recorded data, which were developed with the three EA composition bases.
The data are not available remotely due to technical pending transmission. To facilitate this transfer, a Dropbox folder has been created for accessing the data and reports by researchers.
In the case of wind measurements, the Calibrated Data was added, a process where the raw data (in Hertz/Voltz) are applied to the correct Slope and Offset values, thus generating fully referenced data. No group of Signaled and Treated Data was received from the wind measurements.
Analysis of Results for Achieving a Consistent Data Architecture
After some years of experience with data analysis, it has become clear that it is necessary to establish what types of data are required for a broader approach to wind potential analysis.
The results show that the recommendations and techniques for data quality analysis described in this paper were partially followed with in-situ anemometric data from the Pilot Station, as quoted 4.3, in which we have only a simple validation treatment.
The validation tests of the anemometric and meteorological data were simplistic and less suited to the climatological variations found at the measurement location. Anomalies can be noted:
• Figure 3 with a persistence of the data in a single wind direction;
• Figure 5 where the wind direction remains 1° for a long time;
• Figure 6 where the wind speed becomes constant at less than 1 m/s.
• Figure 7 and figure 8 in which the pressure variation is not applied to the region, nor to any place on planet Earth.
The recommendations for testing boundary consistency, historical series consistency, consistency between different sensors, and comparison with model-estimated values were not used on the anemometric and meteorological data from the Pilot Station, in which possibly errors as in figure 6, figure 7 and figure 8 would be detected and purged, having the alternative of correcting them through data imputation techniques.
The calibrated set corrects faults from the raw data, using Slope and Offset, but does not identify more complex errors.
The gaps left in the data have not been replaced or imputed, which creates empty values in the data series, as shown in figure 2.
Due to not using the procedures and recommendations for filters, analysis, and various comparisons, the anomalies were clear in the data sets, which may make the data inconsistent for developing calculations for wind energy potential if not addressed.
Thus, it is understood that the Case Study data quality analysis methods applied to the Pilot Station, for the most part, are simple and do not explore all possible forms of uncertainty surrounding a measurand.
Conclusion
The development and success of an investigation are closely tied to quality management in the various areas and stages within a project. This involves everything from planning to the completion phase. And a factor of great impact is the data obtained during the entire research process. For good results, getting data is not enough, it is necessary that there is quality in this data and that it is reliable data. This, consecutively, will bring more credibility and add refined knowledge in the developed area.
Validation, consistency and treatment tests can be widely used since several research institutes already provide recommendations for such use.
When we talk about quality data it is necessary to note that the standards need to be as refined as possible, which generates a more coherent and closer-to-real data series.
And with the addition of this work, systematization of the types and forms of data necessary to obtain quality and more coherent data was developed.
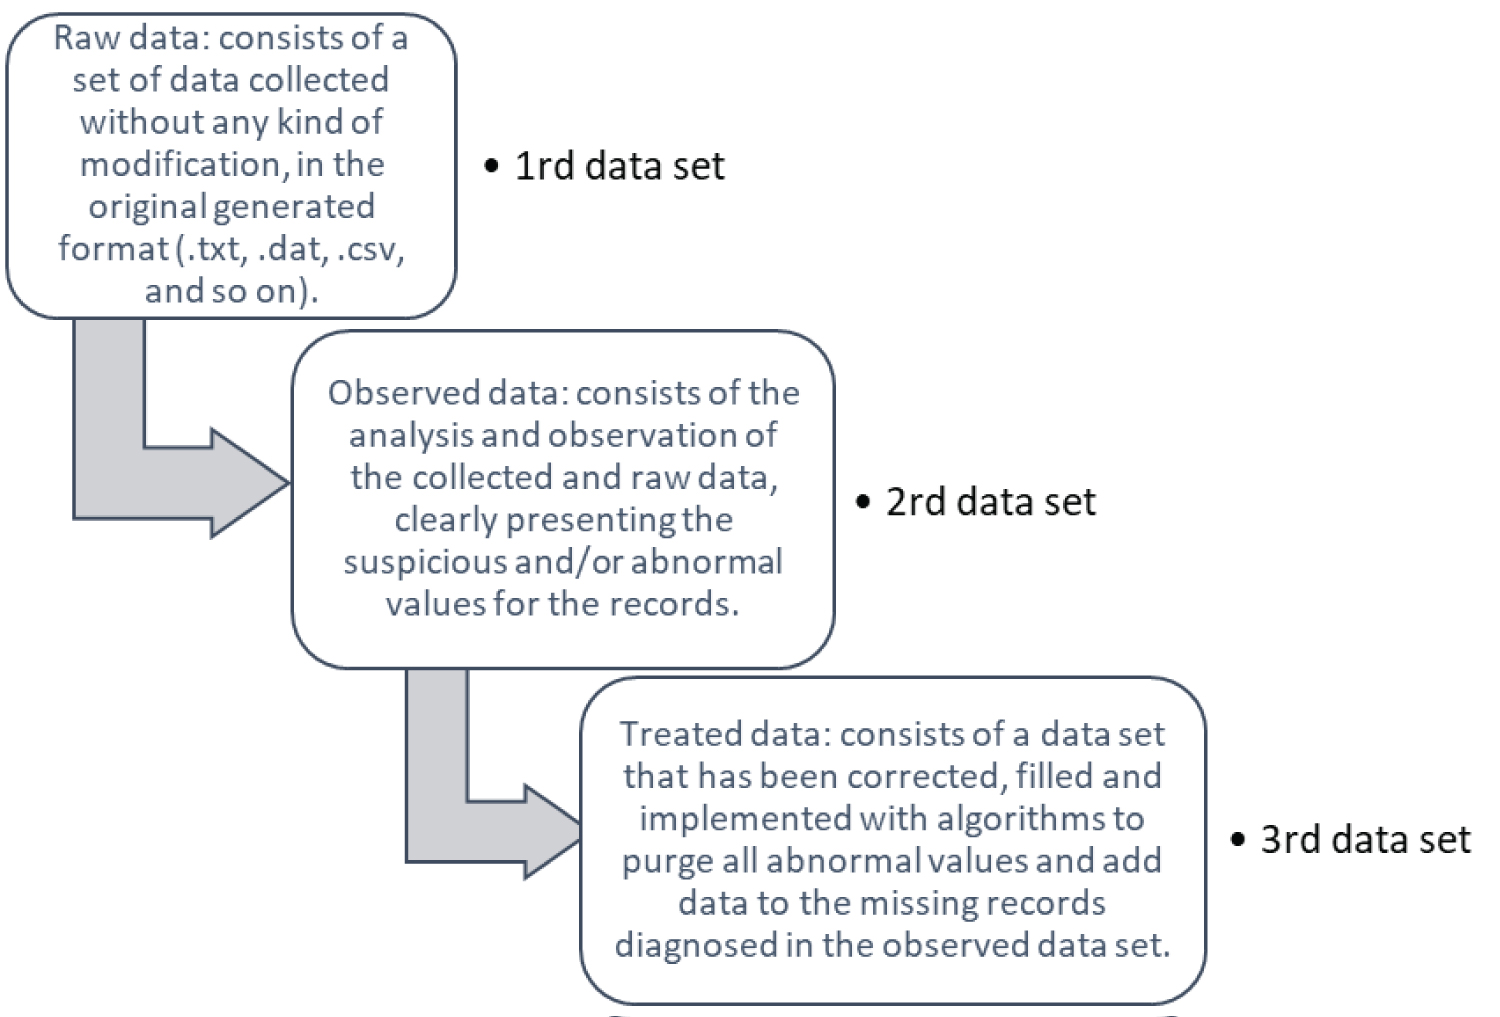
Figure 9 shows the three types of data sets that are fundamental to the development of an analysis involving a series of data aimed at understanding the energy potential, which goes from the raw data, (collected and without any kind of treatment), to the observed data (abnormalities are signaled) to the development of the treated data, which purges, fills in and corrects errors presented by the observed data.
These three data sets assist the user in the various steps necessary to develop an analysis and express the reality of what is being measured. This way of organizing the data makes it clear to the user which data set fits his needs and best serves their purpose. Finally, methods for obtaining quality in Anemometric Data invariability seek looking for a Sustainable exploration of wind.
Acknowledgments
To CESP for funding the ANEEL R&D PE-0061-0043/2014 "Integration of wind and solar photovoltaic plants to existing hydroelectric plants: an approach via energy complementation with the practical support of pilot plants with different technologies", which enabled the development of this manuscript; and, to researchers team and collaborators who participated directly and indirectly in the realization of this ANEEL R&D.
References
- Martins Fernando and Ramos PEREIRA (2011) Estudocomparativo da confiabilidade de estimativas de irradiacao solar para o sudestebrasileiroobtidas a partir de dados de satelite e por interpolacao/extrapolacao de dados de superficie. Revista Brasileira de Geofisica 29: 265-276.
- Wissmann and J A (2006) "Ferramenta Computacional para Analise de Consistencia de Dados Pluviometricos". Varia Scientia 99-106.
- Ferrari and Glaucia Tatiana (2011) Imputacao de dados pluviometricos e suaaplicacaonamodelagem de eventosextremos de secaagricola/ Glaucia Tatiana Ferrari. Piracicaba.
- Durre, Menne, VOSE, et al. (2007) Strategies for evaluating quality control procedures. In: Symposium on meteorological observation and instrumentation, San Antonio.
- Gepea (2016) Documento Tecnico Executivo. DTE-Fase2: Massa de dados e suasgrandezasgeradaspelasunidades de medicaoprimaria e secundaria. Projeto de Pesquisa e Desenvolvimento ANEEL PD-0061-0043/2014 - Programa de Pesquisa e Desenvolvimento da CompanhiaEnergetica de Sao Paulo - CESP. Sao Paulo.
- Viana and Ines Susana Ribeiro (2014) Metodo de Geracao de Dados Sinteticos para a Criacao de Microdados de Uso Publico. Tese de Mestrado, Universidade do Porto, Portugal.
- Meneses, Paulo Roberto, Almeida Tati, et al. (2012) Introducaoao Processamento de Imagens de Sensoriamento Remoto: 1 ed. Brasilia: UnB/CNPq. Distrito Federal.
- World Meteorological Organization (2004) Guide to Meteorological Instruments and Methods of Observation. Geneva Publications Board.
- Feng, Song, QIAN, et al. (2004) Quality Control Of Daily Meteorological Data In China,1951-2000: A New Dataset. International journal of climatology. Int J Climatol. 24: 853-870.
- Reek, Thomas Doty, Timothy et al. (2012) A deterministic approach to the validation of historical daily temperature and precipitation data from the cooperative network. Bulletin of the American Meteorological Society 73: 753-762.
- Stooksbury, Idso, Hubbard, et al. (1999) The effects of data gaps on the calculated monthly mean maximum and minimum temperatures in the continental United States: a spatial and temporal study. Journal of Climate 12: 1524-1533.
- Joao and Antonio (2014) Manual de Engenharia para Sistemas Fotovoltaicos. Rio De Janeiro.
- Salustiano and Rogerio Esteves (2006) Aplicacao de tecnicas de fusao de sensores no monitoramento de ambientes / Rogerio Esteves Salustiano. Campinas.
- BRASIL (1992) Ministerio da Agricultura e ReformaAgraria. Secretaria Nacional de Irrigacao. Departamento Nacional de Meteorologia. NormaisClimatologicas (1961-1990).
- National Renewable Energy Laboratory - Nrel. (1997) Wind Resource Assessment Handbook - Fundamentals for Conducting a Successful Monitoring Program. Albany.
- WMO (2004) World Meteorological Organization. Guidelines on Quality Control Procedures for Data from Automatic Weather Stations. Geneva, Switzerland, 2004.
- Foley, Leahy, Marvuglia, et al. (2012) Current Methods and Advances in Forecasting of Wind Power Generation. Renewable Energy, 37: 1-8.
- GEPEA (2016) "Relatorio Tecnico e Cientifico (RTC): Descricao das Unidades de Medicao e de GeracaoPrevistas para Instalacaona Usina HidreletricaEngenheiro Sergio Motta". Projeto de Pesquisa &Desenvolvimento (P&D) - ANEEL PD-0061-0043/2014: Integracao de PlantasEolicas e Solares Fotovoltaicas a UsinasHidreletricasExistentes: Uma abordagem via ComplementacaoEnergetica com o suportepratico de plantaspiloto com diferentestecnologias, Grupo de Energia do Departamento de Engenharia de Energia e AutomacaoEletricas, Universidade de Sao Paulo, Sao Paulo.
- GEPEA (2016) "Relatorio Tecnico e Cientifico (RTC): Determinacao e Caracterizacao da Modelagem de EnergiaPrimaria dos Ventos". Projeto de Pesquisa &Desenvolvimento (P&D) - ANEEL PD-0061-0043/2014: Integracao de PlantasEolicas e Solares Fotovoltaicas a UsinasHidreletricasExistentes: Uma abordagem via ComplementacaoEnergetica com o suportepratico de plantaspiloto com diferentestecnologias, Grupo de Energia do Departamento de Engenharia de Energia e AutomacaoEletricas, Universidade de Sao Paulo, Sao Paulo.
- GEPEA (2016) "Relatorio Tecnico e Cientifico (RTC): Calculo e Apresentacao dos Elementos de Modelagem da EnergiaPrimariaEolica". Projeto de Pesquisa & Desenvolvimento (P&D) - ANEEL PD-0061-0043/2014: Integracao de PlantasEolicas e Solares Fotovoltaicas a UsinasHidreletricasExistentes: Uma abordagem via ComplementacaoEnergetica com o suportepratico de plantaspiloto com diferentestecnologias, Grupo de Energia do Departamento de Engenharia de Energia e AutomacaoEletricas, Universidade de Sao Paulo, Sao Paulo.
- FRONDIZI, Carlos Alberto. Monitoramento da Qualidade do ar: teoria e pratica / Carlos Aberto Frondizi. Rio de Janeiro: E-papers, 2008.
Corresponding Author
Angélica Luana Linhares, São Paulo, ( GEPEA ) Energy Group of the Department of Power Engineering and Electrical Automation of the Polytechnic School, University of São Paulo, Brazil
Copyright
© 2022 Linhares AL, et al. This is an open-access article distributed under the terms of the Creative Commons Attribution License, which permits unrestricted use, distribution, and reproduction in any medium, provided the original author and source are credited.