Application of Molecular Descriptor Derived from Weighted Line Graph in Narcosis-QSAR
Abstract
Topological indices derived from line graph are in use since 1980's and are mostly used in deriving Quantitative Structure-Property Relationships. Never before weighted line graphs were used for this purpose. A descriptor, L2, derived from weighted line graph has been used in modeling Quantitative Structure-Activity Relationship (QSAR) for the narcotic activity of 123 diverse organic compounds. The competence of the model derived was evaluated and it was found to be more effective than the models proposed earlier. An optimized regression model was proposed by using successive exclusion of variable technique.
Log (1/Cnar) = 0.317 + 1.07 (± 0.13) R2 - 0.55 (± 0.13) -2.50 (± 0.15) + 3.56 (± 0.12) Vx- 0.04 (± 0.01) L2
Keywords
QSAR, Weighted line graph, Topological indices, Aquatic toxicity
Introduction
Day by day the environment is contaminated with numerous new chemicals as a consequence of new industrial or natural biological processes [1]. Many of these exhibit adverse environmental effects and may cause severe pollution problems [2,3]. Therefore the toxicity estimation of each and every chemical is a must prior to its practical application. Performing a toxicological experiment for a given substance is expensive, time consuming and need animal testing [4]. At this end, European Union REACH (Registration, Evaluation, Authorisation and Restriction of Chemicals) legislation aimed to provide toxicity information for all new and existing chemicals [5] and promotes for the use of sufficiently validated computational prediction models based on QSAR as an alternative to fill in the toxicity data gaps [4,6,7]. Various regulatory agencies like the United States Environmental Protection Agency (US EPA), European Centre for the Validation of Alternative Methods (ECVAM) of the European Union, the Agency for Toxic Substances and Disease Registry (ATSDR) and the European Union Commission's Scientific Committee on Toxicity, Ecotoxicity and Environment (CSTEE), etc. have recommended the use of QSAR models for the risk assessment of chemical compounds [8].
A QSAR model to be valid within REACH is to be obtained in accordance with the five principles set by Organization for Economic Cooperation and Development (OECD) [9]. These models are mostly species based, and predict the environmental toxicity of contaminants taking toxicity as a function of molecular structure or physicochemical properties of the toxicant [4,10-19]. QSAR models were developed and reported on a congeneric compound (i.e. chemical classes) or by considering a chemical's mode (and mechanism) of action [10,20-27]. However, a global QSAR model is still in need.
Aquatic toxicity is one of the most important measures in the ecotoxicological risk assessment of chemicals, as it constitutes a chain of different tropic level species for toxicity assays and in addition, it is less cumbersome than other test methods [28]. Due to the habitat characteristics, amphibians are often the main vertebrate group at risk of exposure to contaminants in both terrestrial and aquatic environment [29]. However, the limited data pertaining to the effects of these contaminants on amphibians enthuse on the QSAR studies to propose a structural model for optimized activity [30]. Frogs are common amphibians bridging aquatic organisms and terrestrial animals. The tadpoles are proved to be more sensitive to hazards than adult frogs [31] and have been recommended by the EU-TGD [32] for narcotic analysis.
QSAR studies generally stem on reliable data of a wide range of compounds, which is mostly lacking in chemical literature. In this context a huge data on narcotic property of organic compounds were collected by Overton [33,34]. Abraham and Rafols have extended the data set of Overton by adding new compounds in terms of their narcotic behavior from various sources making it a data set of 123 diverse organic compounds [35]. With this extensive data set and using the linear free energy relationship (LEFR), as is proposed by many authors [31,36-38] for narcosis phenomenon, they expressed the tadpole narcosis as a linear function of solvatometric parameters (Eq. 1).
Where the descriptors used are: R2 the solute excess molar refraction, the solute dipolarity/polarizability, the solute hydrogen-bond basicity and Vx is solute volume. Excluding nine outliers, the regression model has a correlation coefficient of r = 0.952 and standard deviation (SD) = 0.341.
Applying Overton Meyer's relationship [39] for tadpole narcosis, Abraham and Rafols derived the correlation equation for narcotic property in terms of water-octanol partition coefficient (log Poct) with correlation coefficient r = 0.9301 and standard deviation (SD) = 0.414. That indicates water-octanol partition coefficient alone is sufficient to explain the tadpole narcosis as is observed in many other biological phenomena [12,14,40-45].
The objective of the present work is to introduce a new molecular descriptor, weighted line graph index (L2) in the QSAR world. Hansch, et al. put the milestone in the way to search parameters as a substitute to log P [46]. Probably this forms the basis to use topological and/or other molecular descriptor in place of log P in the QSAR for toxicity of chemical compounds as is done by Agarwal, et al. [47-53].
In this context we have taken tadpole narcosis as a general data set and tried to express the narcotic activity in terms of topological indices. While doing so, they combined the distance based topological indices (W, Sz, 1χ (=B), J and log RB) with Abraham's molecular descriptors and gave a hexaparametric regression model for tadpole narcosis with better statistical significance (r = 0.9592, SE = 0.3217) [54] than Abraham and Rafols model [35].
In a subsequent study, Jaiswal and Khadikar examined the potential of distance based topological indices Wiener (W), PI (Padmakar-Ivan), Randic connectivity and Kier and Hall valence connectivity over log P in modeling tadpole narcosis by taking a heterogeneous set of 22 compounds [55]. The best model is obtained in terms of first order valance connectivity index with r = 0.9806 as presented in Eq. 2.
log (1/Cnar) = -0.7839 (± 0.1289) + 1.1859 (± 0.0544) (2)
The positive coefficient of in the above equation shows that the degree of unsaturation and the presence of heteroatom enhance the tadpole narcosis as the descriptor distinguishes the degree of unsaturation and the presence of heteroatom in the considered organic compound.
A hydrogen depleted molecular graph (G) can be obtained by taking the atoms as vertices and the bond between the atoms as the edges. In a line graph (L (G)) of G, the vertices correspond to the edges of G and two vertices of the L (G) are adjacent if their corresponding edges of the molecular graph G have a common vertex. The prologue of line graph indices in the QSPR world is due to Bertz [56]. A sporadic report of the use of line graphs in QSPR was found in literature for some mutually unrelated chemical fields [57-65].
Herein, we derived a novel weighted line graph index (L2) from the weighted iterated line graph of hydrogen depleted molecular graphs of 123 organic compounds with narcotic activity. So far, parameters derived from line graph have not yet been used in QSAR studies. Line graph has been used for the carboneous compounds while for heteroatomic compounds the weighted line graph will be more appropriate for derivation of molecular descriptors.
Enumeration of Weighted Line Graph Index (L2)
A weighted line graph is the line graph Lw (G) of a molecular graph, G, in which each vertex (ui) of Lw (G) is assigned with a nonnegative number w (ui), referred to the weight of ui. Starting with the hydrogen depleted molecular graph G or the zeroth order line graph L0(G), each vertex of the L (G) is assigned with a value equal to the weight on the connecting edge of (G) attached to the vertex 'vi' to obtain zero order weighted line graph Lw (G)0. The weight of the edge of G is the weight of the vertex (w(ui)) is given by
Where and are the weight of the vertices vi and vj respectively.
Where, Zv and H are the number of valence electron and H-atom bonded to the ith atom respectively. While tagging weight to the multiple bonds, the weight of the edge is multiplied by a factor equal to the multiplicity of the concerned bond.
The molecular descriptor for the zeroth order weighted line graph is defined as
In a similar manner, by considering the edge of Lw (G)0 as the vertex and their connectivity, the first iterated line graph, Lw (G)1, is constructed and the sum of the weight of the edges of the line graph is considered as the molecular descriptor L1. Accordingly, higher iterated graphs Lw (G)i and corresponding molecular descriptors Li can be determined. An example of weighted line graphs of ethylisobutanoate is presented in Figure 1.
Database and Methodology
The narcotic activity (log 1/Cnar) along with the Abraham's molecular descriptors and logPoct for 123 compounds collected from Abraham and Rafols's study [35] are presented in Table 1. The narcosis values vary from 0.19 for ethane-1, 2-diol to 5.33 for dodecanol. The topological indices (W, Sz, 1χ (= B), J and log RB) for the same set of 123 compounds were collected from Ref. [54] and presented in Table 2. The weighted line graph parameters L0, L1 and L2 were derived and L2 was selected for the present QSAR studies due to its nondegeneracy. Further, due to higher complexity in deriving Li of higher orders, only L2 was considered in the present study. The L2 were calculated by above reported method and presented in Table 2, along with the other topological indices under study. Comparing L2 with the rest of the descriptors, it is found that unlike all other descriptors, L2 is nondegenerate throughout the data set and thus L2 is giving a unique numerical identity to each individual compound. The L2 value ranges from 0 to 34.004. Zero values are assigned to the molecular structures with three and less number of atoms other than hydrogen. With complexity in the chemical structure, the L2 value increases. Among the molecules reported in the present study, the maximum value is due to morphine.
The interrelationship of L2 with Abraham's molecular descriptors and the topological descriptors (W, Sz, 1χ(=B), J and log RB) were analyzed by constructing the cross correlation matrix (Table 3). It is found that no single descriptor can explain the narcotic activity of the compounds effectively. The maximum correlation coefficient value for a single parametric equation (log 1/Cnar = f (molecular descriptor)) is found to be 0.6652 for Vx while for L2 the value is 0.4135. Since the independent variables having high correlation coefficient in the correlation matrix represent same statistical significance, the parameters showing poor correlations are only considered in the optimization process. As indicated by the correlation parameters, the molecular descriptor L2 does not have good correlation with other descriptors under consideration. Accordingly the optimization process is carried out by taking all the ten descriptors under study.
Multiple regression analysis was used to find out the QSAR for the narcotic activity of 123 diverse organic compounds. The regression model was optimized by reducing the number of variables using successive exclusion of variable (SEV) technique that considers the significance of the variable to explain the variance through student-test. Thus the variables with minimum't' value were excluded during the regression [66]. Further, to be valid under REACH, the model was evaluated through external validation. All the models were derived and validated using Microsoft Excel 07 and MINITAB software.
Result and Discussion
The Overton-Meyer relationship or simply Overton rule, as stated by Meyer and Hemmi [39], is the relationship between any biological activity (SP) like tadpole narcosis in the present study and the partition coefficient log P and is as follows:
Log SP = a x log P + C (5)
Abraham and Rafols's (1995) model based on log P for the set of 123 compounds is found as
Log (1/Cnar) = 1.272 + 0.780 (± 0.035) log Poct (6)
n = 123, r = 0.894, SD = 0.504, F = 486.3
When Vx was incorporated in the above regression model the correlation coefficient was increased significantly (Eq. 7). The parameter Vx is a solute volume parameter derived from reversed phase liquid chromatography [67]. In this regression model both the independent variables (log Poct and Vx) are solvation oriented parameters and empirical.
Log (1/Cnar) = 0.827 + 0.677 (± 0.041) logPoct + 0.602 (± 0.147) Vx (7)
n = 123, r = 0.9083, SD = 0.475, F = 282.7
The substitution of Vx by L2, a fully theoretical parameter, improved the regression model significantly.
Log (1/Cnar) = 1.122 + 0.736 (± 0.033) log Poct + 0.044 (± 0.009) L2 (8)
n = 123, r = 0.9124, SD = 0.464, F = 298.3
Abraham and Rafols (1995) [35] used four molecular descriptors to explain the narcotic values of these 123 compounds and found nine compounds as the outliers in the plot of observed and predicted values. The outliers are triacetin, acetamide, methylurethane, nicotine, 2-propylpiperidine, urea, hexanol-1, decanol, acetal and they assigned solubility factors for the deviation of these molecules. Excluding these outliers, they obtained a regression model
Log (1/Cnar) = 0.595 + 0.805 (± 0.107) R2 - 0.725 (± 0.135) -2.489 (± 0.166) + 3.341 (± 0.115) Vx (9)
n = 114, r = 0.9520, SD = 0.341, F = 263.0
In a subsequent work Agrawal, et al. [54] added two more independent variables out of five selected topological indices in the regression model for the same data set and increased the correlation coefficient values to 0.9592.
To obtain an optimized regression model by using Abraham and Rafols's parameters with topological parameters reported by Agrawal, et al. and L2, the data of all 114 compounds were subjected to multiple regression analysis. The Abraham and Rafols's parameters are derived from solute-solvent interactions, while Agrawal, et al.'s parameters are distance based, while L2 is a complex parameter explaining the compactness of the structure including valence electrons as a component.
The regression model was optimized by successive exclusion of variable considering tmin, F, R2 (or r) and RMS. Increase in R2 and F and decrease in RMS values suggest improvement of regression model and hence leads to optimization [66]. Table 4 shows the successive exclusion of variables to obtain the optimized model.
Log (1/Cnar) = 0.290 + 1.0827 (± 0.1366) R2 -0.60798 (± 0.1332) -2.5332 (± 0.1576) + 3.6493 (± 0.1263) Vx- 0.0451 (± 0.0127) L2 (10)
n = 114, SD = 0.3216, r = 0.9595, F = 250.5.
Interestingly the optimized model was found to include L2 as the only topological parameter to explain the narcotic values.
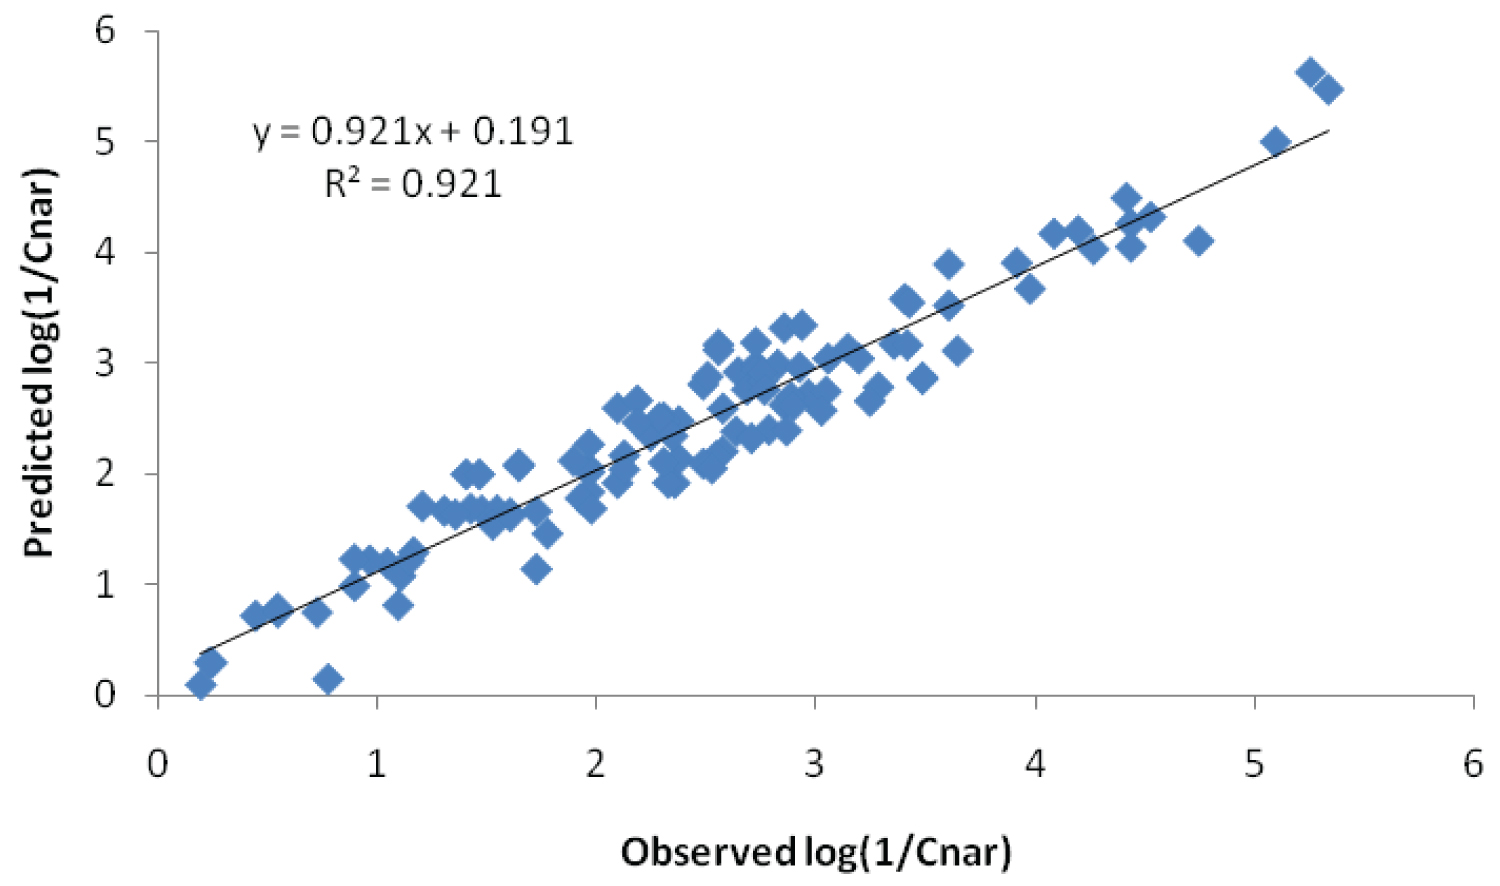
With an encouraging results on the use of L2 in the regression model, we used the above five independent variables in the regression model for 123 compounds to obtain a general Eq. 11. When the narcotic values predicted by this equation were plotted against the observed values a straight line was obtained (Figure 2). Considering a deviation of > 0.8 from the linearity nine outliers were identified, out of which seven are identified by Abraham and Rafols. When the data of these outliers were excluded, the regression model with 114 compounds was found to be the best among all the regression models proposed earlier (n = 114, SD = 0.3165, r = 0.96012, F = 254.7). The statistical significance of the model was further tested in terms of K parameter [68]. The parameter was normally used in SEV technique to select the optimized model in situations where simultaneous increase in F and RMS value is found and computed by dividing the F value by the corresponding RMS value for a given model. The same parameter can also be employed to compare the statistical significance of two models. Increase in K value suggests the statistical improvement in the model. In the present case, an increase in K value to 778.9 in Eq. 11 from that of Eq. 9 (K = 597.1) prescribed the regression model to be better.
Model validation
The main objective of a QSAR model is to predict the activity of an external compound which was not used in the development of the model. As per the principles of OECD, external validation is the only way to “determine” the true predictive power of a QSAR model. In this context, the whole data set was distributed in to a training set and a test set. The training set was used in the development of the model and the predictive ability of the model developed was evaluated with the external test set. The distribution was done in the ration 1:4. For this, the compounds in the whole data set were sorted according to their narcotic activity (log (1/Cnar)) and then, every fifth compound was coined for the validation set and the rest were saved for the training set. The predictive ability of the model developed was evaluated in terms of the statistical parameter and is defined as: - PRESS/SD, where PRESS is the sum of squared differences between the observed and the predicted activity for each molecule in the validation set, and SD is the sum of squared deviations between the observed activity for each molecule in the validation set and the mean observed activity of the training set [69]. After evaluation the final model with its statistical parameters is as follows:
Log (1/Cnar) = 0.317 + 1.0660 (± 0.1339) R2 -0.5453 (± 0.1282) -2.5021 (± 0.1543) + 3.5593 (± 0.1248) Vx- 0.0441 (± 0.01252) L2 (11)
ntotal = 114, r = 0.9601, R2 = 0.9218, R2 (adj) = 0.9182, R2 (pred) = 0.9127, SD = 0.3165, F = 254.74.
ntrain = 92 , r = 0.9593, R2 = 0.9204, R2 (adj) = 0.9158, R2 (pred) = 0.9084, SD = 0.3209, F = 198.85.
nvalid = 22, r = 0.9750, R2 = 0.9507, R2 (adj) = 0.9353, SD = 0.2569, F = 65.75, = 0.9254.
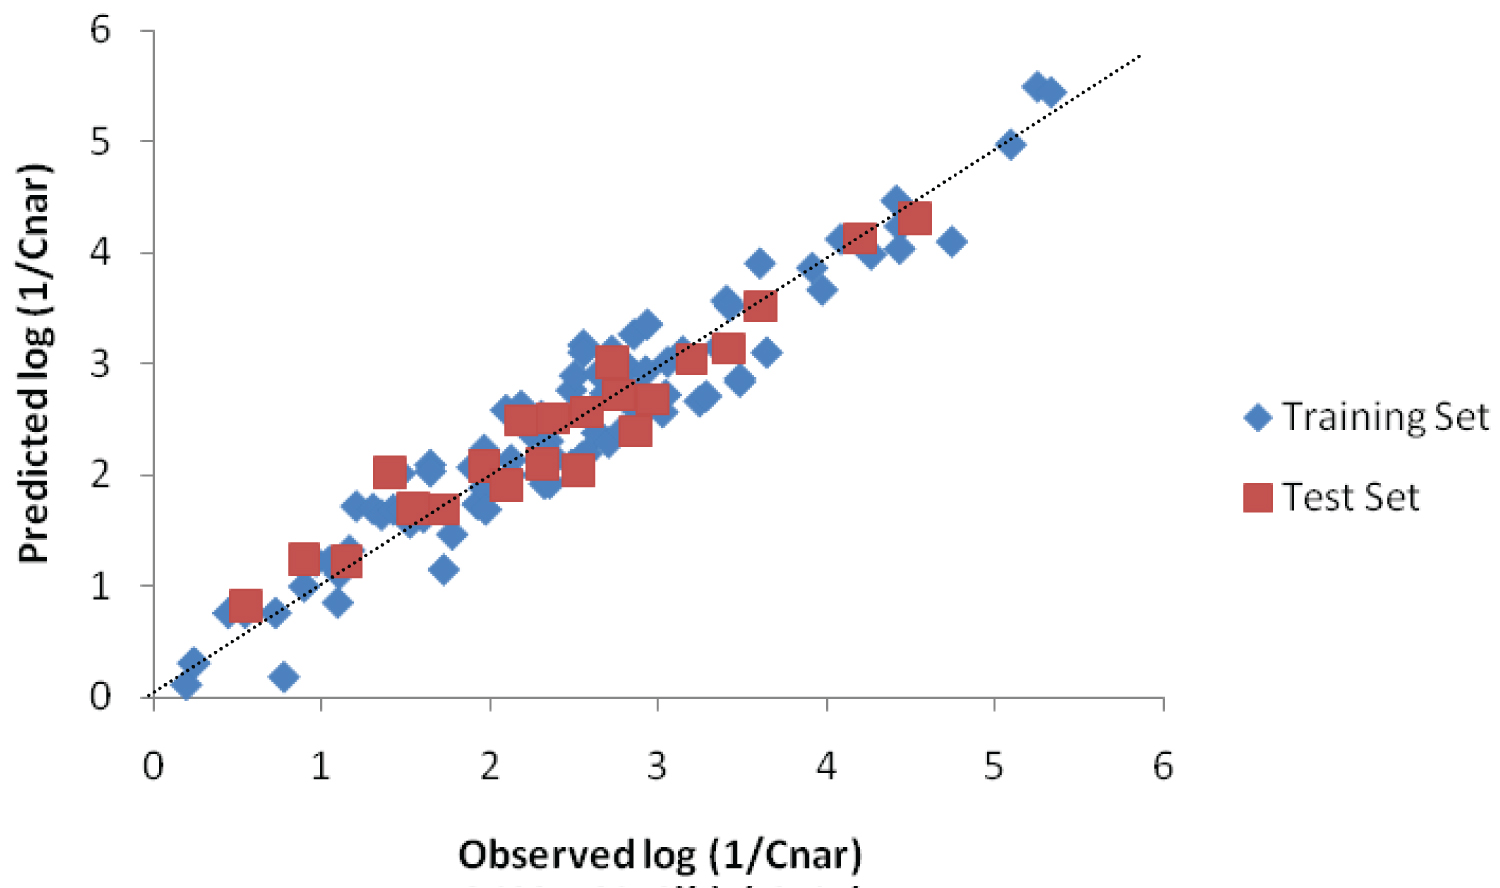
ntrain and nvalid stand for the number of compounds in training set and validation set, respectively. The statistical parameters for the whole data set, training set and also for the validation set are close to each other that indicate, the model proposed is not by chance. Further, the parameters (R2, R2 (adj) and SD) and internal validation parameter (R2 (pred)) clearly states the fitting efficiency and robustness of the model proposed. The predictive ability of the model was also satisfactory as the parameters and R2 for the training set are close to each other. This is further supported by the evenly distribution of data points on both sides of the dashed line in Figure 3.
Principal component analysis
To reduce the number of descriptors in QSPR/QSAR studies, principal component analysis (PCA) plays a significant role. This technique also helps in classification of the descriptors from their relationships with the derived principal components. When all the twelve descriptors have been subjected to PCA, the first PC found to explain 60.5% variance of the toxicity and cumulatively first eight PCs can explain 99% of the variance. The PCs have orthogonal relationship with each other and hence considered as good candidates for correlation analysis, albeit the resultant coefficients do not contribute much to the physical significance of the regression model. The molecular descriptors were correlated with the PCs and it is found that beyond PC3 the correlations are found to be poor (i.e. < 0.5). PC2 correlate well with R2 and J, while PC3 has a good correlationship with . These parameters have generic peculiarity and hence differ from other descriptors. Most of the rest descriptors correlate well with PC1. The descriptors L0, Sz, W, 1χ (=B) and log (RB) have 'r' values > 0.8 and R2, , , Vx and L2 have 0.6 - 0.8. Though, there is no specific reasoning of this division of parameters into different groups, the generic characteristics like connectivity, solvation may have some contribution to this classification. The newly generated weight line graph indices are found to have a common characteristic domain with the connectivity parameters.
With an aim to utilize the PCs for the prediction of toxicity, seven PCs were subjected to regression analysis with the narcosis activity. Using SEV technique as reported earlier, the optimized equation was obtained with an r = 0.9382 and F = 158.781, which are lower than the model proposed earlier (r = 0.96012, F = 254.7).
Conclusion
Albeit narcotic behavior is a complex phenomenon in aquatic animals, the structure of the narcotic plays an important role. The parameters derived from solute-solvent interactions are the most important factor in QSAR as these parameters explain the transportability of the compounds in the body fluid and specific interactions with the biomolecules. However, the role of topological parameters, which can be obtained directly from molecular structure, cannot be ruled out. Parameters derived from line graphs, which are already reported to explain many physical characteristics of carboneous compounds, the weighted line graphs are found to be excellent additives with empirical parameters in QSAR.
Acknowledgement
BKM thanks University Grant Commission (New Delhi) for financial support through Basic Science Research Faculty Fellowship and Emeritus Fellowship.
References
- Khan K, Roy K, Benfenati E (2019) Ecotoxicological QSAR modeling of endocrine disruptor chemicals. J Hazard Mater 369: 707-718.
- Scherb H, Voigt K (2011) Adverse Genetic Effects Induced by Chemical or Physical Environmental Pollution. Environ Sci Pollut Res 18: 695-696.
- Yu X (2020) Quantitative structure-toxicity relationships of organic chemicals against Pseudokirchneriella subcapita ta. Aquat Toxicol 105496.
- Khan K, Benfenati E, Roy K (2019) Consensus QSAR Modeling of Toxicity of Pharmaceuticals to Different Aquatic Organisms: Ranking and Prioritization of the Drug Bank Database Compounds. Ecotoxicol Environ Saf 168: 287-297.
- Worth AP, Bassan A, DeBruijn J, et al. (2007) The Role of the European Chemicals Bureau in Promoting the Regulatory Use of (Q)SAR Methods. SAR QSAR Environ Res 18: 111-125.
- European Commission (2006) Directive 2006/121/EC of the European Parliament and of the Council of 18 December 2006 amending Council Directive 67/548/EEC on the approximation of laws, regulations and administrative provisions relating to the classification, packaging and labelling of dangerous substances in order to adapt it to Regulation (EC) no 1907/2006 concerning the Registration, Evaluation, Authorisation and Restriction of Chemicals (REACH) and establishing a European Chemicals Agency. Off J Eur Union L 396: 850-856.
- Dearden JC (2017) The History and Development of Quantitative Structure-Activity Relationships (QSARs) In Oncology: Breakthroughs in research and practice. IGI Global 67-117.
- Myatt GJ, Ahlberg E, Akahori Y, et al. (2018) In Silico Toxicology Protocols. Regul Toxicol Pharmacol 96: 1-17.
- Organization for Economic Cooperation and Development (OECD), Guidance Document on the Validation of (Quantitative) Structure-Activity Relationship [(Q)SAR] Models, ENV/JM/MONO 2 : 1-154.
- Netzeva TI, Pavan M, Worth AP (2008) Review of (Quantitative) Structure-Activity Relationships for Acute Aquatic Toxicity QSAR. Comb Sci 27: 77-90.
- Roy K, Kar S, Das RN (2015) Understanding the Basics of QSAR for Applications in Pharmaceutical Sciences and Risk Assessment. (1st edn), Academic Press 484.
- Klüver N, Vogs C, Altenburger R (2016) Development of a General Baseline Toxicity QSAR Model for the Fish Embryo Acute Toxicity Test. Chemosphere 164: 164-173.
- Adhikari C, Mishra BK (2018) Quantitative Structure-Activity Relationships of Aquatic Narcosis: A Review. Curr Comput-Aid Drug Des 14: 7-28.
- Klüver N, Bittermann K, Escher BI (2019) QSAR for Baseline Toxicity and Classification of Specific Modes of Action of Ionizable Organic Chemicals in the Zebrafish Embryo Toxicity Test. Aquat Toxicol 207: 110-119.
- Khan K, Baderna D, Cappelli C, et al. (2019) Ecotoxicological QSAR Modeling of Organic Compounds Against Fish: Application of Fragment based Descriptors in Feature Analysis. Aquat Toxicol 212: 162-174.
- Khan K, Khan PM, G Lavado G, et al. (2019) QSAR Modeling of Daphnia Magna and Fish Toxicities of Biocides using 2D Descriptors. Chemosphere 229: 8-17.
- Pandey SK, Ojha PK, Roy K (2020) Exploring QSAR Models for Assessment of Acute Fish Toxicity of Environmental Transformation Products of Pesticides (ETPPs). Chemosphere 252: 126508.
- Abramenko N, Kustov L, Metelytsia L, et al. (2020) Review of Recent Advances towards the Development of QSAR Models for Toxicity Assessment of Ionic Liquids. J Hazard Mater 384: 121429.
- Marzo M, Lavado OJ, Como F, et al. (2020) QSAR Models for Biocides: The Example of the Prediction of Daphnia Magna Acute Toxicity. SAR and QSAR Environ Res 31: 227-243.
- Jin L, Gu Y, Dai J, et al. (1999) Toxicity of Substituted Benzaldehydes to Photobacterium Phosphoreum and Quantitative Structure-Activity Relationship. Toxicol Environ Chem 69: 149-156.
- Katritzky AR, Radzvilovits M, Slavov S, et al. (2010) Quantitative Structure-Activity Relationship Modeling of Bioconcentration Factors of Polychlorinated Biphenyls. Toxicol Environ Chem 92: 1233-1247.
- Lozano S, Lescot E, Halm MP, et al. (2010) Prediction of Acute Toxicity in Fish by Using QSAR Methods and Chemical Modes of Action. J Enzyme Inhib Med Chem 25: 195-203.
- Ha H, Park K, Kang G, et al. (2019) QSAR Study using Acute Toxicity of Daphnia Magna and Hyalella Azteca through Exposure to Polycyclic Aromatic Hydrocarbons (PAHs). Ecotoxicology 28: 333-342.
- Khan K, Roy K (2019) Ecotoxicological QSAR Modelling of Organic Chemicals against Pseudokirchneriella Subcapitata using Consensus Predictions Approach. SAR and QSAR Environ Res 30: 665-681.
- Umbuzeiro GDA, Albuquerque AF, Vacchi FI, et al. (2019) Towards a Reliable Prediction of the Aquatic Toxicity of Dyes. Environ Sci Eur 31: 76.
- Liu W, Wang X, Zhou X, et al. (2020) Quantitative Structure-Activity Relationship between the Toxicity of Amine Surfactant and its Molecular Structure. Sci Total Environ 702: 134593.
- Ghosh S, Ojha PK, Carnesecchi E, et al. (2020) Exploring QSAR Modeling of Toxicity of Chemicals on Earthworm. Ecotoxicol Environ Saf 190: 110067.
- Lagunin AA, Zakharov AV, Filimonov DA, et al. (2007) A New Approach to QSAR Modelling of Acute Toxicity. SAR QSAR Environ Res 18: 285-298.
- Hopkins WA (2007) Amphibians as models for studying environmental change. ILAR J 48: 270-277.
- Mann RM, Bidwell JR (2001) The Acute Toxicity of Agricultural Surfactants to the Tadpoles of Four Australian and Two Exotic Frogs. Environ Pollut 114: 195-205.
- Wang X, Dong Y, Wang L, et al. (2001) Acute Toxicity of Substituted Phenols to Rana Japonica Tadpoles and Mechanism-based Quantitative Structure-Activity Relationship (QSAR) Study. Chemosphere 44: 447-455.
- Papa E, Battaini F, Gramatica P (2005) Ranking of Aquatic Toxicity of Esters Modelled by QSAR. Chemosphere 58: 559-570.
- Lipnick RL (1988) A Quantitative Structure-Activity Relationship Study of Overton's Data on the Narcosis and Toxicity of Organic Compounds to the Tadpole, Rana Temporaria. Aquatic Toxicology and Environmental Fate: Eleventh Volume, ASTM International.
- Overton CE (1991) Studies on Narcosis Edited by RL Lipnick, Chapman and Hall, London.
- Abraham MH, Rafols C (1995) Factors that Influence Tadpole Narcosis: An LFER Analysis. J Chem Soc Perkin Trans2: 1843-1851.
- Wang X, Dong Y, Xu S, et al. (2000) Quantitative Structure-Activity Relationships for the Toxicity to the Tadpole Rana Japonica of Selected Phenols. Bull Environ Contam Toxicol 64: 859-865.
- Huang H, Wang X, Ou W, et al. (2003) Acute Toxicity of Benzene derivatives to the Tadpoles (Rana Japonica) and QSAR Analyses. Chemosphere 53: 963-970.
- Bowen KR, Flanagan KB, Acree WE, et al. (2006) Correlation of the Toxicity of Organic Compounds to Tadpoles using the Abraham Model. Sci Total Environ 371: 99-109.
- Meyer KH, Hemmi H (1935) Beitrage zur theorie der narkose III. Biochem Zeit 277: 39-71.
- Konemann H (1981) Quantitative Structure-Activity Relationships in Fish Toxicity Studies Part 1: Relationship for 50 Industrial Pollutants. Toxicology 19: 209-221.
- JC Dearden (1985) Partitioning and Lipophilicity in Quantitative Structure-Activity Relationships. Environ Health Perspect 61: 203-228.
- Veith GD, Broderius SJ (1987) Structure-Toxicity Relationships for Industrial Chemicals Causing Type (II) Narcosis Syndrome, in QSPR in EnVironmental Toxicology-II, KLEKaiser eds, D Reidel Publishing Company, Dordrecht, 385-391.
- Deneer JW, Seinen W, Hermens JLM (1988) The Acute Toxicity of Aldehydes to the Guppy. Aquat Toxicol 12: 185-192.
- Schultz TW, Lin DT, Wilke TS, et al. (1990) Quantitative Structure-Activity Relationships for the Tetrahymena Pyriformis Population Growth Endpoint: A Mechanism of Toxic Action Approach Practical Applications of Quantitative Structure-Activity Relationships (QSAR), in Environmental Chemistry and Toxicology, Dordrecht, Kluwer, The Netherlands, 241-262.
- Schultz TW, Bryant SE, Lin DT (1994) Structure-Toxicity Relationships for Tetrahymena: Aliphatic Aldehydes. Bull Environ Contam Toxicol 52: 279-285.
- Hansch C, Kurup A, Garg R, et al. (2001) Chem-bioinformatics and QSAR: A Review of QSAR Lacking Positive Hydrophobic Terms. Chem Rev 101: 619-672.
- Khadikar PV, Agrawal VK, Karmarkar S (2002) Prediction of Lipophilicity of Polyacenes using Quantitative Structure-Activity Relationships. Bioorg Med Chem 10: 3499-3507.
- Khadikar PV, Karmarkar S (2002) On the Estimation of PI Index of Polyacenes. Acta Chim Slov 49: 755-771.
- Khadikar PV, Phadnis A, Shrivastava A (2002) QSAR Study on Toxicity to Aqueous Organisms using the PI Index. Bioorg Med Chem 10: 1181-1188.
- Khadikar PV, Singh S, Shrivastava A (2002) Novel Estimation of Lipophilic Behaviour of Polychlorinated Biphenyls. Bioorg Med Chem Lett 12: 1125-1128.
- Agrawal VK, Singh J, Khadikar PV (2002) On the Topological Evidences for Modelling Lipophilicity. Bioorg Med Chem 10: 3981-3996.
- Khadikar PV, Mathur KC, Singh S, et al. (2002) Study on Quantitative Structure-Toxicity Relationships of Benzene Derivatives Acting by Narcosis. Bioorg Med Chem 10: 1761-1766.
- Khadikar PV, Mandloi D, Bajaj AV, et al. (2003) QSAR Study on Solubility of Alkanes in Water and their Partition Coefficients in Different Solvent Systems using PI Index. Bioorg Med Chem Lett 13: 419-422.
- Agrawal VK, Chaturvedi S, Abraham MH, et al. (2003) QSAR Study on Tadpole Narcosis. Bioorg Med Chem 11: 4523-4533.
- Jaiswal M, Khadikar P (2004) QSAR Study on Tadpole Narcosis using PI Index: a case of heterogenous set of compounds. Bioorg Med Chem 12: 1731-1736.
- Bertz SH (1981) The Bond Graph. J Chem Soc Chem Comm 16: 818-820.
- Bertz SH (1988) Branching in Graphs and Molecules. Discr Appl Math 19: 65-83.
- Gutman I, Estrada E (1996) Topological Indices Based on the Line Graph of the Molecular Graph. J Chem Inf Comput Sci 36: 541-543.
- Estrada E, Gutman I (1996) A Topological Index Based on Distances of Edges of Molecular Graphs. J Chem Inf Comput Sci 36: 850-853.
- Gutman I, Popovic L, Mishra BK, et al. (1997) Application of Line Graphs in Physical Chemistry Predicting the Surface Tensions of Alkanes. J Serb Chem Soc 62: 1025-1029.
- Kuanar M, Kuanar SK, Mishra BK, et al. (1999) Correlation of Line Graph Parameters with Physicochemical Properties of Octane Isomers. Indian J Chem A38: 525-528.
- Gutman I, Tomovic Z (2000) On the Application of Line Graphs in Quantitative Structure-Property Studies. J Serb Chem Soc 65: 577-580.
- Gutman I, Tomvic Z, Mishra BK, et al. (2001) On the Use of Iterated Line Graphs in Quantitative Structure-Property Studies. Indian J Chem A40: 4-11.
- Tomovic Z, Gutman I (2001) Modeling Boiling Points of Cycloalkanes by means of Iterated Line Graph Sequences. J Chem Inf Comput Sci 41: 1041-1045.
- Nikolic S, Trinajstic N, Amic D, et al. (2001) Modeling the Solubility of Aliphatic Alcohols in Water Graph Connectivity Indices versus line Graph Connectivity Indices, in QSAR/QSPR Studies by Molecular Descriptors, M Diudea, eds, Nova Science Publishers, Huntington, New York, USA, 63-81.
- Sahoo S, Patel S, Dash S, et al. (2009) A Molecular Structure Descriptor Derived from Bond-disconnection: Application to Quantitative Structure Property Relationships. Indian J Chem A 48: 921-929.
- Abraham MH, McGowan JC (1987) The Use of Charecteristic Volumes to Measure Cavity Terms in Reversed Phase Liquid Chromatography. Chromatographia 23: 243-246.
- Sahoo S, Kuanar M, Patel S, et al. (2014) Quantitative Relationships between Structure and Physicochemical Properties of Natural Amino Acids using Topological and Quantum-Chemical Molecular Descriptors. Indian J Chem A53: 1324-1331.
- Papa E, Villa F, Gramatica P (2005) Statistically Validated QSARs, Based on Theoretical Descriptors, for Modeling Aquatic Toxicity of Organic Chemicals in Pimephales Promelas (fathead minnow). J Chem Inf Model 45: 1256-1266.
Corresponding Author
Chandana Adhikari, Centurion University of Technology and Management, Odisha, India.
Copyright
© 2021 Adhikari C, et al. This is an open-access article distributed under the terms of the Creative Commons Attribution License, which permits unrestricted use, distribution, and reproduction in any medium, provided the original author and source are credited.