Diversity of Pumpkins from Uganda Based on Phenotypic and Repeat DNA Markers
Abstract
Pumpkins (Cucurbita pepo) are valuable sources of nutrients for human consumption and have a capacity to enhance food security. However, their potential in Uganda has not been fully developed. There is limited information on pumpkin diversity in Uganda. This study, therefore, evaluated the diversity of pumpkins in Uganda using sequence repeats molecular and morphological markers. Correlation of morphology and genetic data was also evaluated. The 66 pumpkin samples collected from the districts of Arua, Mbale, Mubende and Kabale were evaluated using 16 morphological traits and 10 microsatellite markers. Morphologically the pumpkins showed high diversity and were ranked into three clusters. The SSR markers detected high genetic diversity with an average percentage polymorphism of 79.47%. Significant variation of pumpkin varieties within the district was revealed. The pumpkins were genetically ranked into six clusters. Limited correlation between morphological and molecular data among pumpkins varieties was revealed indicating that for pumpkins morphological and microsatellites data cannot be used interchangeably.
Keywords
Diversity, Morphological traits, Microsatellite markers
Introduction
Pumpkins (Cucurbita pepo) are an important source of nutrients for human nourishment with their seeds, leaves and fruits all utilized as food. They contain biologically active components such as para-aminobenzoic acid, polysaccharides, fixed oils, sterols and proteins are beneficial to human health [1,2]. Traditionally, pumpkins have been used as anticancer, anti-oxidant, anti diabetic, antihyperlipidemic, and antimicrobial [3,4]. Pumpkin fruits and leaves are used as vegetables with their seed utilized as sauce and snacks. Pumpkins are adapted to diverse climatic conditions and are rich in various nutrients; therefore, their production could contribute to improved household food security and livelihoods [5].
Pumpkins are some of the most morphologically variable plants in the entire plant kingdom [6]. A lot of variation has been noticed in pumpkins both at its productive and vegetative stages. Genetic diversity is assessed by different marker systems. These markers include; those based on phenotypic traits, those based on gene product (biochemical markers) and those based on DNA also known as molecular markers [7]. Molecular DNA markers are very crucial in analyzing genetic diversity in species because they are abundant and not influenced by changes in the plant development and environment [8,9].
Despite the fact that pumpkins are an important food source, with many health benefits, their potential has not been fully developed in Uganda. Currently there is limited information on the pumpkin genetic diversity in Uganda. Research on pumpkins in Uganda has concentrated on local knowledge of pumpkin production, performance and utilization systems [10] and determination of their micronutrients [11]. Limited research has also been done on the genetic diversity of pumpkins from in Uganda using morphological traits, molecular characterization [12], but this research was done on selected production zones in Uganda using only five AFLPs and SSRs primers. At least eight primers are the required minimum number of microsatellite loci needed to assess population genetic structure [13]. In order to improve crop production, it is necessary to know the amount of genetic diversity present within a crop population. Limited information on the pumpkin genetic diversity has, therefore, hindered the use of the available gene pool in breeding pumpkins with superior agronomic traits that meet the ever growing market demand in Uganda. Furthermore, conservation of the pumpkins' gene pool is also difficult since information on their diversity is limited. Without better conservation methods in place, there is a likelihood of genetic erosion of important pumpkin genes from the gene pool. Therefore, this study aimed at determining the diversity of pumpkins in Uganda using phenotypic and repeat DNA markers. The correlation of data obtained using phenotypic and repeat DNA markers was also evaluated.
Materials and Methods
Plant materials
The pumpkins samples were randomly selected from the districts of Mubende, Arua, Mbale, and Kabale. These districts were purposively selected since they are main producers of pumpkins in Uganda [10]. The help of the village Local Council One (LC1) chairpersons was enlisted to identify ten homesteads randomly from each village. The pumpkin fruit samples were collected from these ten homesteads in each village. One pumpkin per variety was selected for all the pumpkin varieties found in each homestead farm. All the pumpkin samples collected in the 3 village in each district were pooled together and a random sample of 20 pumpkins was selected from the pool to represent all the pumpkins in that district. In total 80 pumpkin samples were picked in all the four districts. The pumpkins' fruit morphological traits for each pumpkin were identified and recorded. The seeds were then extracted and dried and the morphological traits of each pumpkin variety seeds recorded. The 80 pumpkin variety seeds for were then planted and seeds from 66 pumpkin varieties germinated as indicated in Table 1 below. These were the only pumpkin varieties included in the study for phenotypic and molecular characterization.
Morphological evaluation of pumpkins
The pumpkin descriptor list [14] was used to collect the morphological data. The data was collected on eight qualitative characters and eight quantitative characters. The qualitative characters included; leaf colour, leaf shape, fruit shape, predominant skin colour, stem end shape, fruit ribbing, seed hull and seed coat colour. The quantitative characters included; leave number per plant at six weeks, length of vine at six weeks, leaf length, leaf width, petiole length, seed length, seed width and weight of 100 seeds. The quantitative data were taken as the mean value of three measurements made on three plants per variety. The data on qualitative descriptors were recorded after consulting a panel of two plant science specialists while quantitative data were recorded using the measuring devices as require.
DNA extraction and polymerase chain reaction
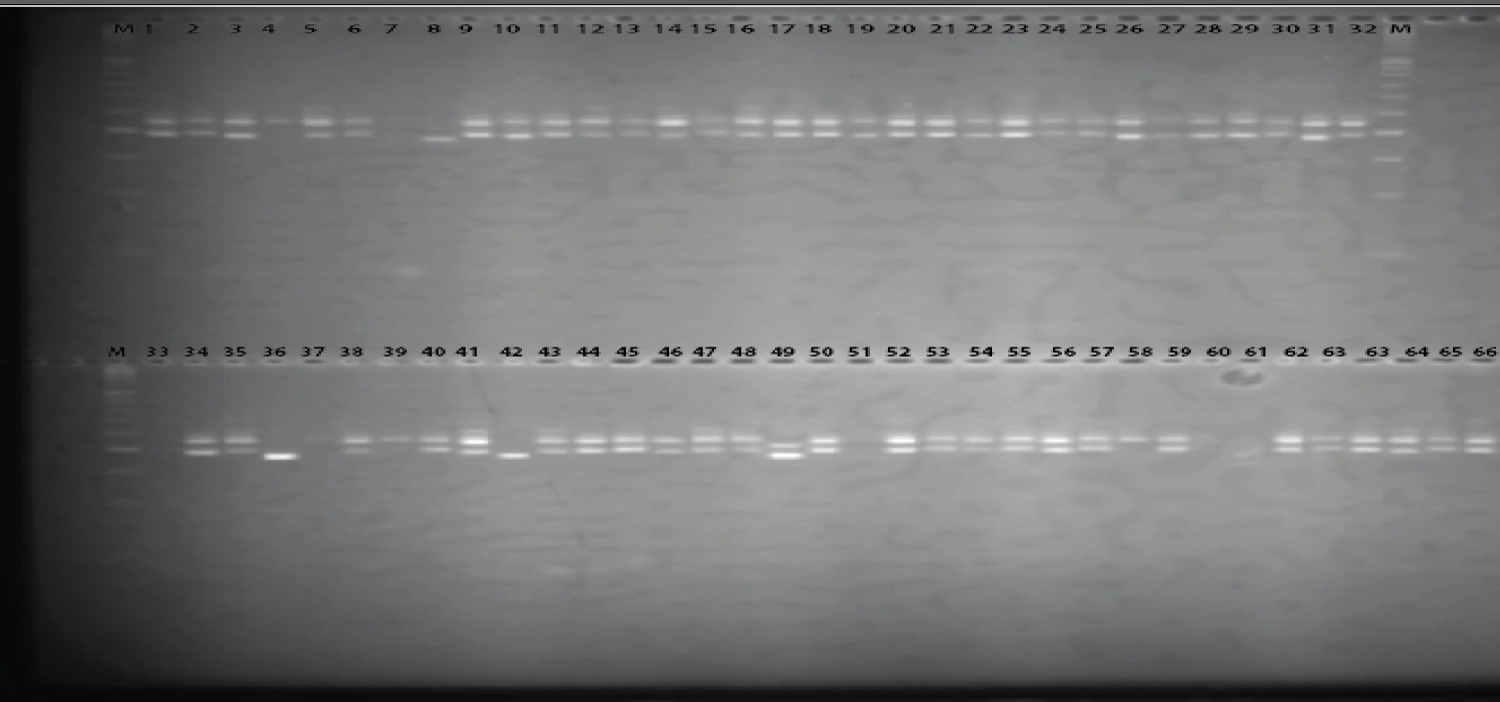
Three-week-old leaves growing from the planted pumpkin seeds were used for DNA extraction. CTAB-based method developed by Mace, et al. [15] was used to isolate genomic DNA from the pumpkin varieties. The Nano Drop 2000C spectrophotometer was used to determine the concentration and purity of the DNA from each sample. Ten microsatellite primers pairs confirmed for pumpkin DNA amplification by Watcharawongpaiboon and Chunwongse, [16] and Priori, et al. [17] were used to amplify the DNA. A total reaction mixture of 25 µl for each primer set was used to test primer amplification. The reaction mixture contained 2.5 μL of 10 mM MgCl2, 2.5 μL of 10X buffer, 2.5μL of 2.5 mM dNTPs, 0.5μL of 10.0 pmole/μL forward primer, 0.5 μL of 10.0 pmole/μL reverse primer, 0.5 μL of 5 U/μLTaq Polymerase, 1.0 μL of 60 ng/μL DNA, and 15.0 μL H2O for each primer. The PCR running conditions were: Initial denaturation at 94 °C for 2 minutes, followed by 35 cycles of denaturation at 94 °C for 30 minutes, 1 min annealing at 53-62 °C (depending on the annealing temperatures of the primers as indicated in the Table 2 above), 1 min of extension at 72 °C, followed by a final extension of 10 min at 72 °C. The PCR product was stained with 5 μg/ml bromophenol blue and then and run on 3% w/v agarose gel stained with 5 μg/ml of ethidium bromide. The PCR products were analyzed on an 8% polyacrylamide gel electrophoresis. For each PCR product, stained with 5 μg/ml bromophenol blue, 4 μL were pipetted into a separate well of the polyacrylamide gel. All the PCR products for all samples and primers were run along with 50 bp DNA ladder on polyacrylamide gel electrophoresis. After electrophoresis, the polyacrylamide gel was stained in 0.5 μg/l ethidium bromide for 30 minutes and then visualized under UV light using the Syngene U: Genius 3 gel documentation system (Integrated Scientific Solution, Inc., San Deigo CA).
Data analysis
Gen Stat for Windows, 12th edition was used to analyze morphological data. The qualitative data was first coded before analysis. Descriptive statistics were used to compare the level of phenotypic variation. Principle component analysis (PCA) was used to identify characteristics that contribute significantly to the variability among the pumpkin. Cluster analysis was conducted for grouping pumpkin varieties. Gen Alex 6.5 [18] was used to analyze molecular data. The presence or absence of each PCR amplification product was manually scored as 1 or 0 respectively and the resulting presence/absence data matrix was analyzed. Genetic diversity parameters were then estimated. Cluster analysis and Analysis of molecular variance (AMOVA) were also. Mantel test was conducted for correlation between morphological and genotypic data.
Results
Morphological characterization
The qualitative morphological traits (Table 1) of the 66 pumpkin varieties exhibited high coefficient of variance with a mean of 52.84% that ranged from 18.69% to 90.67%. The largest variation coefficient was 90.67% (for fruit ribbing), followed by 86.67% (fruit shape). The quantitative morphology traits (Table 2) had the mean coefficient of variation of 20.39%, with a range of 1.06% to 39.25%.
Principal component analysis
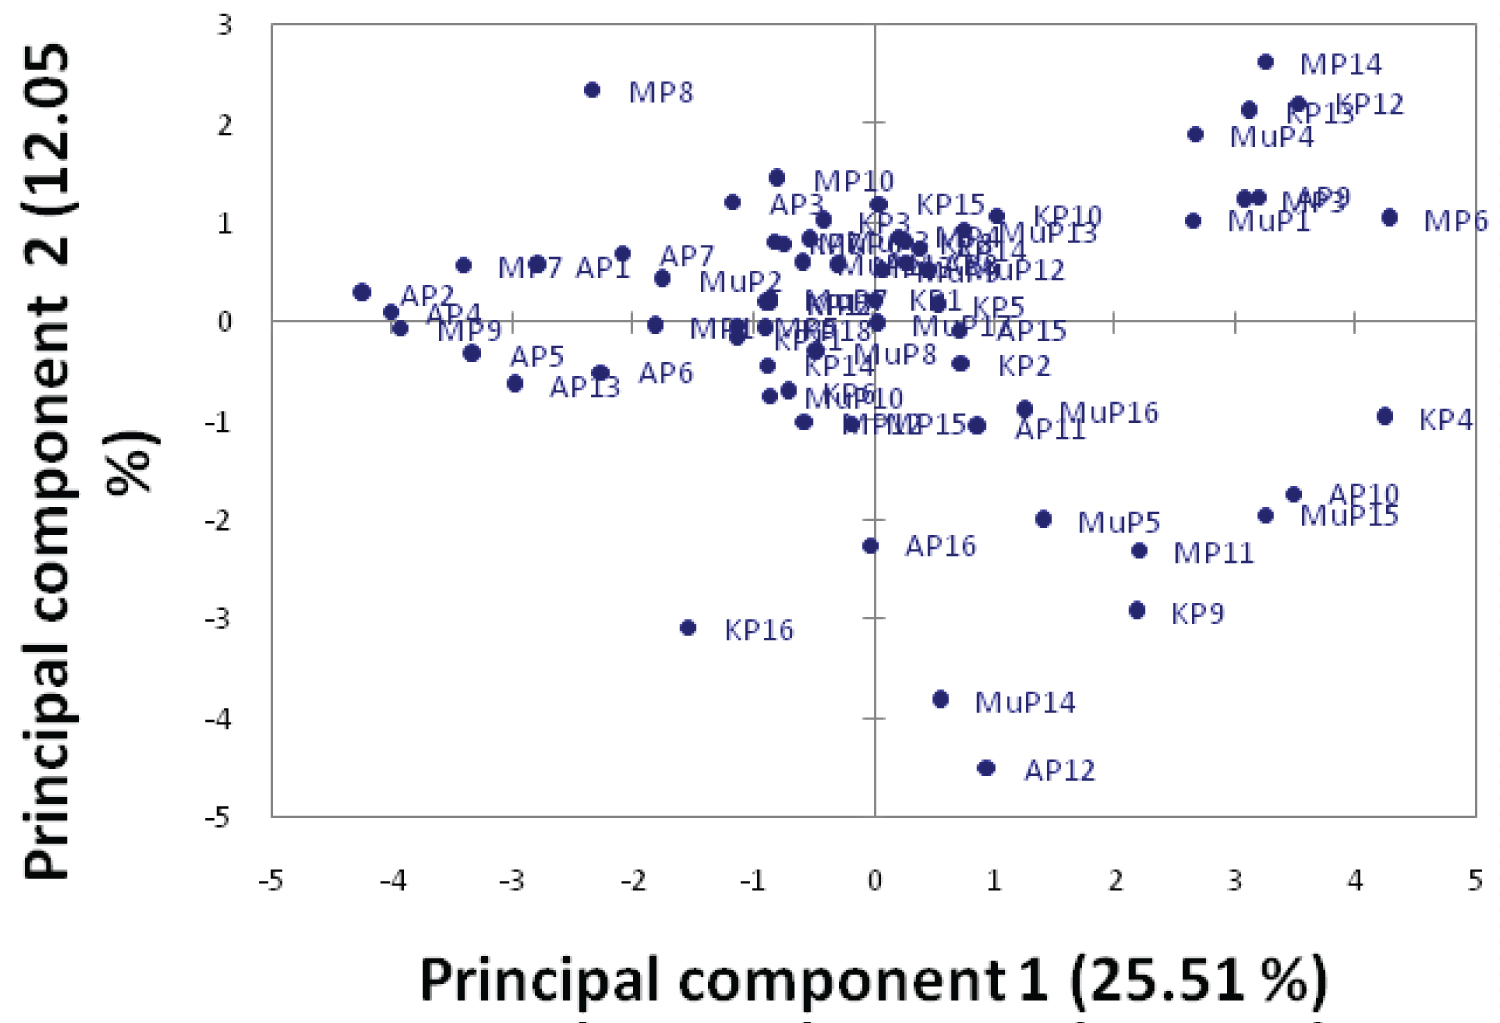
The characters with Eigen values greater than one were reduced to 6 PCs (Table 3) and these explained 70.54% of the total variation. The first four PC accounted for more than half of the variation. The first PC accounted for 25.52% of the variation in the original data and was defined by number of leaves, length of live, leaf length, leaf width and petiole length. The second PC 2 contributed for 12.1% of the residual variation unaccounted for by PC 1, and was defined with leaf colour, seed length and seed hull. The third PC accounted for 10% of the residual variation unaccounted for by PC2; it was defined by seed colour. The fourth PC accounted for 9% of the residual variation unaccounted for by PC 3, and was positively loaded with stem end shape, blossom end shape and fruit shape. The scatter plot (Figure 1) revealed that the scattering of pumpkins was in the four quartiles with majority of the samples from all the districts densely scattering in the right and left upper quartiles. A few pumpkin samples distantly scattered in all the four quartiles away from other samples. This indicates the high amounts of variation present among them.
Morphological relationships among varieties
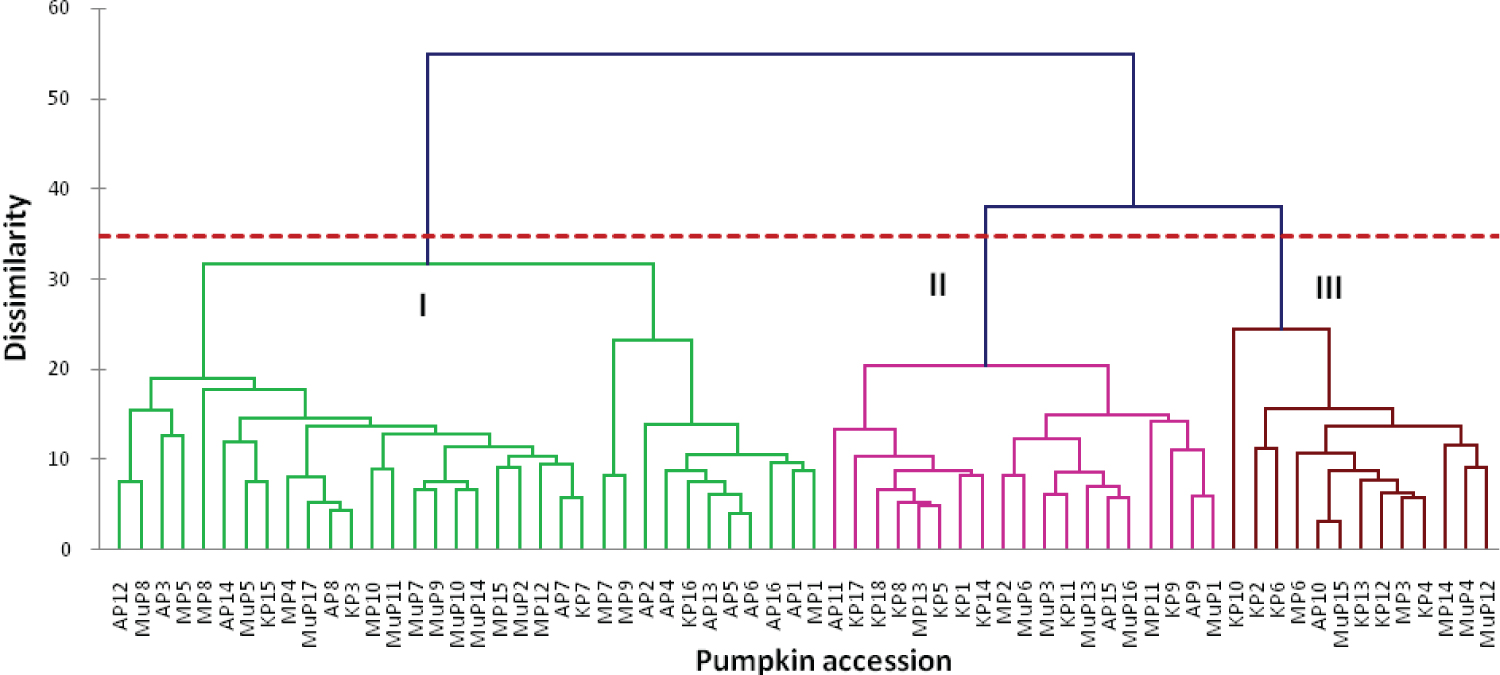
The pumpkin varieties were grouped into three main clusters; I, II and III (Figure 2). Further grouping within the main clusters was observed. Majority of the samples, 34 samples fell into cluster I; followed by cluster II with 19 samples. Cluster III had only 13 samples. Pumpkins varieties from different districts clustered together in the same cluster (Figure 3 and Table 4).
Genetic diversity parameters across the 4 districts.
The pumpkin varieties from Arua had the highest average number of different alleles and also the number of alleles with a frequency of ≥ 5%. Shannon's information index was highest in Mubende at 0.95 and lowest in Mbale at 0.70. The private allele was found in Arua, Mbale and Kabale Populations. Arua population had the highest number of private alleles with 3, followed by Mubende and Kabale population with only 1 private allele each. Mbale population had no private allele. Heterozygosity was highest in Mubendeat 0.54 and lowest in Mbale at 0.40 (Figure 4).
Genetic variance analysis
Analysis of Molecular Variance (AMOVA) (Table 5) revealed that molecular diversity was 95% within individual pumpkin and 5% of the total variation was attributed to differences among varieties within populations in the districts. There were significant variation of varieties within populations in the district P < 0.05, but the variation between population was not significant P > 0.05.
Principle coordinate analysis
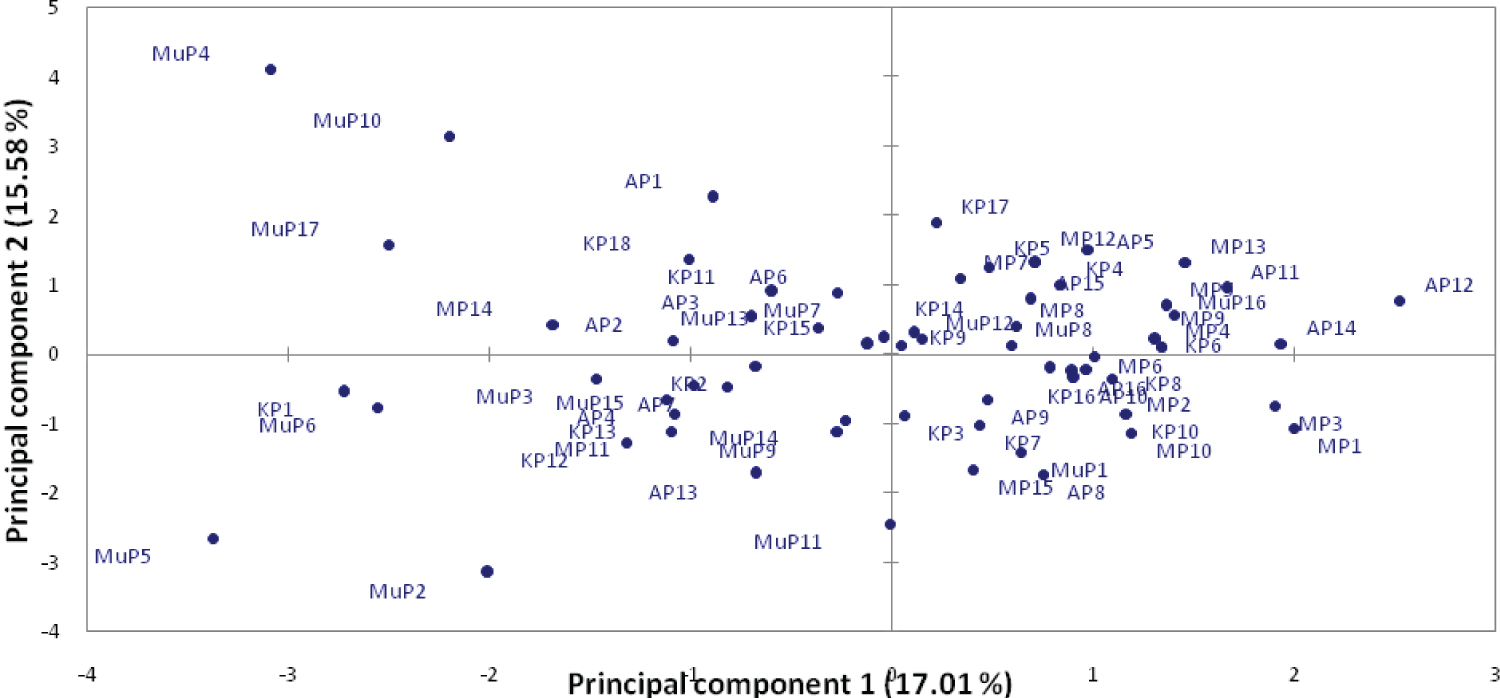
A principal coordinate analysis plot (Figure 5) revealed that the first two principal coordinates accounted for 32.59% of the total variation among accessions within the districts. The first coordinate accounted for 17.01% and the second 15.58% of the total variation (Figure 6). A significant overlap was noted for most of the district with varieties from Mubende being dispersed widely in the plot.
Genetic diversity and relationships among varieties
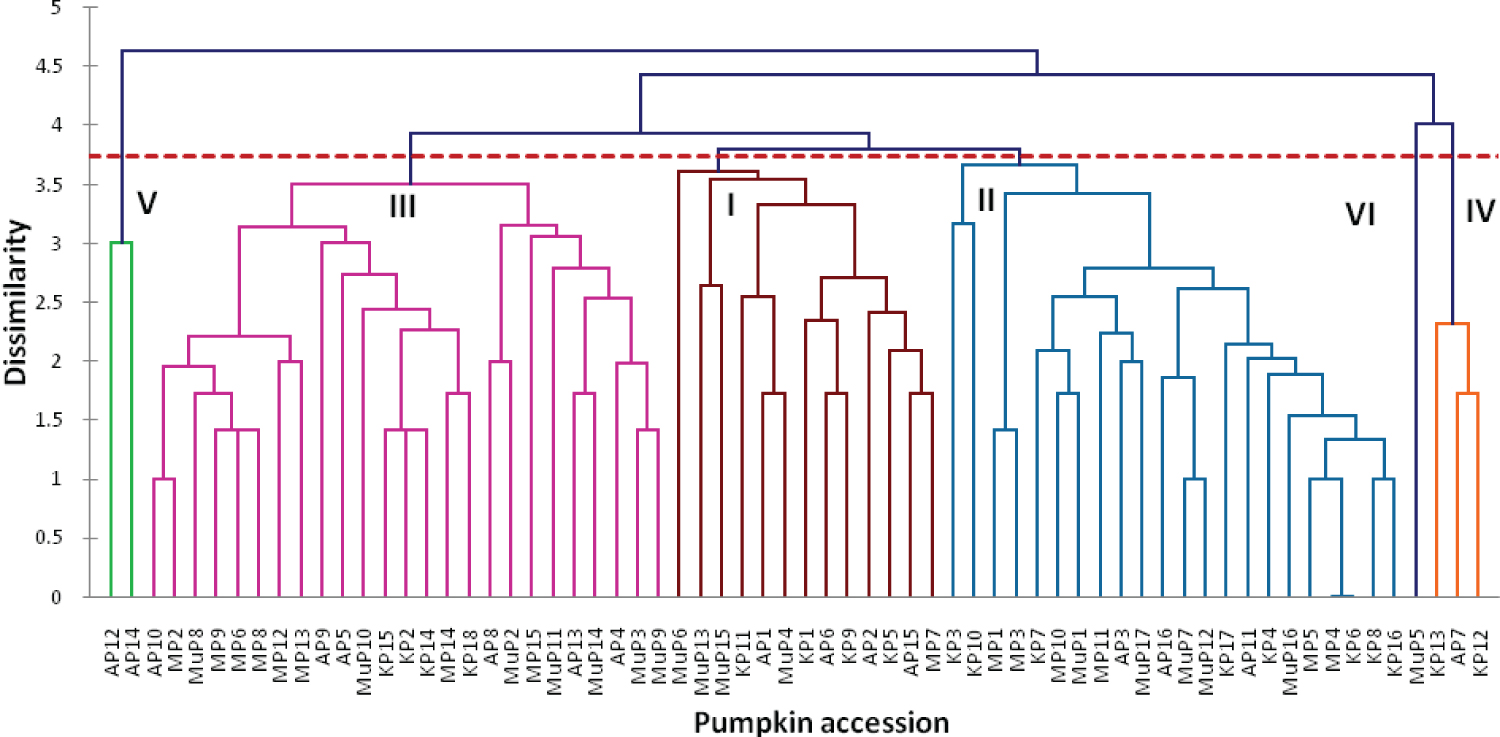
The pumpkin varieties were grouped into six main clusters (Figure 6); I, II, III, IV, V and VI. The Euclidean dissimilarity coefficient ranged from 0-4.6 based on UPGMA. The largest cluster III had 25 varieties, and the second largest 22 varieties while the smallest cluster I, had only one variety. The clustering into the 6 clusters was not based on the varieties' origin but their genetic relationship.
Genetic distance and identity between study populations
The genetic identity (IN) ranged from 0.830 to 0.917, while the genetic distance (D) varied from 0.087 to 0.186 with SSR markers (Table 6). The Mubende populations were the highest in genetic identity (IN = 0.917) and the closest in the genetic distance (D = 0.087). The M bale populations were the lowest in genetic identity (IN = 0.830) and the furthest in genetic distance (D = 0.106).
Relationship between phenotypic and molecular variation of the pumpkins
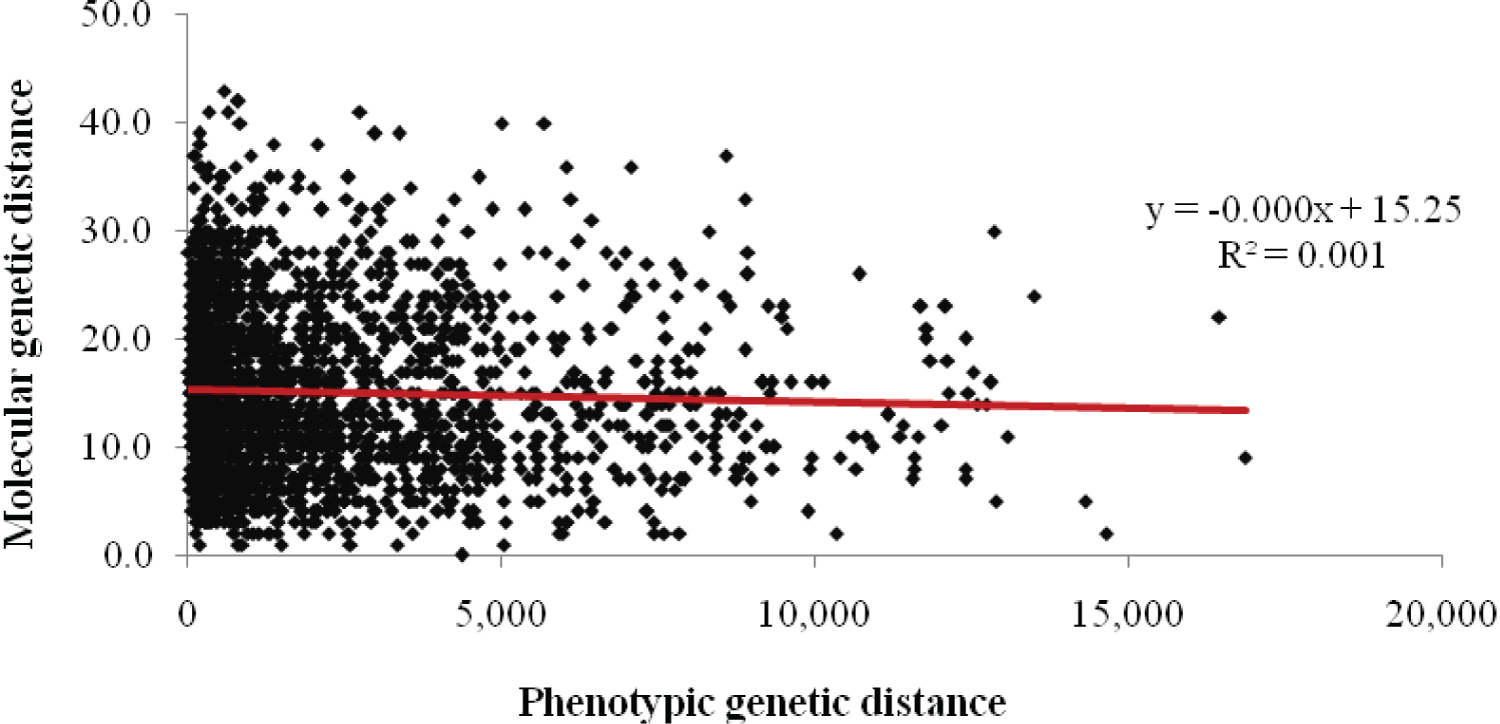
The correlation value was 0.0013 (Figure 7). The results revealed that there that there is no correlation between the phenotypic and genotypic methods used.
Discussion
Although pumpkins have been cultivated in Uganda for a long time, their genetic diversity has not been properly examined. This has greatly affected their utilization in the breeding and conservation programs. In this study, the genetic diversity of pumpkins in Uganda was investigated using morphological features and Simple Sequence Repeats markers.
The 16 morphological traits revealed phenotypic diversity among pumpkins in Uganda (Table 1 and Table 2). The quantitative traits such as seed width and length revealed higher coefficient of variation (Table 2). Similar results were revealed by Adeyemo and Tijani, [19] and [20] among pumpkins in Nigeria and China respectively. The principle component analysis (Table 3) showed that there is morphological diversity among pumpkins from Uganda. The characters that revealed greater percentage of the total variation included number of leaves at 6 weeks, length of vine at 6 weeks, leaf length, leaf width and petiole length, leaf colour, seed length and seed hull. Studies by [21] and [22] also observed similar characters. The results of the PCA scatter plot (Figure 1) suggest that majority of pumpkin populations in Uganda's districts are morphologically similar with some degree of variation among them. This is in tandem with those of studies by [23] and [22]. The exchange of pumpkin seeds among farmers in Uganda could be responsible for the similarity of pumpkins varieties in Uganda's distticts. Cluster analysis (Figure 2) grouped the pumpkin varieties into three clusters with pumpkin varieties from one appearing in different clusters based on their morphological dissimilarity. Pumpkin varieties from Mubende appeared in all the three clusters suggesting highest diversity among them. Similar results were revealed by studies by [24] and [23] which grouped pumpkin samples from different locations in the same clusters and sub clusters. The high morphological diversity among pumpkin varieties observed can be attributed to many exotic cultivars introduced by farmers. Introduction of dissimilar or closely related species by farmers increase gene flow through exchange of genes [25]. Farmers' selections and the ever changing conditions of the environment in the areas where pumpkins were collected [19] also contribute to the high morphological diversity.
The genetic diversity analysis of pumpkins in Uganda was done using ten microsatellite primer pairs. The percentage polymorphic alleles (Table 4) varied from 50% to 100% and an average of 79.47% indicating high genetic diversity among pumpkins varieties in Uganda. The mean diversity index (H = 0.48) and Shannon's information index (I = 0.84) (Figure 4) as revealed by SSR markers indicated high genetic diversity among the pumpkin varieties studied. These results are in tandem with results by Ntuli, et al. [22] among Cucurbitapepo landraces in Kwa Zulu Natal. Higher average number of different alleles and Number of different alleles with a frequency of ≥ 5% in Arua and Mubende districts indicate high genetic variation within pumpkin varieties within these districts. The high number and frequency of different alleles contributes to the variation, survival and reproduction [26]. The number of effective alleles was less than the actual number of alleles in all districts varieties which suggests unequal allele frequencies and large variations. Private alleles were found in Arua, Mubende and Kabale pumpkin varieties with Arua showing the highest number of private alleles. Private alleles present a good source of genetic variability [27] with genetic distinctiveness measured as the number of private (unique) alleles [28]. Arua population varieties were, therefore, the most genetically distinct and variable in the current study.
The analysis of molecular variance (AMOVA) (Table 5) showed high levels of genetic variation within populations (95%) and very low levels of genetic variation among populations (5%). These results revealed the existence of the genetic variation within pumpkin varieties and are in tandem with results revealed by [29] among pumpkin accessions from Slovenia. Pumpkins are allogamous and monoecious; therefore, they are cross pollinated which increases variability among them. These results also indicate that the geographical contribution to variation in pumpkins is lower than the contribution of individual genotypes within the population. Gene flow among pumpkin populations in Uganda could be the cause of low levels of genetic variations among population in the districts. Kimani, et al. [27] attributed low variation among regions to the traditional farming systems with the transit of pumpkin germplasm via human migration and seed trade within districts. The principal coordinate analysis scatter plot (Figure 5) revealed a substantial overlap between pumpkin populations in the different districts of Arua, Mbale and Kabale in the coordinate space with varieties from Mubende scattering away from the other districts. This suggests a close genetic similarity between the pumpkin varieties that overlapped. The pumpkin varieties from Mubende scattered away from those of other district indicating they aren't closely related to them. Cluster analysis (Figure 6) revealed high level of dissimilarity among pumpkin varieties grouping them into 6 clusters. Four clusters I, II, III and IV had a mixture of individuals from all populations grouped together. Cluster V had only individuals from Arua and Cluster VI had only one individual from Mubende. The mixture of individuals from different populations in the same cluster, suggests that the individuals have the same origin or they are from multiple introductions from several origins [30]. The results also indicate that there is no significant population differentiation among pumpkin varieties from different locations in Uganda because of gene flow from one location to another. The range of genetic identity and genetic distance from 0.830 to 0.917, and 0.087 to 0.186 respectively indicate that there is variability among pumpkin varieties in Uganda (Table 6). Pumpkin varieties originating from the same district were the most genetic similar with close genetic distance. Similar results were reported among Cucurbitapepo landraces cultivars in Kwa Zulu Natal [22] and among Cucurbita moschata germplasm accessions from Mesoamerica [31]. The maintenance of the production of landraces by farmers may be responsible for the genetic similarities and short distances of the pumpkins varieties in each district. The short genetic distance observed reveal the close relatedness of the different pumpkin populations in Uganda and are consistent with AMOVA results (Table 5). The short genetic distances indicate that of genetic material exchange can easily occur among pumpkin populations. Evidence of gene flow and cross-breeding between several Cucurbita species has been reported by several authors [32,33].
Mantel's test R = 0.0013 (Figure 7) revealed there is limited correlation between the results obtained using morphological features and the genetic markers in the current study. This implies that morphological similarities of pumpkin varieties are not a result of genetic similarity. The lack of correlation between molecular and morphological data is due the independent nature of molecular and morphological variations [34]. The interaction between the genotype and the environment is also responsible for the absence of correlation between molecular and quantitative data as revealed by the morphological markers and SSR markers. The morphological characteristics are affected by both innate factors and environmental factors; whereas differences in DNA sequence revealed by SSR molecular markers are not influenced by the ever changing environmental conditions [35]. In the current study on the genetic diversity of pumpkins in Uganda using phenotypic traits and SSR marker, the results indicate that the molecular markers and morphological marker are complementary to each other. The current study results also indicate that molecular and morphological traits cannot be used interchangeably.
Conclusion
Both morphological and simple sequence repeats markers revealed high diversity among the pumpkin varieties in Uganda. There is limited correlation between morphological and simple sequence repeats data. Morphological traits and simple sequence repeats markers, therefore, cannot be used interchangeably to study the genetic diversity of pumpkins in Uganda, but they complement each other.
References
- Caili F, Huan S, Quanhong L (2006) A review on pharmacological activities and utilization technologies of pumpkin. Plant Foods Hum Nutr 61: 73-80.
- Murkovic, Mülleder U, Neunteufl H, et al. (2002) Carotenoid content in different varieties of pumpkins. J Food Compos Anal 15: 633-638.
- Elella FA, Mourad R (2015) Anticancer and anti-oxidant potentials of ethanolic extracts of Phoenix dactylifera, Musa acuminata, and Cucurbita maxima. Research Journal of Pharmaceutical, biol Chem Sci 6: 710-720.
- Muruganantham, Vinodh S, Arun CS, et al. (2016) Application of interpretive structural modelling for analysing barriers to total quality management practices implementation in the automotive sector. Total Quality Management & Business Excellence 29: 524-545.
- Richard N (2016) Socio-economic factors influencing smallholder pumpkin production, consumption and marketing in Eastern and Central Kenya regions; A thesis submitted in partial fulfillment of the requirements for Award of the degree of Master of Science (Agribusiness Management and Trade) in the School of Agriculture and Enterprise Development of Kenyatta University 25.
- Aruah BC, Uguru MI, Oyiga BC (2010) Variations among some Nigerian Cucurbita landraces. Afr J Plant Sci 4: 374-386.
- Baye (2012) Managerial economics & business strategy by Baye (2012-01-01). Managerial Economics & Business Strategy.
- Collard BCY, Jahufer MZZ, Brouwer JB, et al. (2005) An introduction to markers, quantitative trait loci (QTL) mapping and marker assisted selection for crop improvement. The basic concepts. Euphytica 142: 169-196.
- El-Domyati M, El-Ammawi TS, Medhat W, et al. (2011) Radiofrequency facial rejuvenation: evidence-based effect. J Am Acad Dermatol 64: 524-535.
- Nakazibwe I, Wangalwa R, Apio E, et al. (2019) Local knowledge of pumpkin production, performance and utilization systems for value addition avenues from selected agro-ecological zones of Uganda. Afr J Agric Res 14: 1509-1519.
- Echessa (2011) Variation of plant macronutrients in maize stover of maize 2 varieties grown in western Kenya. International Research Journal of Pure and Applied Chemistry.
- Jjemba (2020) Enrichment planting to supplement farmer-managed natural regeneration in biodiversity restoration on farmlands of Gogonya Village, Mubende District, Uganda. The Rufford Fundation.
- Arthofer W, Heussler C, Krapf P, et al. (2018) Identifying the minimum number of microsatellite loci needed to assess population genetic structure: A case study in fly culturing. Fly 12: 13-22.
- ECPGR (2008) Minimum descriptors for Cucurbita spp., cucumber, melon and watermelon. European Cooperative Program for Plant Genetic Resources 1-4.
- Mace ES, Buhariwalla HK, Crouch JH (2003) A high-throughput DNA extraction protocol for tropical molecular breeding programs. Plant Mol Biol Rep 21: 459a-459h.
- Watcharawongpaiboon N, Chunwongse J (2007) Development of microsatellite markers from an enriched genomic library of pumpkin (Cucurbita moschata L.) Journal of Science and Technology 29: 1217-1223.
- Priori A, Ferrucci R, Fumagalli M, et al. (2012) Transcranial direct current stimulation (tDCS) and language. J Neurol Neurosurg Psychiatry 84: 832-842.
- Peakall R, Smouse PE (2012) Genetic analysis in excel. Population genetic software for teaching and research. GenAlEx 6.5: Bioinformatics 28: 2537-2539.
- Adeyemo O, Tijani HA (2018) Fluted pumpkin [Telfariaoccidentalis (Hook F.)]: Genetic diversity and landrace identification using phenotypic traits and RAPD markers. Ife Journal of Science 20: 391-402.
- Wang W, Xu Y, Gao R, et al. (2020) Detection of SARS-CoV-2 in different types of clinical specimens. JAMA 323: 1843-1844.
- Kiramana JK, Isutsa DK (2017) First detailed morphological characterisation of qualitative traits of extensive naturalized pumpkin germplasm in Kenya.
- Ntuli NR, Tongoona PB, Zobolo AM (2015) Genetic diversity in Cucurbita pepo landraces revealed by RAPD and SSR Markers. Sci Hortic 189: 192-200.
- Nyabera LA, Runo SM, Nzuki IW, et al. (2019) Phenotypic diversity of pumpkins from Western Kenya using fruit morphological characters. Afr Crop Sci J 27: 427-435.
- Liu JP, Song M, Horton RM, et al. (2013) Reducing spread in climate model projections of a September ice-free Arctic. Proc Natl Acad Sci 110: 12571-12576.
- Kirimi JK, Isutsa DK (2018) Genetic diversity of pumpkin accessions in kenya revealed using morphological characters, diversity index, catpca and factor analysis. Int J Sci Res 3: 157-179.
- Kiramana JK, Isutsa DK (2018) First detailed morphological characterisation of qualitative traits of extensive naturalized pumpkin germplasm in Kenya”, International Journal of Development and Sustainability 6: 500-525.
- Kimani PM, Wachira F, Cheruiyot EK, et al. (2014) Genetic diversity of African sorghum (Sorghum bicolor L. Moench) accessions based on microsatellite markers. Austr J Crop Sci 8: 171- 177.
- Kalinowski ST (2004) Counting alleles with rarefaction: Private alleles and hierarchical sampling designs. Conservation Genetics 5: 539-543.
- Murovec J (2015) Phenotypic and genetic diversity in pumpkin accessions with mutated seed coats. Hort Science Journal 50: 211-217.
- Kamau J (2016) Effects of internal control practices on financial performance of small and medium enterprises in nairobi county.
- Barboza M, Pinzon J, Wickramasinghe S, et al. (2012) Glycosylation of human milk lactoferrin exhibits dynamic changes during early lactation enhancing its role in pathogenic bacteria-host interactions. Mol Cell Proteomics 11: M111.015248.
- Montes Hernandez S, Eguiarte LE (2002) Genetic structure and indirect estimates of gene flow in three taxa of Cucurbita (Cucurbitaceae) in western Mexico. Am J Bot 89: 1156-1163.
- Cuevas Marrero H, Wessel Beaver L (2008) Morphological and RAPD marker evidence of gene flow in open-pollinated populations of Cucurbita moschatainterplanted with C. argyrosperma. Cucurbitaceae. Proceedings of the IXth EUCARPIA Meeting on Genetics and Breeding of Cucurbitaceae (PitratM, ed), INRA, Avignon (France): 347-352.
- Karuri HW, Ateka EM, Amata R, et al. (2010) Evaluating diversity among Kenyan sweet potato genotypes using morphological and SSR markers. International Journal of Agriculture and Biology 12: 33-38.
- Rabbani MA, Masood MS, Shinwari ZK, et al. (2010) Genetic analysis of asmati and non-basmati Pakistani rice (Oryza sativa l.) cultivars using Microsatellite markers. Pak J Bot 42: 2551-2564.
Corresponding Author
Bwesigye Thaddeus, School of Biosecurity, Biotechnolgy and Laboratory Sceinces, Makerere University, P.O Box 7062, Kampala, Uganda
Copyright
© 2022 Anne K, et al. This is an open-access article distributed under the terms of the Creative Commons Attribution License, which permits unrestricted use, distribution, and reproduction in any medium, provided the original author and source are credited.

