Survival Analysis of Sputum Conversion Time among Patients with Drug Resistant Tuberculosis in Kenya
Abstract
Background: Drug-resistant tuberculosis (DR-TB) is a form of antimicrobial resistance Mycobacterium tuberculosis that is difficult and costly to treat. It is caused by TB bacteria resistance to at least one of the first-line existing TB medications, resulting in fewer treatment options and increasing mortality rates. In 2019, close to 500,000 people developed DR-TB, and 182,000 died globally. Less than 60% of DR-TB patients who started on medication were completed, mostly due to high mortality and lost follow-up. This study aimed to determine when people who have been infected with drug-resistant tuberculosis and started on treatment convert from being sputum positive to sputum negative, which is a critical point to curtail the infectivity of the disease to the general population.
Methods: The analysis was through a retrospective review of patients captured through electronic medical records (TIBU) of Kenya National Tuberculosis and Leprosy Program from 2014 to 2019, having a two-year follow-up for every subject enrolled. The total number of patients included in the study was 2674, entailing all patients who tested positive for tuberculosis drug resistance. We had age, gender, country, sector, registration, group, the resistance pattern, intensive phase regimen, modification of intensive phase, year, BMI, and a quarter as our variables for analysis. We considered Gender, County, Resistance Pattern, Age category, and BMI at enrollment for the conversion time. The Log Rank test was used to compare the survival distribution of the included variables. The Cox Proportional Hazard model was used to analyze Year, Quarter, Sector Model of care, Intensive regimen, Modification of Intensive regimen, and County. The proportional hazard assumptions and the overall model fit were assessed. Parametric survival models were included in three levels of factors associated with patients, factors associated with resistance, and institutional factors. We evaluated the conversion variations where we used the exponential and Weibull distributions and best-fitting model through the Akaike's information criterion.
Results: Of the patients enrolled for treatment, 50% took eight months to have their sputum conversions, whereas only 25% took four months to record conversions. Gender had no influence on conversion time, where 50% of both genders had a median time of eight months to get converted. The resistance pattern registered a median time of eight months, with Rifampicin resistance taking the least time of seven months. Mono-Resistance and Pre-XDR not having converted by standard, intensive observation period - (9-Months). Most patients were between age 20 and 49 years in the age category, with a median conversion time of 9 months. BMI, the underweight took nine months to convert, normal was eight months, overweight was 7 Months, and Obese was 6 Months.
Conclusion: In general, the median time for the most patients to convert from being sputum positive to sputum negative was eight months, with the earliest converters being recorded as being four months but was being influenced by different factors like the type of resistance and drugs that were given as the first line ant-TB with also a modification of his first-line medication. More adherences should be emphasized on the young and middle-aged population who are taking more time to have their sputum convert hence posing a more significant risk to the enormous population by spreading the resistant disease to them.
Keywords
Mycobacterium tuberculosis, Pre XDR, TIBU, DR TB, Log rank test, Kaplan meier estimator, Cox proportional hazard model, Residual analysis
Introduction
Tuberculosis (TB) is an infectious disease that is a significant cause of ill health, one of the top 10 causes of death worldwide, and the leading cause of death from a single infectious agent (ranking above HIV/AIDS). It is caused by the bacillus Mycobacterium tuberculosis, which spreads when people sick with TB expel bacteria into the air, for example, by coughing. It typically affects the lungs (pulmonary TB) but can also affect other sites (extrapulmonary TB) [1]. Approximately 20% of TB cases globally are estimated to be resistant to at least one of the first- or second-line anti-TB drugs, and 5% are resistant to both isoniazid and rifampicin, the most powerful and commonly used antibiotics in first-line treatment. Of the estimated 480,000 multidrug-resistant (MDR) TB cases, approximately 10% are either extensively drug-resistant (XDR)-with additional resistance to second-line drugs-or drug-resistant. Treatment of Tuberculosis (TB), regardless of the results of drug susceptibility testing (DST), focuses on curing the individual patient and minimizing the transmission of Mycobacterium tuberculosis to other persons.
Thus, effective treatment of TB has benefits for both the individual patient and the community in which the patient resides. However, unique complexities need to be addressed to successfully treat disease resulting from drug-resistant M. tuberculosis isolates compared with the treatment of drug-susceptible TB disease, including additional molecular and phenotypic diagnostic tests to determine drug susceptibility; the use of second-line drugs, which have toxicities that increase harms that must be balanced with their benefits; and prolonged treatment durations [2]. Africa is home to over 1 billion people. It is disproportionately affected by tuberculosis with 2.6 million of the 10.4 million global tuberculosis cases, 3 making the continent a key geographical area for health interventions [3]. Drug-resistant and multi-drug resistant (MDR) TB is characterized by mortality, inadequate treatment regimens, and delayed diagnosis. Implementing strategies such as the Directly Observed Treatment Short Course (DOTS) is essential for diagnosis and patient treatment to avoid creating and spreading resistant strains in the community [3]. However, some of the current strategies have limitations. For instance, sputum smear microscopy is helpful to detect the primary sources of infection but only helps diagnose about half of all TB cases, culture is more sensitive and takes a longer time to produce results, and 6 to 8 months is still a long time to maintain a patient on regular treatment [4].
Material and Methods
Ethical statement
The University of Nairobi and Kenyatta National Hospital Ethics review board approved the study with additional approval sought from the Kenya National Tuberculosis and Leprosy Program to extract patients' data from their Electronic Medical Records. No patient informed consent was needed because this was a secondary data study.
Data
It was a retrospective study of patients enrolled for drug-resistant tuberculosis treatment between 2014 to 2019. Patients included must have tested positive for any Resistant Tuberculosis. Data were abstracted from the NTLP electronic medical records system (TIBU), an android-based application running on handheld devices and stores data online and accessible via the internet. Currently, TIBU is being used by over 350 county and sub-county coordinators country. The system has inbuilt validation checks and provides real-time TB data at all health system levels. Once a patient diagnosis is made at the facility level, treatment is initiated, and patient details like age, sex, type of TB, treatment outcome, date of start of treatment, HIV status, sputum smear results, treatment outcome, and date of treatment outcome among other variables are documented in the facility register. Sub-County TB and Leprosy Coordinators (SCTLCs) then transcribe these patient details from the TB facility register to tablet computers that run on the Android operating system. The case-based data are transmitted directly to the national database (TIBU) via the mobile network.
The data were exported from the TIBU system in the analyzable format in an Excel sheet, then imported to STATA version 13 software for data cleaning and analysis. The analysis was based on all cases of drug-resistant tuberculosis that had a treatment outcome period of intensive phase.
Statistical methods for survival data
Descriptive statistics, exploratory data analysis techniques, and confirmatory data analysis techniques were used to detect any associations of sputum conversion among patients enrolled for drug-resistant tuberculosis treatment. patients were analyzed by broadly classifying them of variables that could be relatable, and thus we categorized variables into three groups; factors relating directly to the patient- Age, BMI, registration, group, intensive phase regimen, modification of intensive phase.) Factors associated with resistance- LPA-Rif, LPA-H, DST-R, DST-H, DST-Z, DST-E.C) factors unrelated to patients or resistance- year of registration, quarter of enrollment, sector treatment, model of care. For each category of patient variables, descriptive baseline statistics consist of sample size (n), percentage, mean, standard deviation, median, and range. The three groups of patient classification present summary tables.
For sputum conversion time, Kaplan Meier (KM) Estimator was used to compare the three groups and the associated factors to evaluate the conversion patterns relating to specific aspects. The Cox proportional hazard (PH) model was used to investigate the effect of the group's specific explanatory variables on time to sputum conversions. The log-rank test was used to compare survival distributions between the group's variables where estimation and inference was made without assuming any distribution for sputum conversion time.
Kaplan-Meier estimator of the survival functions
The K-M estimator is a nonparametric method for estimating a survival function, S(t) from lifetime data. The product of estimated survival probabilities resulting from Equation 1 forms the estimator.
where t1 < t2 < ... < tk are the rank-ordered recorded times among independent subjects, denoted as (t1,C1), i = 1,2...n given that the ith subject can survive before time ti But at the time ti this subject experiences an event of interest and ci is a censoring indicator variable with the value of 1 for the observed event for the ith subject; otherwise, 0; ni n is the number of subjects at risk just before ti; di is the number of subjects that experience the event at ti.
Cox proportional hazards regression model
A Cox PH regression model is used to quantify the effects of explanatory variables on the hazard of drug-resistant tuberculosis. Cox proportional hazards regression models are widely used to analyze time-to-event data [5]. the Cox proportional-hazards regression model (introduced in a seminal paper by Cox, 1972), a broadly applicable and the most widely used method of survival analysis [6]. This form of the regression model proposed by Cox, which under this model, the hazard function, λ for the ith subject is expressed as the product of the two function as given in equation two below (Equation 2):
Where λ0 is a baseline hazard function characterizing the way hazard function changes as a function of time and exp (Xi' β). Under the Cox PH model, time t does not have any distributional constraints, and the model is referred to as the PH model because the hazard functions are multiplicatively related. That is, their ratios are constant over time. The Cox model parameters are estimated from the partial likelihood function as shown in below (Equation 3).
Where ci is a censoring indicator variable with the value of 1 for an observed event for the ith subject; otherwise, 0; R(ti) is the risk set of all individuals with event times greater than or equal to the time ti.
Parametric survival model
A parametric survival model is a structured statistical methodology for exploring the relationship between the survival of a patient, a parametric distribution, and several explanatory variables. Through this, we can estimate the parameters of the distribution. There is an opportunity to boost the parametric survival model through a selection of variables that are to be part of the model and can be achieved by either forward selection or backward selection. The goodness of fit coefficients table displays a series of statistics for the independent model (corresponding to the case where there is no impact of covariates, beta = 0) and the adjusted model. The parameter estimate, corresponding standard deviation, Wald's Chi2, the corresponding p value, and the confidence interval are displayed for each model variable. The predictions and residuals table shows, for each observation, the time variable, the censoring variable, the value of the residuals, the estimated cumulative survival distribution, the empirical cumulative distribution function, and the hazard function.
The exponential survival model
The distribution associated with the exponential PH model is one parameter (rate) distribution that will assume that the rate is constant over time where the hazard function is as below.
Where λ the rate parameter, then r the resultant Exponential PH models.
Where the survival function in this case is and the density function of T becomes.
The likelihood function was expressed as;
Weibull survival model
Weibull model is a flexible model that allows for covariates of the survival times. If distributional assumptions are not met or cannot be verified, researchers may turn to the semi-parametric Cox proportional hazards model. This model also allows for covariates of survival times but with less restrictive assumptions [7]. The Weibull distribution contains two parameters, i.e., scale and shape parameter; hence it yields a more flexible baseline hazard than the exponential and includes exponential as a particular case. The shape parameter controls the shape of the hazard, allowing it to either decrease or increase sequentially over time.
The baseline hazard function h0(t).
The Weibull PH model was formulated as shown below;
Where λ is the scale parameter and α is the shape parameter, both λ, α > 0, if α = 1 then the above Weibull model becomes Exponential model and λ was interpreted as a rate parameter. If α > 1, then the hazards increase over time and if α < 1, the hazards decrease over time, The Weibull survival function was expressed as.
The density function for T is;
The likelihood function will be expressed as;
Model development
For this study, survival time for sputum conversion is described in months given that patients, monitoring is always done monthly after initiating the drug-resistant treatment. After two consecutive negative sputum tests, one is declared as having converted from sputum positive to sputum negative. The patient changes to the continuation phase of the tuberculosis treatment. For our case, we followed the National Tuberculosis and leprosy program criteria of "normal intensive period" to derive our conversion time where from their guideline, they set an average conversion time to be four months to 6 months and bearing in mind the uneven distribution of Kenya's health, demography and poor infrastructure in some part of the country we added our conversion consideration period to be eight months to avoid bias. Patients who did not fall between the four months and eight months were right-censored, and the ones that never reached four months were left-censored because they had not attained the minimum inclusion period of four months required for sputum conversion. For the identity of censorship, the indicator variable was assigned one subject who had achieved the conversion and 0 otherwise. Additionally, the grouping of variables was done in three categories.
1. Patents associated variables - Age, BMI, Registration group, Resistance Pattern, Gender, HIV status, Intensive phase regimen, modification of the intensive phase regimen.
2. Resistance-associated variables are LPA-Rif, LPA-H, DST-Rif, DST-H, DST-Z DST-E.
3. Independent variables - Sector, Model of care, County, Health facility.
Model assessment
Model adequacy examination was done to evaluate if the fitted regression model characterized the data. The most satisfactory model was selected by assessing the smallest value of Akaike Information Criterion (AIC).
The PH assumptions and the overall model fit were investigated based on graphical evidence and hypothesis tests. The parallel nature of the Kaplan-Meier estimated curves for a given variable in a log-log plot was assessed. Scaled Schoenfeld residuals were used to test for the constancy of the coefficients.
The deviance residuals were used to validate the model accuracy and possible outliers. These residuals are a normalizing transform of the martingale residuals and are symmetric about zero when a fitted model is appropriate.
The score residuals were used to assess the influence of each point on the estimated β coefficients. The change in the estimated coefficients of β was computed by dropping an observation. The obtained value was then divided by the standard errors for the components of the estimated coefficient.
All analyses were performed using the STATA statistical software version 13. For all statistical analyses, P < 0.05 was considered statistically significant.
Results
The analysis was based on retrospective data comprising patients enrolled for drug-resistant TB treatment within the devolved county health system in Kenya within all registered centers for DR-TB treatment. The recruitment period was between 2014 to 2019, having a two-year follow-up period. There were 2674 patients enrolled for DR-TB treatment for 2014 to 2019, having 2018 recording the highest cases at 26% of the total patients and 2019 registered the least with 7.3% of the total number. The quarterly enrollments for the year were more in the first quarter where cumulatively first quarter had 29% of the total cases, while a fourth quarter had the least with 21%. The counties' DR-TB enrollments were cutting across the counties, but Nairobi County had the highest cases of DR-TB burden at 14.9%, while Tana-River County had the least with 0.19%. Health-Facilities for the treatment of DR-TB were evenly distributed in the country. However, Nairobi still carried the most considerable proportion of them by 16%, while Ware County had the least amount at 0.18%. The public sector took the most significant proportion at 83% for the treatment sector, while Prisons had the least amount at 1.27%. Treatment models were more at the community level, where we had up to 65% of the total patients enrolled being followed up at the community level.
In comparison, the isolated cases were less than 5%. In registration groups, new cases were the most at 36%, failure of first-line drugs at 26%, relapse at 16%, and transfer in at least 2%. Table 1, Table 2, Table 3, Table 4, Table 5 and Table 6 summarize the resistance pattern, culture, outcome, gene-expert, registration categories, and healthcare sectors variables enrollment patterns for patients diagnosed for the DR-TB.
Kaplan Meier curve estimate
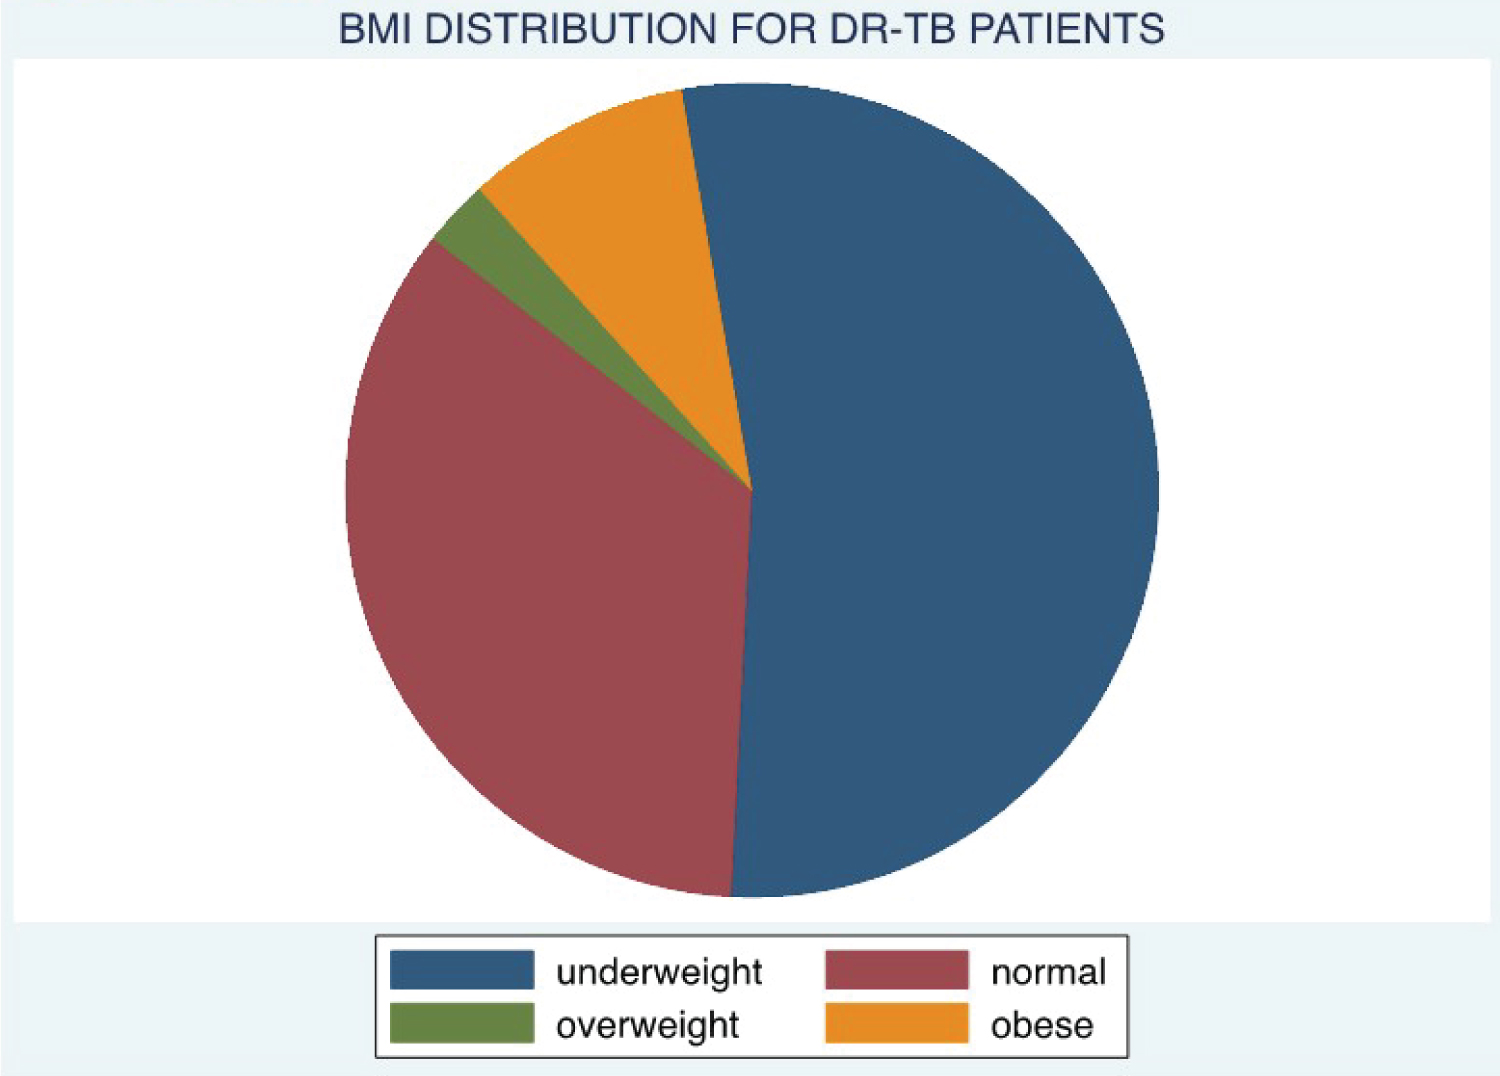
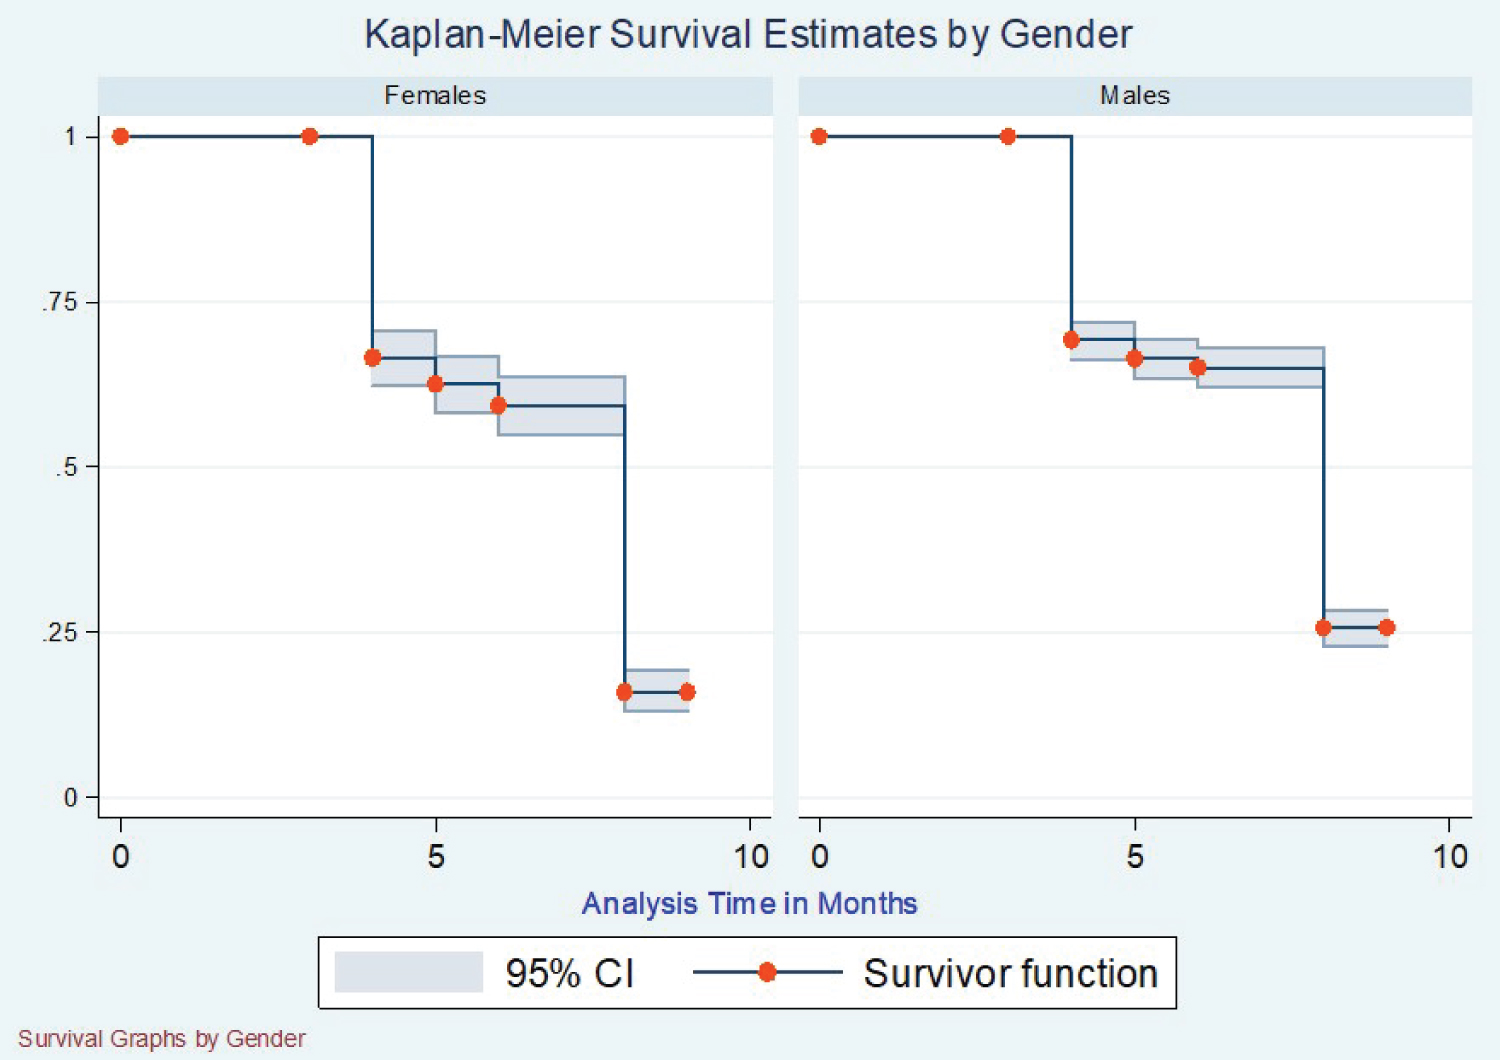
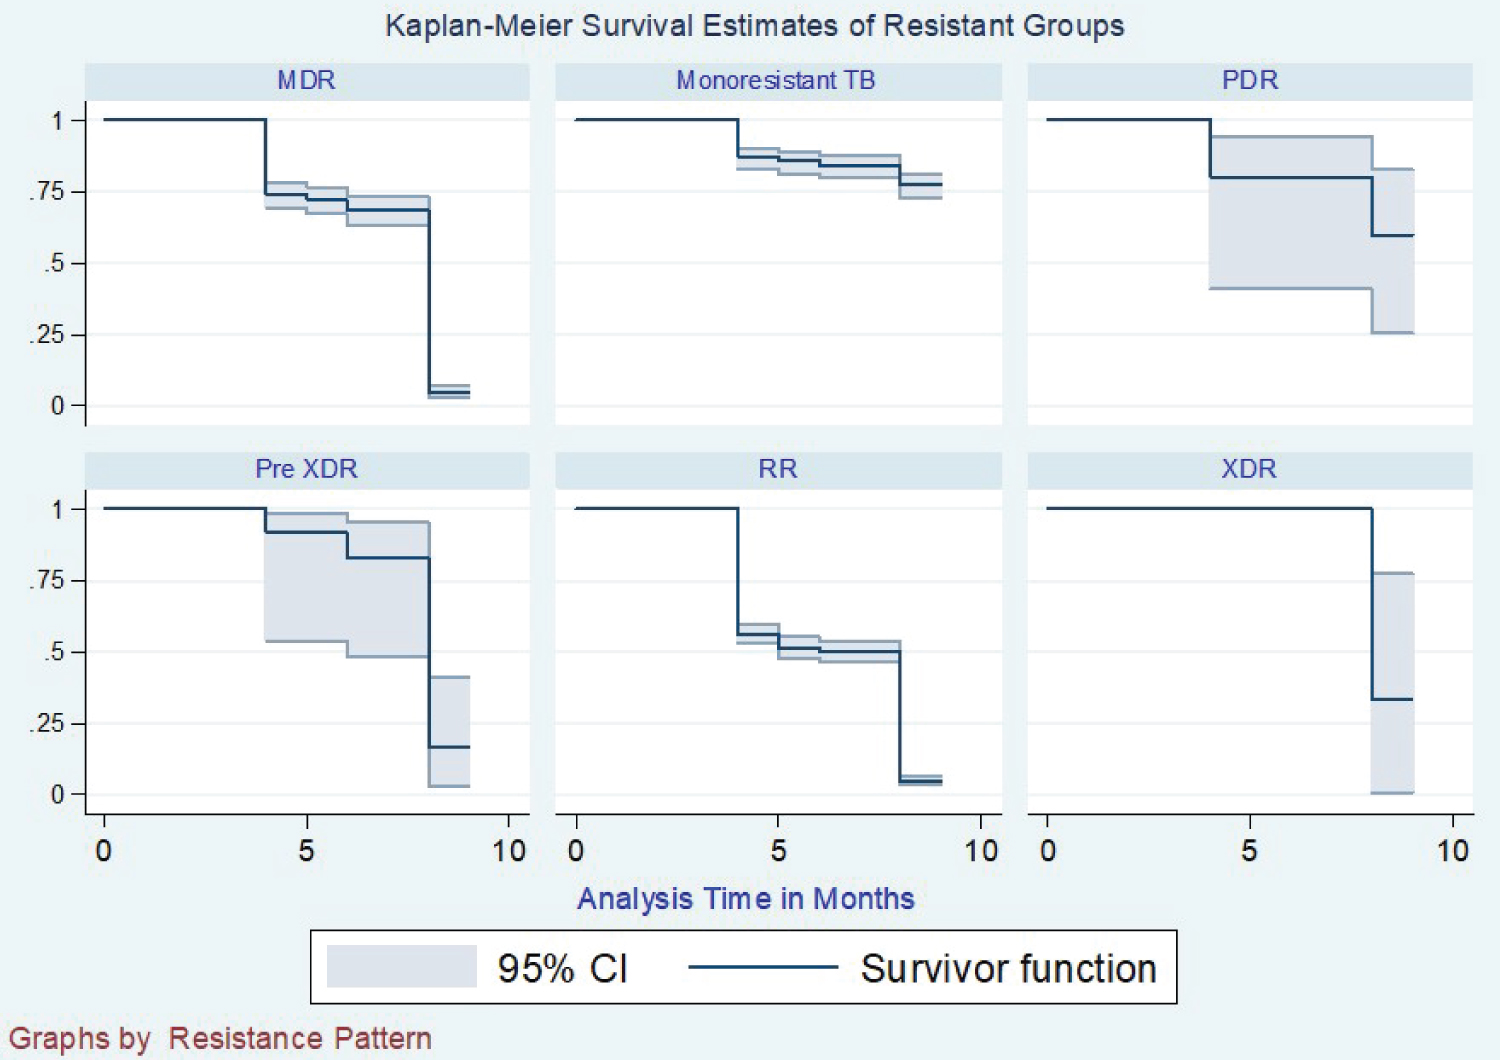
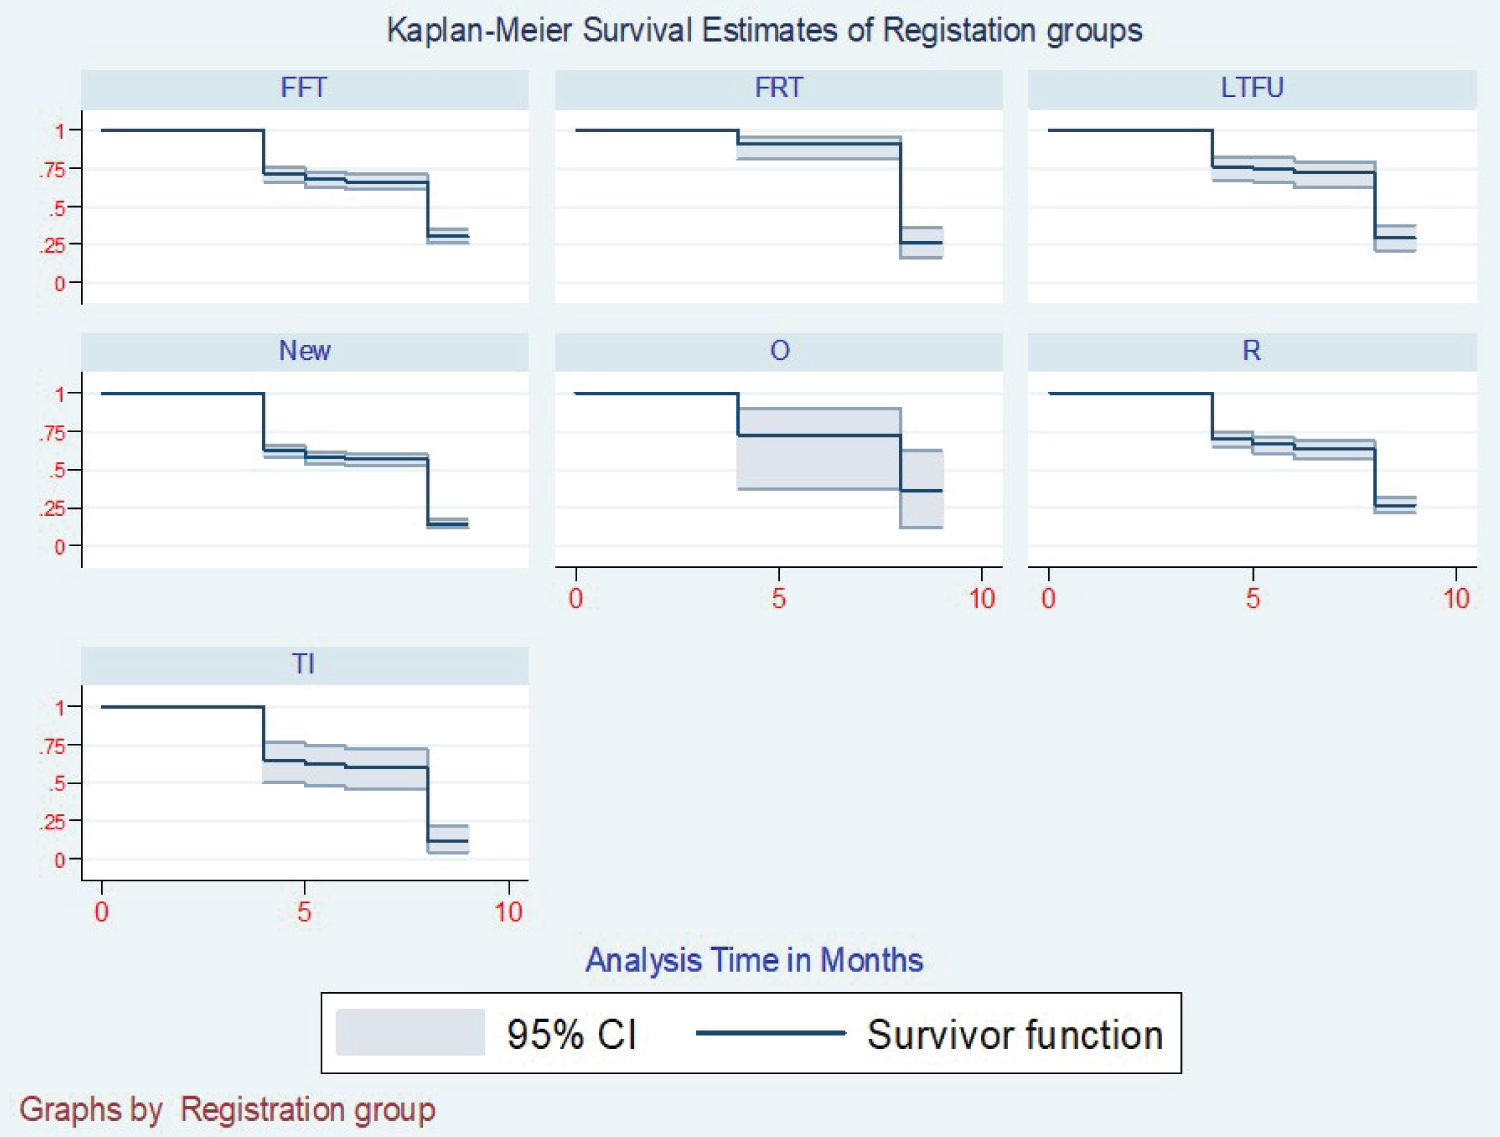
The Kaplan Meier survival curve was fitted to the data for the three-class categories of variables to determine the conversion distribution concerning the specific variable (Figure 1). From this data, we were able to get no significant difference in sputum conversion concerning gender, where 50% of both genders had a median conversion time of 8 months (Figure 2). With the resistance patterns, the resistance had the same median time of conversion of 8 months, but Rifampicicn resistance patients took a median time of 7 months to convert. Still, those who got registration after the failure of category one medication took a median time of 9 months to have converted.
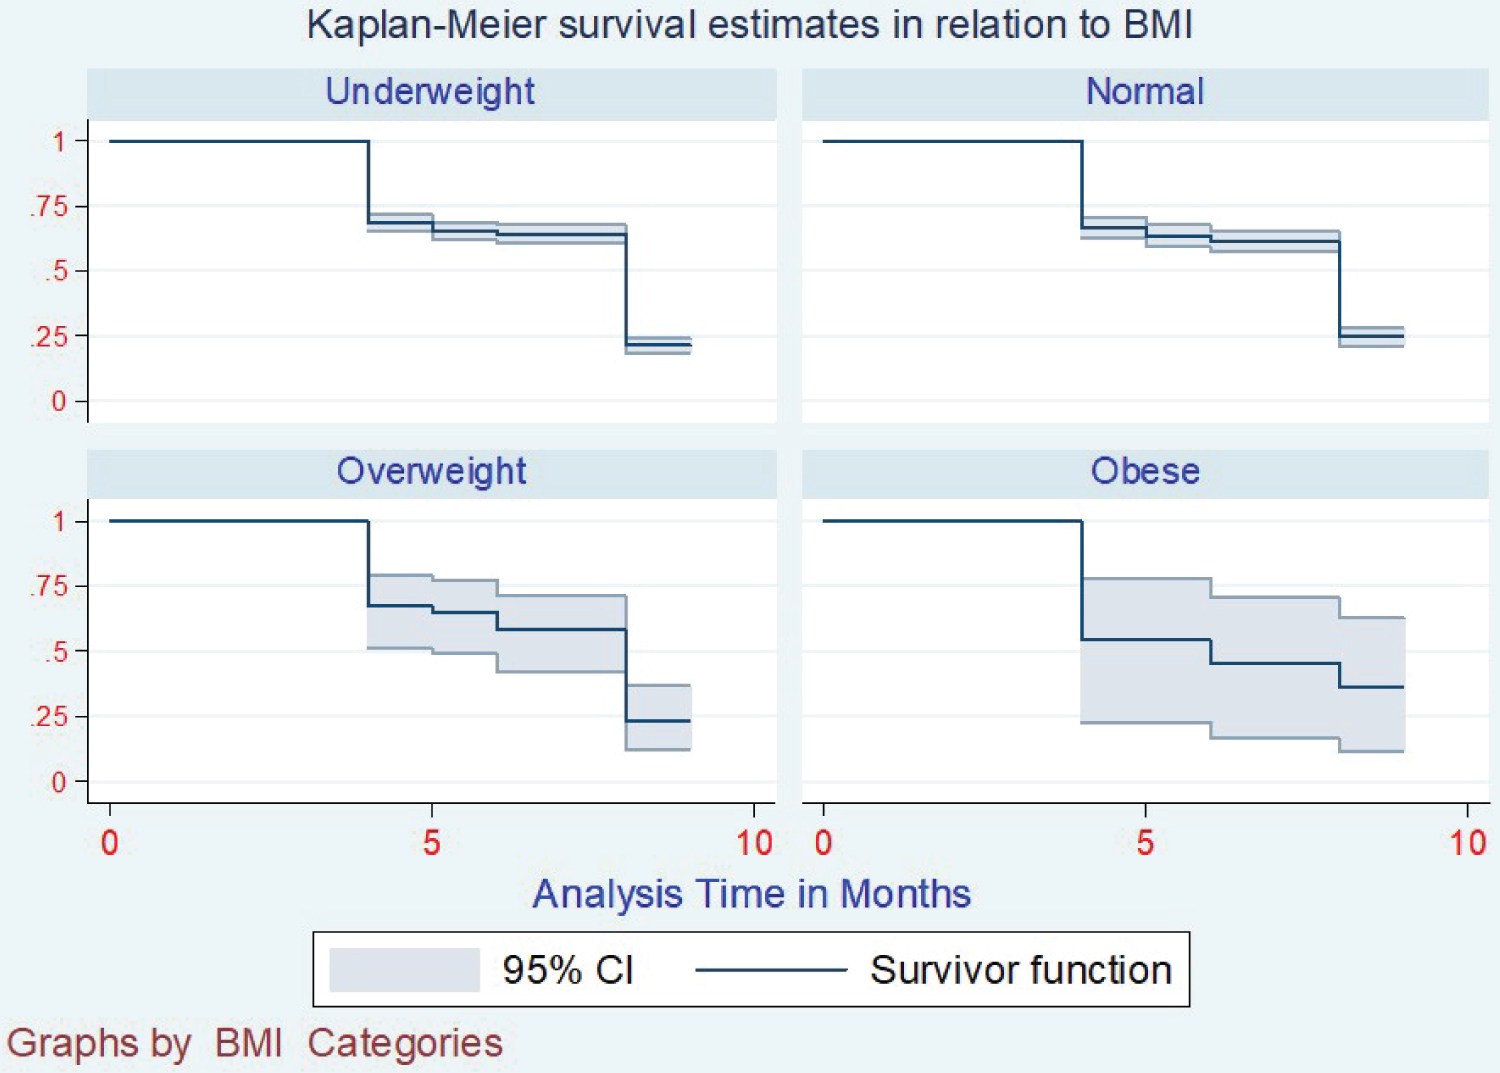
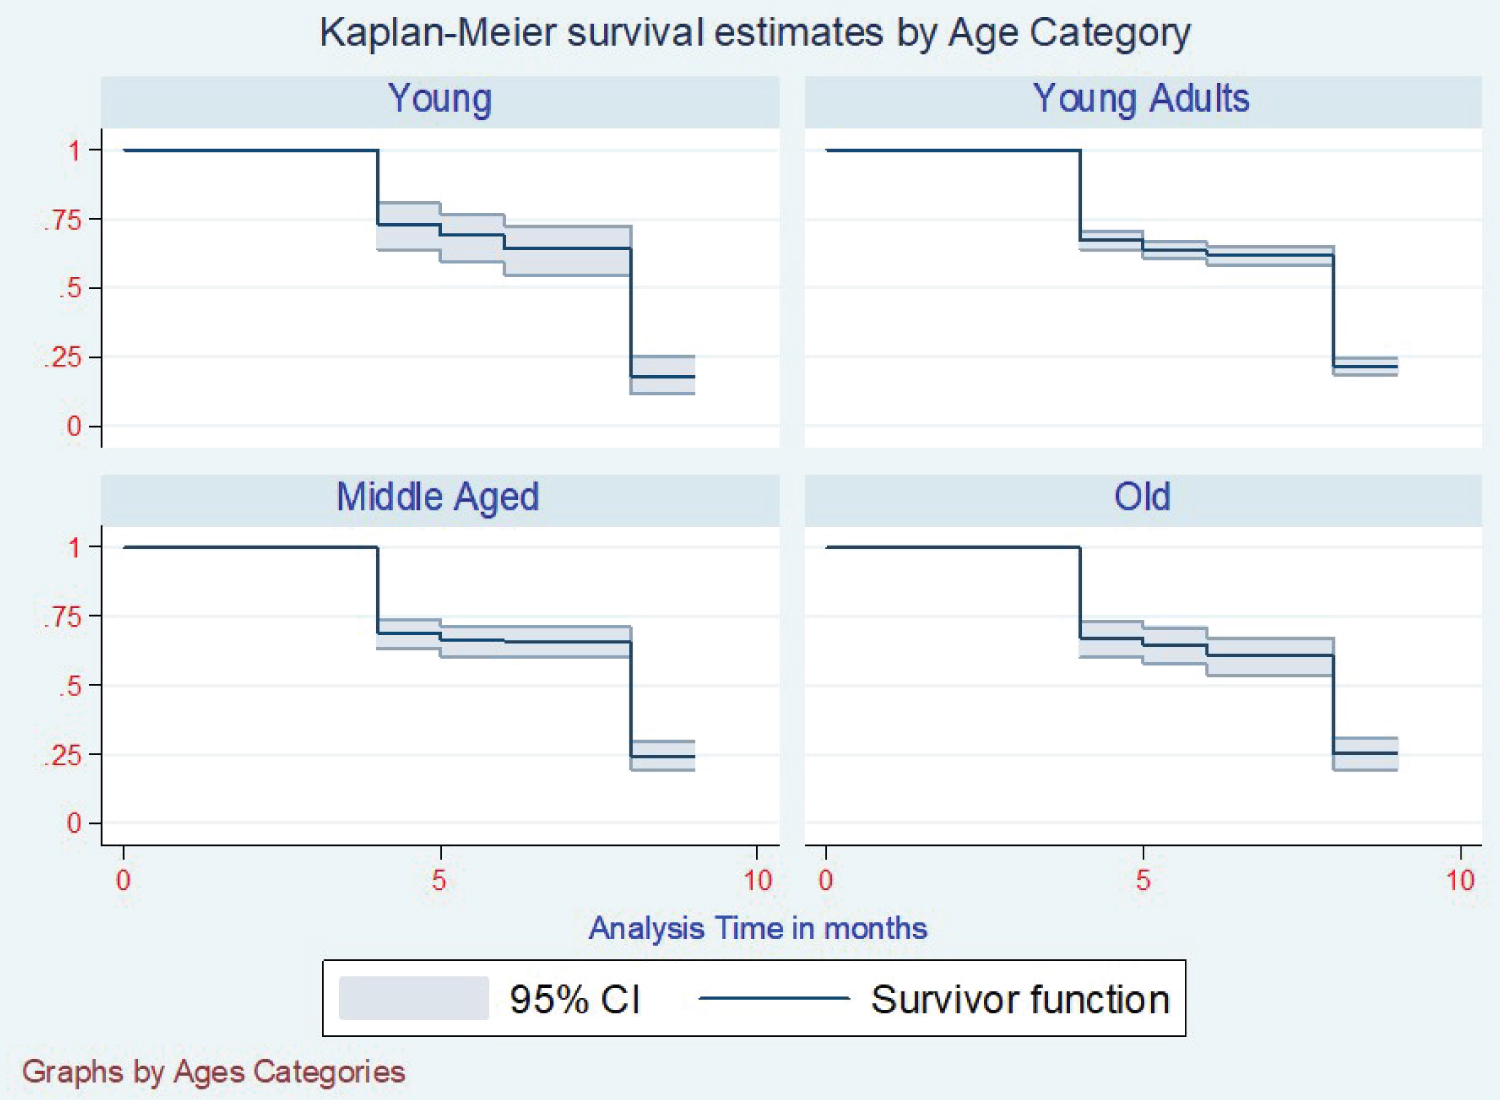
Those who had Mono-resistance was not recorded with any conversion by nine months of intensive phase treatment (Figure 3). In the case of BMI at enrollment, the conversion varied according to which category the patient was enrolled. Were the best converters were obese converting at six months, overweight at seven months, average weight at eight months, and the underweight took the longest time of 9 months to convert (Figure 4). With the registration groups, we had a different median time of conversion concerning which class the client had been enrolled in. For the clients enrolled, the new cases took the least time to convert at five months, with Relapse, lost to follow up, failure to category one, and failure to category two taking a median time of 9 months to show conversion (Figure 5). Age category conversion patterns the old and young categories took a median time of 8 months to convert, and the middle-aged and younger adults took a median time of 9 months to convert (Figure 6).
Cox proportional hazard model
A multivariate Cox proportional hazard model was constructed with sputum conversion time as the outcome variable. The first step was to enter each category variable in the model (full model), then assessment was made through review of the likelihood ratio statistic of the model. The specific hazard ratios and their 95% confidence intervals were calculated, and the Wald test was used to test the model. In essence, we checked for the proportionality assumption for the PH assumption, which we did by using graphical diagnostics at each level group of covariates.
The models are presented in Equation 4 at each level
Where,
h(t) = Expected hazard a time t
h0(t) = Baseline hazard
X1, X2,.... Xp = Predictors
b1, b2,...,bp = Coefficients
From the three levels analysis done, the interaction of most variables was not significant enough to determine the sputum conversion time apart from the intensive phase medication given, modification of the intensive phase regimen, and the resistance pattern of the patient where the Hazard ratios (HR) where, HR-(0.974) with a ln -0.0261, HR; (0.9363) with ln -0.0658, HR; (1.16) with ln 0.1545. From this, we can see that the type of intensive phase regimen given, and type of modification done could reduce the period one would take to have their sputum convert from being sputum positive to sputum negative, and consequently, with the kind of resistance pattern, it would increase the time one would take to convert from being sputum positive to sputum negative as explained in Table7 and Table 8.
PH Assumptions
The assumption was that the hazard of drug-resistant tuberculosis at any given moment was similar for all patients enrolled for follow-up across the country at any given time. To verify this assumption, we used a graphical method to check for specific variable categories if they meet the similar criteria of a graphical test where most of the variable categories could not meet the criteria.
A goodness of fit test for the PH models was done for the fitted models, a test of correlation between the Schoenfeld residuals and survival time. A correlation of zero indicated that the model met the proportional hazards assumption.
Model 1: Test of proportional-hazards assumption.
Time: Time
| chi2 | df | Prob > chi2 | |
| Global test | 39.65 | 6 | 0.0000 |
Model 2: Test of proportional-hazards assumption.
Time: Time
| chi2 | df | Prob > chi2 | |
| Global test | 1.64 | 6 | 0.9498 |
Parametric survival models
With the parametric models of conversion time, the comparison was made between the exponential and Weibull survival parametric models regarding sputum conversion and see which one better explains factors affecting clients' conversion. Stratification has been done in three levels according to Factors that the patient does not influence- (Model 1), Factors directly associated with the patient- (Model 2), and Resistance development factors - (Model 3). Analysis was done on the three-level model variables, and the choice was made between the two models best predictor by comparing the AIC, which is lower. In contrast, for Model 1, the Weibull was a better predictor from the AIC - (1825). In Model 1 variables; Sector, Model of care, and County were significant enough to determine the conversion time where the county had HR = 1.00 meaning the county as a variable had no contribution to the time of conversion for patients who had come with drug-resistant tuberculosis, but for the sector had (HR = 0.89; 95% CI, 0.81 to 0.98; p = 0.05 by fishers exact test) meaning the sector which a patient was receiving the treatment could increase the conversion time by one fold compared to other sectors compared and the model of care (HR = 0.69; 95% CI; 0.60 to 0.79; P = 0.05 by fishers exact test) this means that models of care applied to treat the drug-resistant would lower the conversion rate by 0.6 times of the average time needed for one to convert; (Table 9). Model 2; only Age category variable that was significant with (HR = 0.99; 95% CI; 0.77 TO 1.27; P = 0.05 by fishers exact test) meaning that with a hazard of 0.99, which is close to one age did not affect the conversion time for patients who had DR-TB; (Table 10) Model 3 we had LPA-Rif (HR = 1.3;95% CI ;1.05 to 1.65; P = 0.05 by fishers exact test) where LPA rifampicin variable increased the risk of the patient not converting the sputum, LPA-H (HR = 0.66; 95% CI; 0.49 to 0.87; P = 0.005 by fishers exact test) where LPA Isoniazid would reduce the conversion time by 0.66 times and R-DST (HR = 0.22; 95% CI; 0.17 to 0.28; P = 0.05 by fishers exact test) in which a Rifampicin DST would lower the conversion time by 0.2 times; (Table 11).
Discussion
The total patients enrolled for the drug resistance tuberculosis were 2674 patients from 2014 to 2019, who we all included in the study. Nairobi County reported the highest number of patients diagnosed with DR-TB, and Wajir County was the county that had the least number of cases reported, which could be a result of the high number of people and healthcare facilities that would have contributed to testing and diagnosis. The community-based method of care carried up to 75% of all patients who had been diagnosed with DR-TB. Over 60% of clients enrolled had been done an AFB test, and up to 95% of all patients had received a Gene-expert test from which we had up to 37% of the patient being Rifampicin Resistant, 25% being Mono-resistant and MDR was 325%. The patients who got enrolled for treatment had two phases of drug administration, where the intensive phase started immediately after a client culture results were out. From the enrolled clients, 50 % took eight months to get sputum conversions, whereas only 25% took four months to have sputum conversions. The gender factor had no significance in determining the time of sputum conversion.
The median time of conversion for resistance as a variable was nine months. Rifampicin resistance was seven months, and Mono-resistance and Pre-XDR were the most difficult ones. Most of them had not converted by the median time of 9 Months. The registered group's conversion time was eight months apart from the Failure to First Line ant-TB, which took nine months. The age category we had the youngest was one year, and the oldest was 78 years. Still, most patients ranged from 20 years to 49 years, and below 20 years and above 50 years represent a small percentage of the total population. 20 to 40 years conversion time was nine months, 40 to 50 and the above 50 years) Converted at 7 and 8 months, respectively. The BMI was the underweight took nine months to convert, Normal weight eight months, overweight and obese, took 7 and 6 months. From the models analyzed at conversion time, the intensive phase regimen has given, modification of intensive phase, LPA-Rif, and DST-Rif are the factors that were associated with the time when a patient would have their conversion.
Conclusions
In conclusion, we had a generalized system to manage DR-TB cases where patients were monitored. Still, we seemed an auto-piloted EMR system most of the basic requirements to diagnose DR-TB was not being timely documented, resulting in information gaps for proper following up patients; hence a robust monitoring system should be in place to ensure what is in the guidelines is being practiced plus diagnosis tool and system failures addressed. The biggest challenge of DR-TB of the reviewed data seems to be the failure of first-line treatment medication, a loss to follow up, and new cases, which meant that there are undetected drug-resistant TB In the community in enormous proportions a significant risk to the population. Lost to follow-up Cases were being reported in large numbers signifying that our models are not keen on following up patients who they initiate on treatment despite having a significant number being on a community level where we have community health workers. The good thing is that most patients enrolled were tested for HIV, and medication was administered after diagnosis.
Competing Interests
The authors declare that they have no competing interests.
Authors' Contributions
|
Authors' contributions |
MD |
IO |
AK |
HK |
|
Research concept and design |
√ |
√ |
√ |
√ |
|
Collection and assembly of data |
√ |
-- |
-- |
-- |
|
Data analysis and interpretation |
√ |
-- |
-- |
-- |
|
Writing the article |
√ |
-- |
-- |
-- |
|
Critical revision of the article |
√ |
√ |
√ |
-- |
|
Final approval of the article |
√ |
√ |
√ |
√ |
|
Statistical analysis |
√ |
-- |
-- |
-- |
Acknowledgments and Funding
We acknowledge the Kenya National Tuberculosis and Leprosy Program for facilitating the abstraction of medical records from their TIBU system.
References
- (2020) World Health Organization. For tuberculosis. Are updated every year. 1-2.
- Nahid P, Mase SR, Migliori GB, et al. (2019) Treatment of drug-resistant tuberculosis. An official ATS/CDC/ERS/IDSA clinical practice guideline. Am J Respir Crit Care Med 200: e93-e142.
- Ismail N, Ismail F, Omar SV, et al. (2018) Drug-resistant tuberculosis in Africa: Current status, gaps, and opportunities. Afr J Lab Med 7: 1-11.
- Otieno OC, Nyamache AK, Nonoh J, et al. (2018) Prevalence and detection of drug-resistant mutations in mycobacterium tuberculosis among patients visiting selected health centres in nairobi, Kenya. BMC Infect Dis 19: 279.
- Sitlani CM, Lumley T, McKnight B, et al. (2020) Incorporating sampling weights into a robust estimation of Cox proportional hazards regression model, with illustration in the Multi-Ethnic Study of Atherosclerosis. BMC Med Res Methodol 20: 1-10.
- Fox J (2008) Cox proportional-hazards regression for survival data the cox proportional-hazards model: Appendix to an r and s-plus companion to applied regression 1-18.
- (2011) Crumer AM. No Title.
Corresponding Author
David Mutabari, PhD Student, Medical Statistics, University of Nairobi, Nairobi, Box 30197-00100, Kenya.
Copyright
© 2022 Mutabari D, et al. This is an open-access article distributed under the terms of the Creative Commons Attribution License, which permits unrestricted use, distribution, and reproduction in any medium, provided the original author and source are credited.