Optimization of the Heat Capacities of Sphalerite Phases as Single System
Abstract
To describe the set of the isostructural experimental data Cp (T) of diamond-like phases in solid state as a single system was used multiparameter family of functions in the form
where the coefficients are the adjustable parameters.
The search for the minimum of σ 2 was carried out by three methods: the golden ratio, conjugate gradient and coordinate descent.
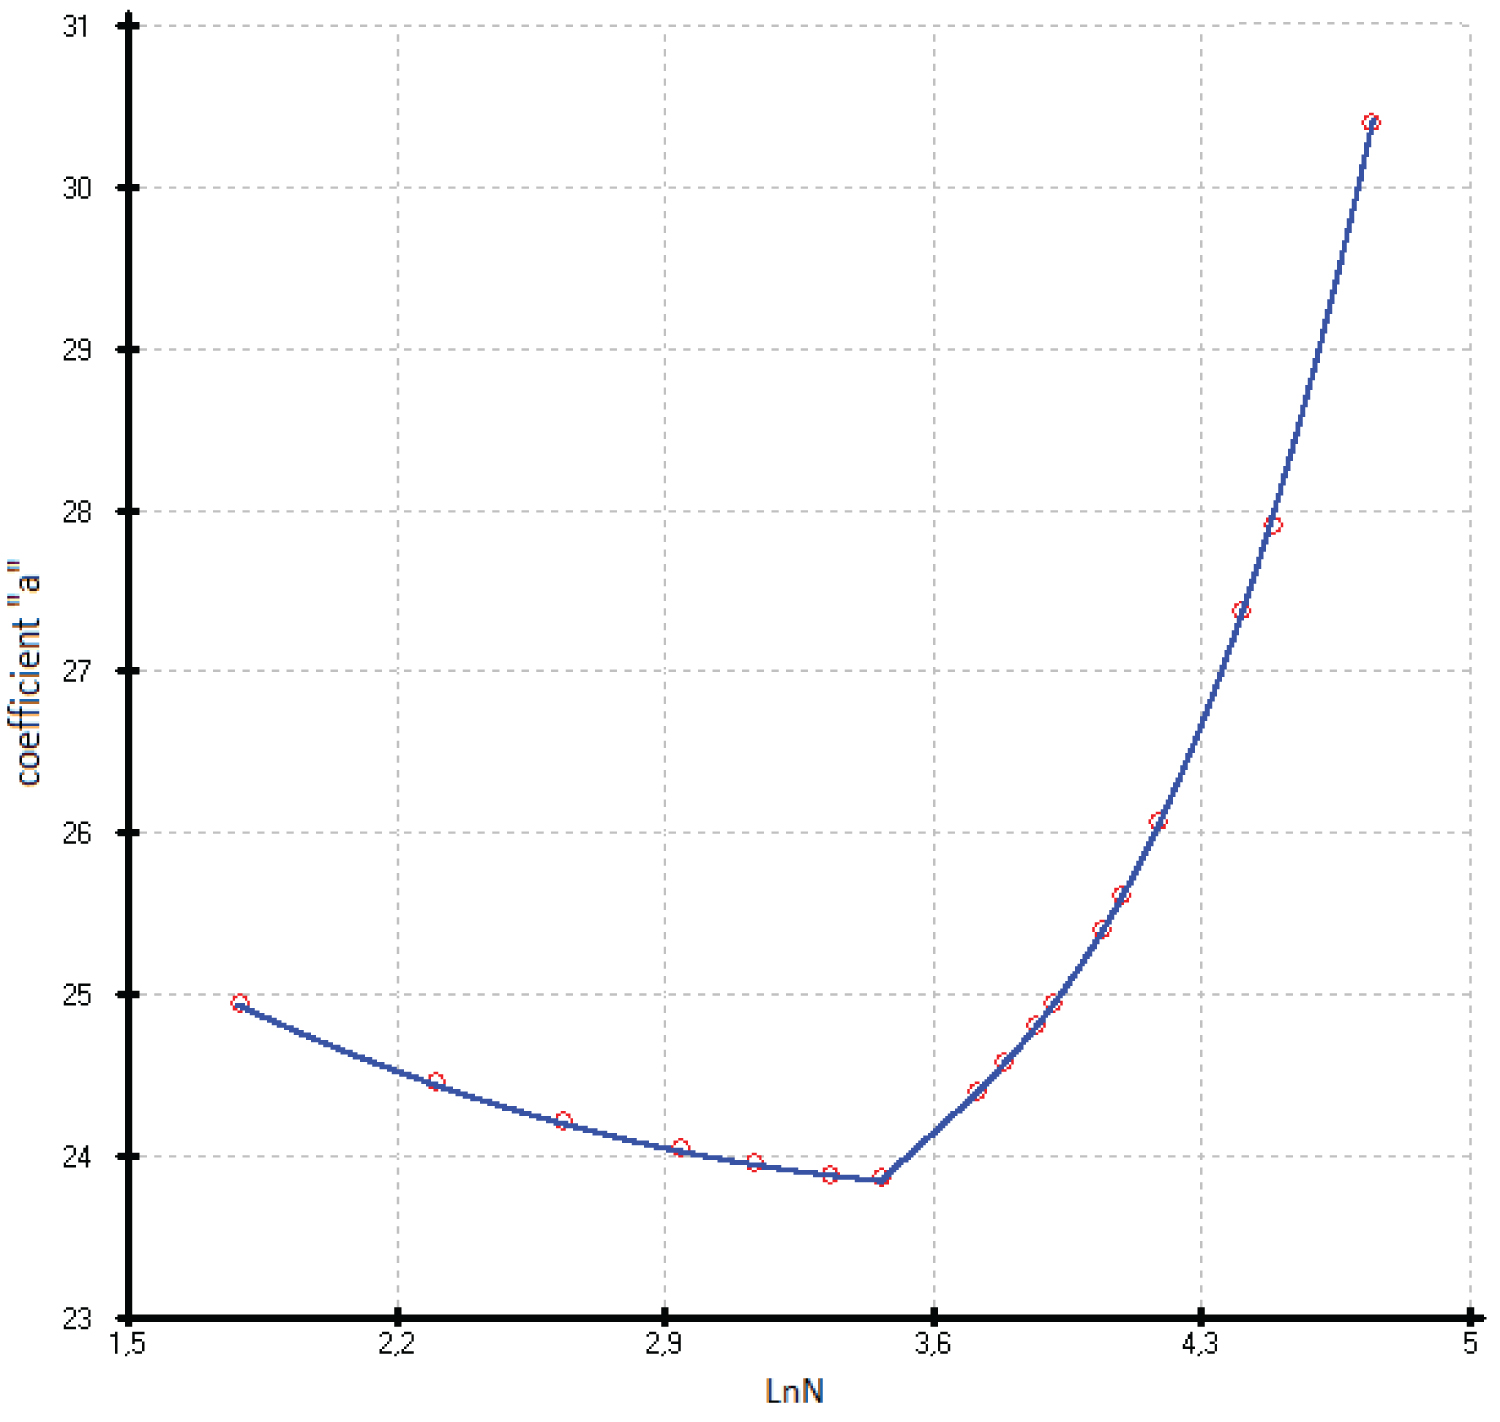
All coefficients can be described by polynomial equations vs. Ln(N), where N is atomic number of the element of IV group (Si, Ge, α-Sn, diamond-like Pb, Fl) or demi sum of the atomic number of the A II B VI or A III B V phases. In this case, either a break point or an inflection point attributable to germanium is observed on the parameter vs. Ln(N) curves.
Keywords
Heat capacity, Diamond like phases, Similarity method
Introduction
Numerous experimental data on the heat capacity of solid phases make it possible to carry out a generalized thermodynamic analysis of diamond-like isostructural phases of the fourth group elements and their structural analogs of A III B V and A II B VI fluorite phases. The IV-th group of pure elements, in addition to diamond, silicon, germanium and alpha-tin, includes diamond-like lead [1] and flerovium ( 114 Fl) [2], which closes this group. There should be no other elements in this group according to the fine structure constant or Sommerfeld constant: α = e2/ħc [3]. In this expression, e is the electron charge, c is the speed of light, ħ is the reduced Planck’s constant, or Dirac’s constant ( ħ=h/2π ), which connects the amount of energy of electromagnetic radiation with its frequency. The parameter α is a dimensionless quantity, and its numerical value is close to 1/137.
The fine structure constant determines the limit of the maximum number of protons in the nucleus, at which electrons can still have stable orbits. In other words, this constant allows us to determine that with the highest probability, the last neutral atom of the periodic table will be element 137. Researchers [4] share the same opinion.
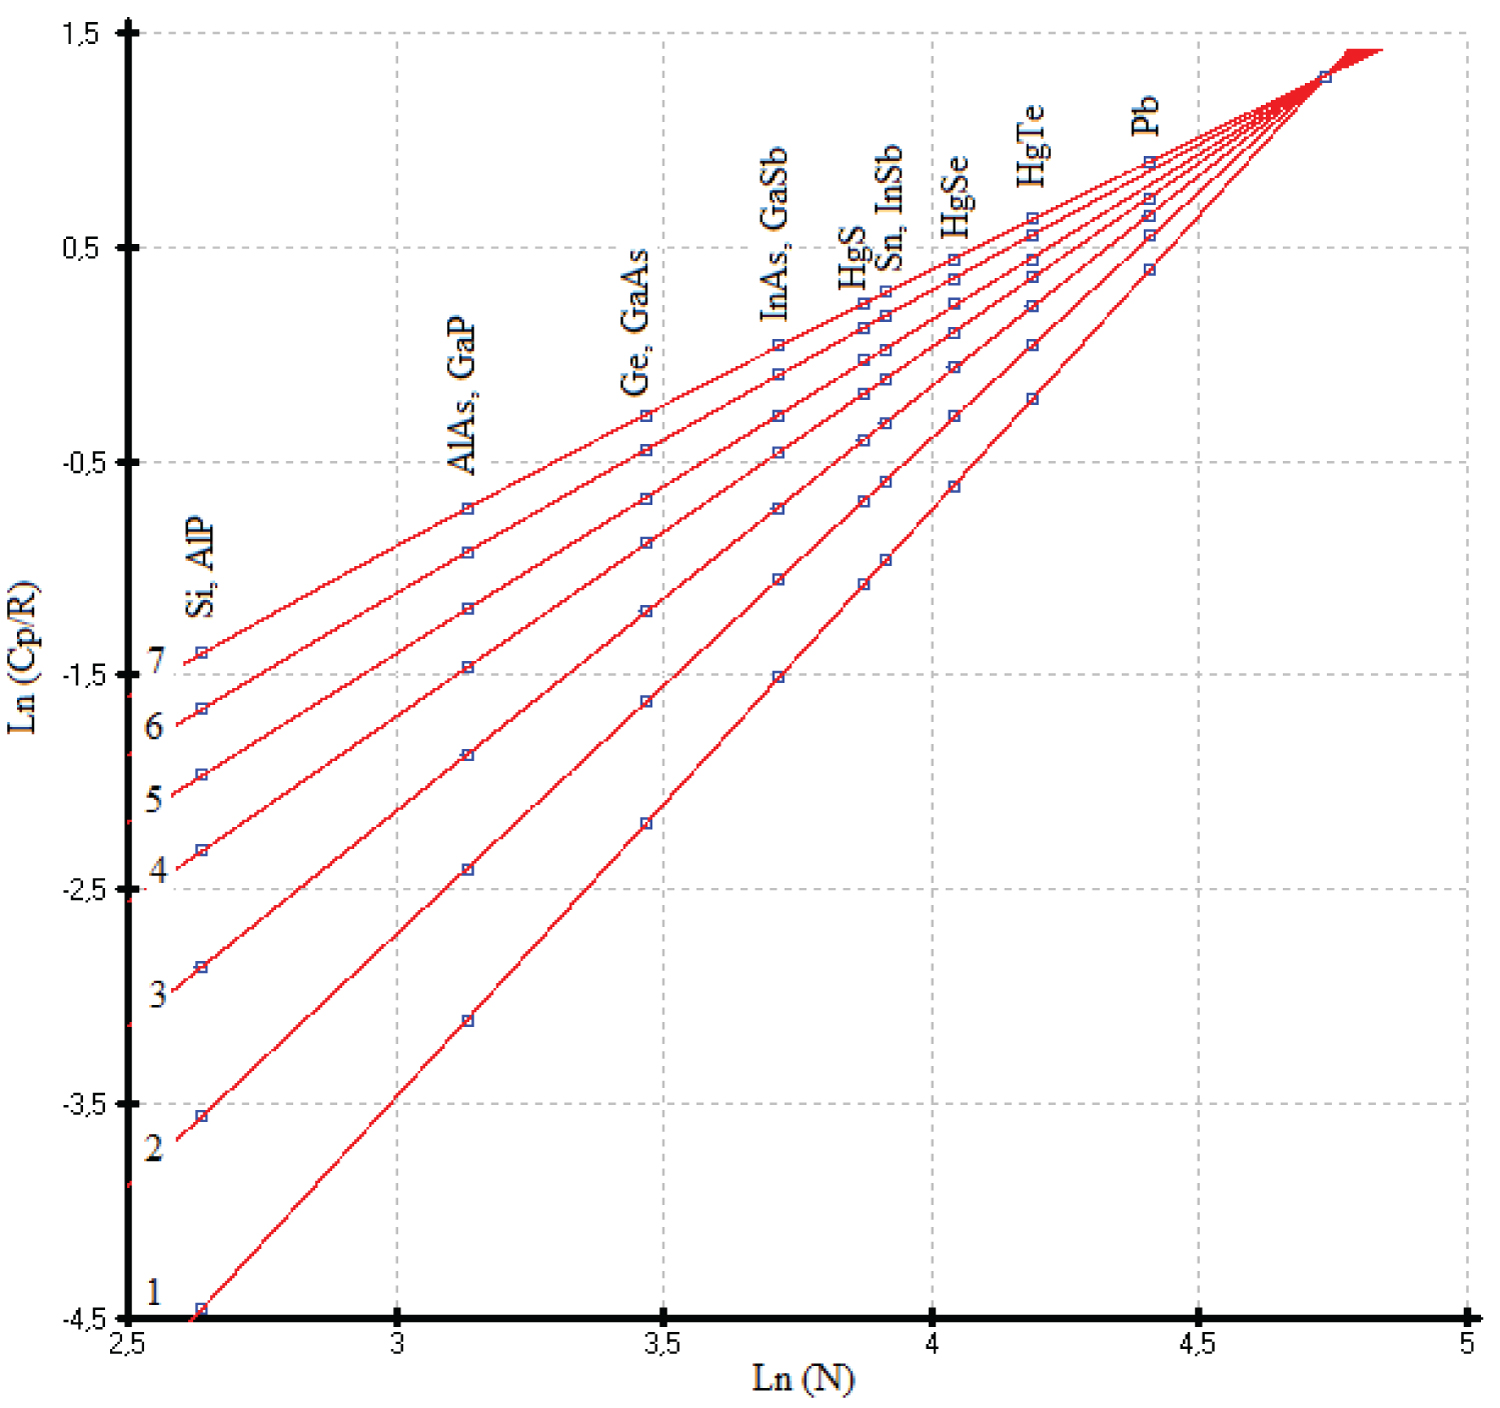
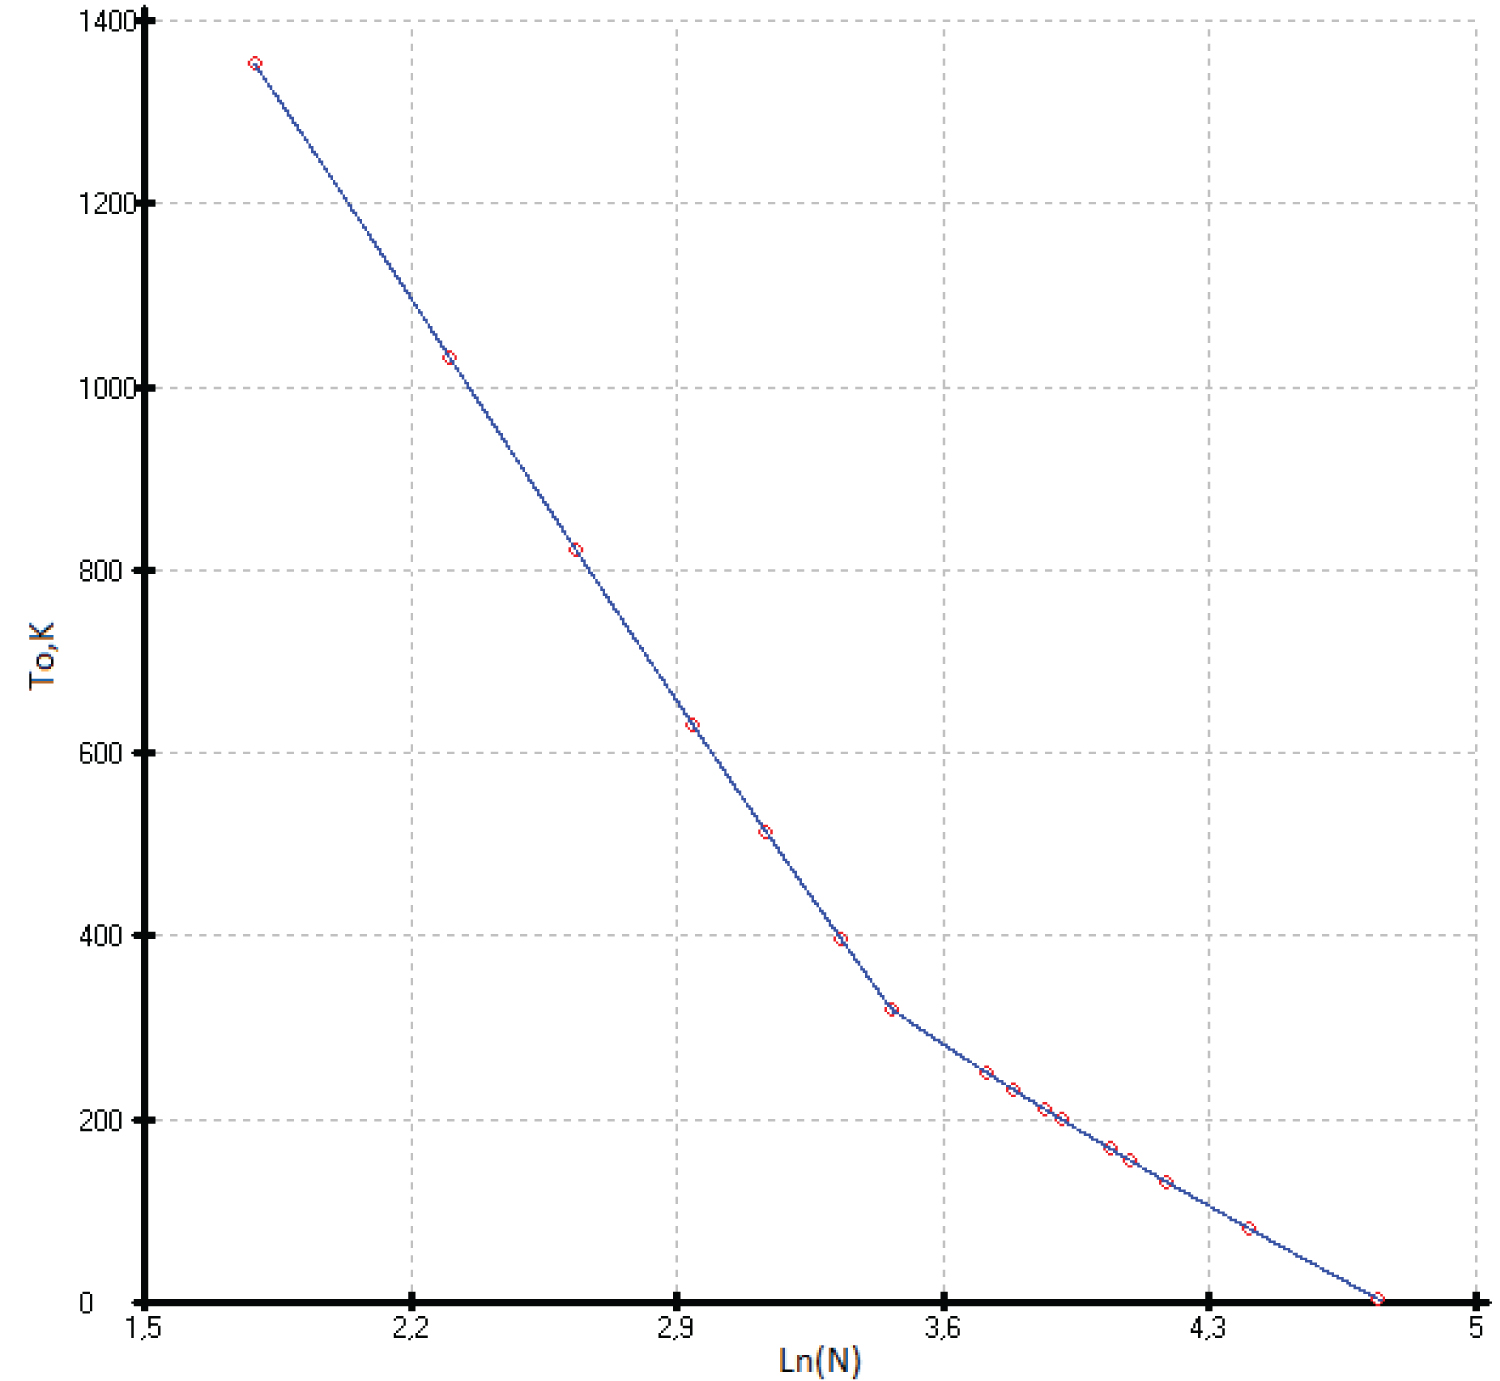
As a consequence, the limiting value of the heat capacities of phases with a sphalerite structure falls on the 114 th element ( 114 Fl) and has a value of C p = 30.5 ± 0.3 J mol-at -1 K -1 . This value was obtained as a maximal virtual point Cp of the last elements ( 114 Fl) of the IV group and corresponds to Ln (C p /R) = 1.30 ± 0.01 for the isotherms Ln (C p /R) vs. Ln(N), where N is an atomic number of an element of the IV group or the sum of the atomic numbers of A III B V or A II B VI compounds per mole-atom [5]. The common point of heat capacity attributable to flerovium is obtained from the linear equations С р /R vs. Ln(N) at low temperatures from 25 to 35K (Figure 1).
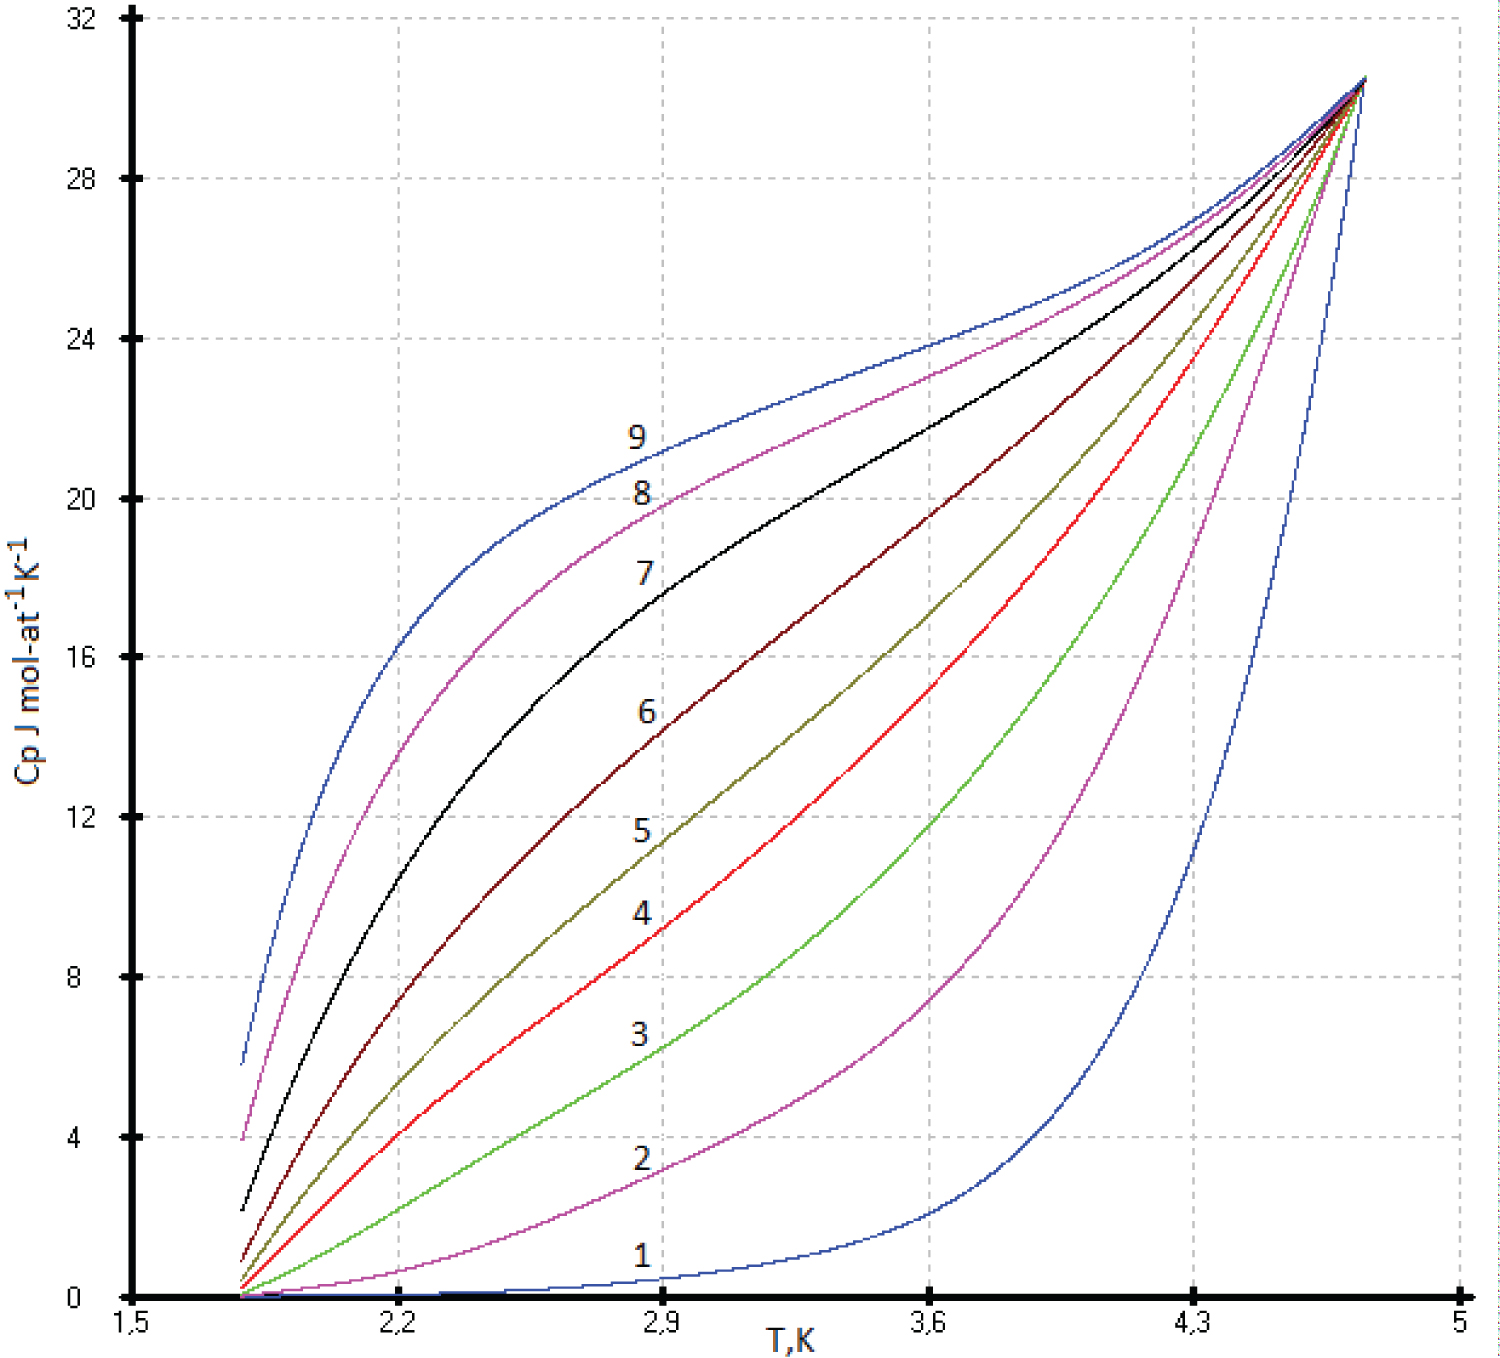
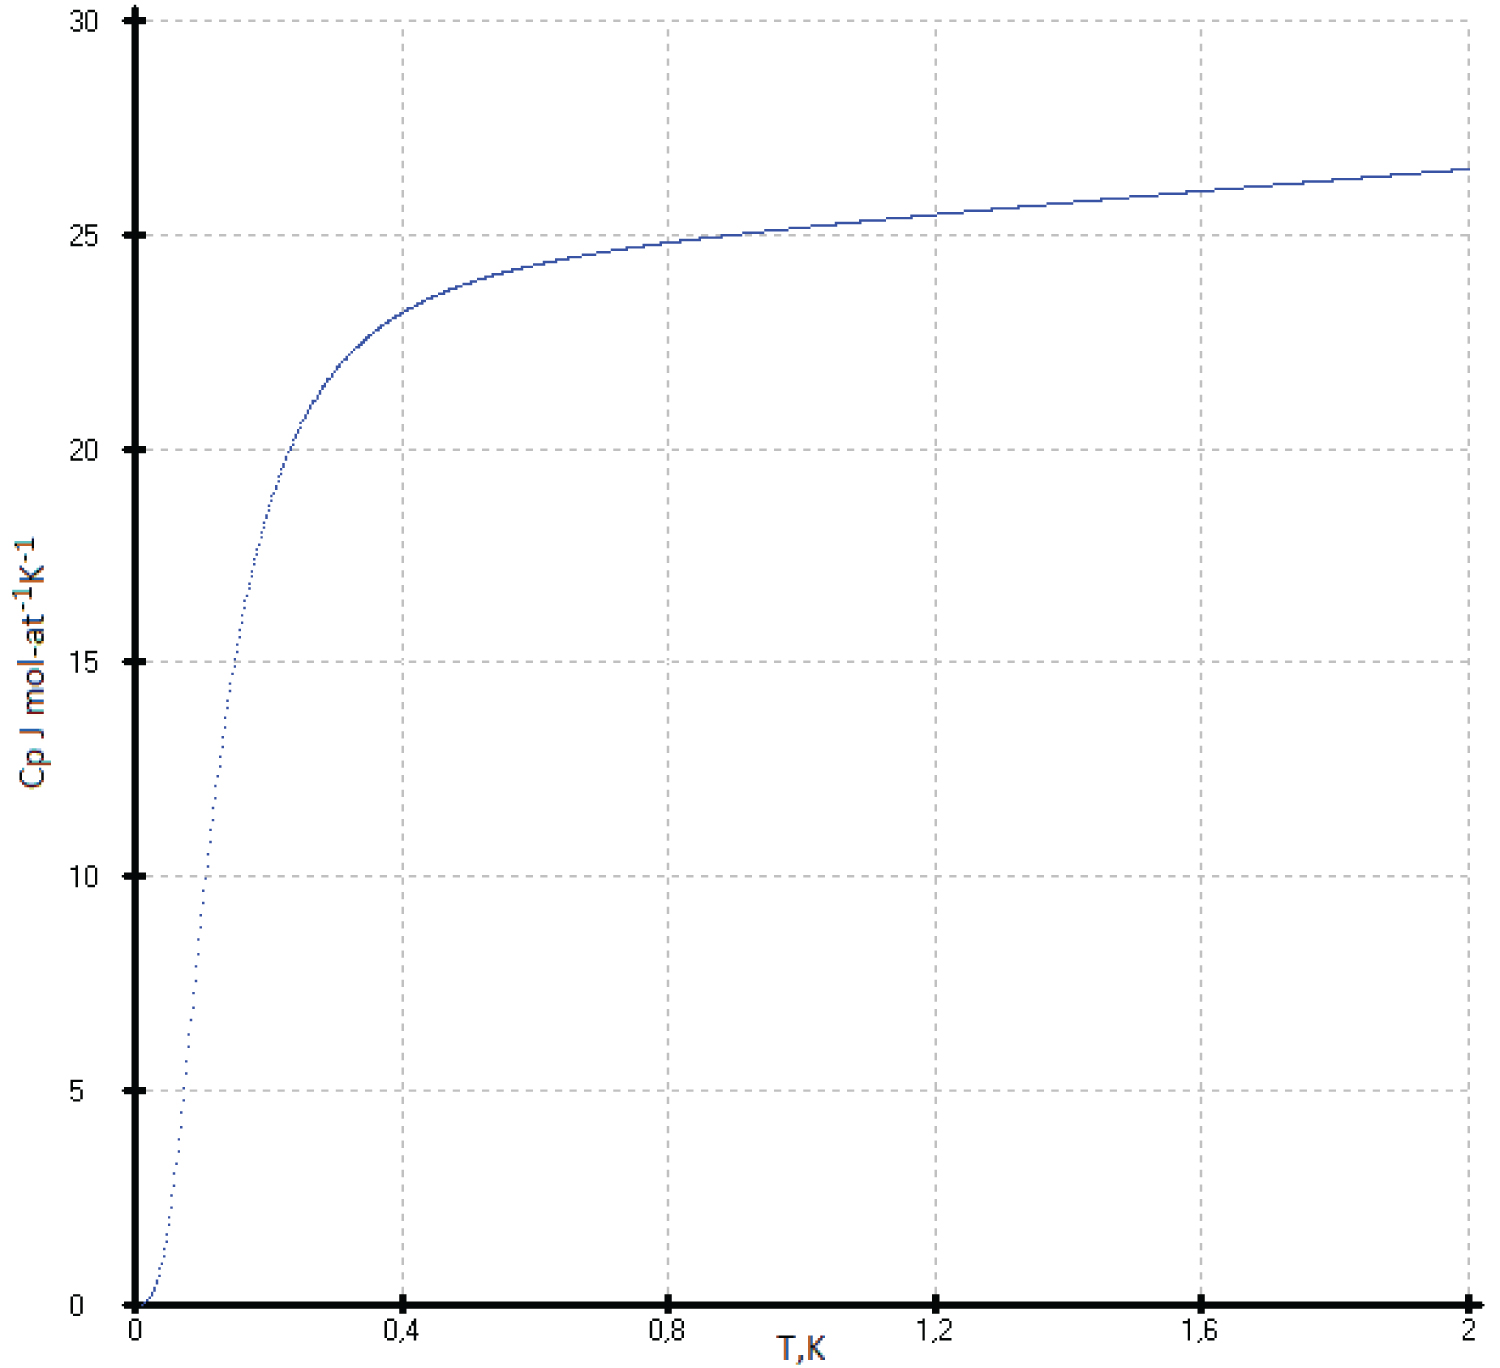
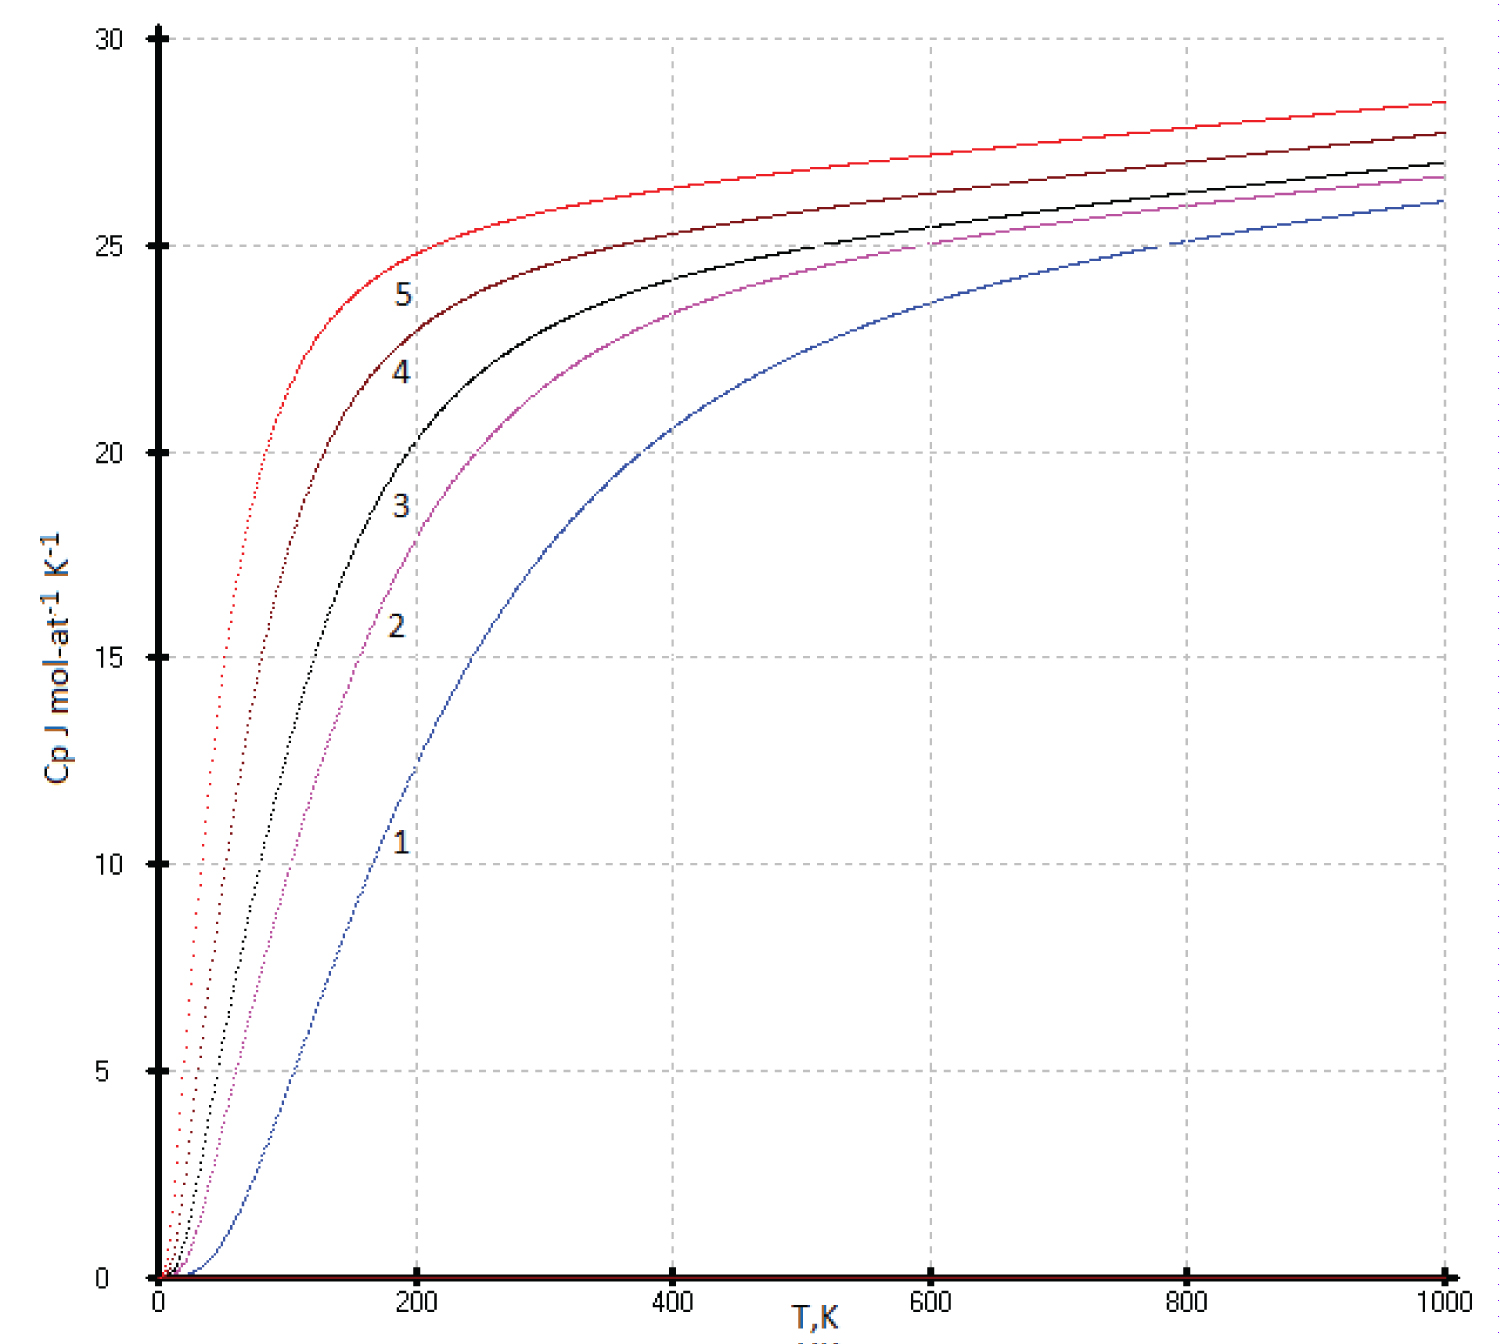
The maximum heat capacity of flerovium can be taken as a constant value of 30.5 J·mol-at -1 ·K -1 with an accuracy of 1%. As the temperature decreases, the C p (T) values of flerovium slowly decrease, and then, near 0.5 K, drop sharply to 0 J mol-at -1 K -1 . The proposed model was taken as an ideal crystal without foreign inclusions, defects and dislocations (Figure 2 and Figure 3).
Model and Computational Method
The main idea of this work is presented in [6].
The functions C p and C v using both the Debye models and the Maier-Kelley equation are proposed to describe the heat capacity of substance in a solid state using an in-house software [6], based on the commercial DELPHI-7. The solution to the problem was reduced to finding the minimum of the objective function of eight independent adjustable parameters of the form:
The search for the minimum of σ 2 was carried out by three methods: The golden ratio, conjugate gradient and coordinate descent.
They make it possible to calculate the heat capacity values equal to the experimental data within the deviation range.
In this work the number of independent adjustable parameters of the function (2) were reduced down to six
, Where (3)
The entire array of experimental data С р (Т) in the model calculation was used, both at low and at high temperatures. It was found that all parameters of the function (3) can be described by polynomial equations vs. Ln(N), where N is atomic number of the element of IV group (Si, Ge, α-Sn, diamond-like Pb, Fl) or demi sum of the atomic number of the A II B VI or A III B V phases. In this case, either a break point or an inflection point attributable to germanium is observed on the parameter vs. Ln (N) curves.
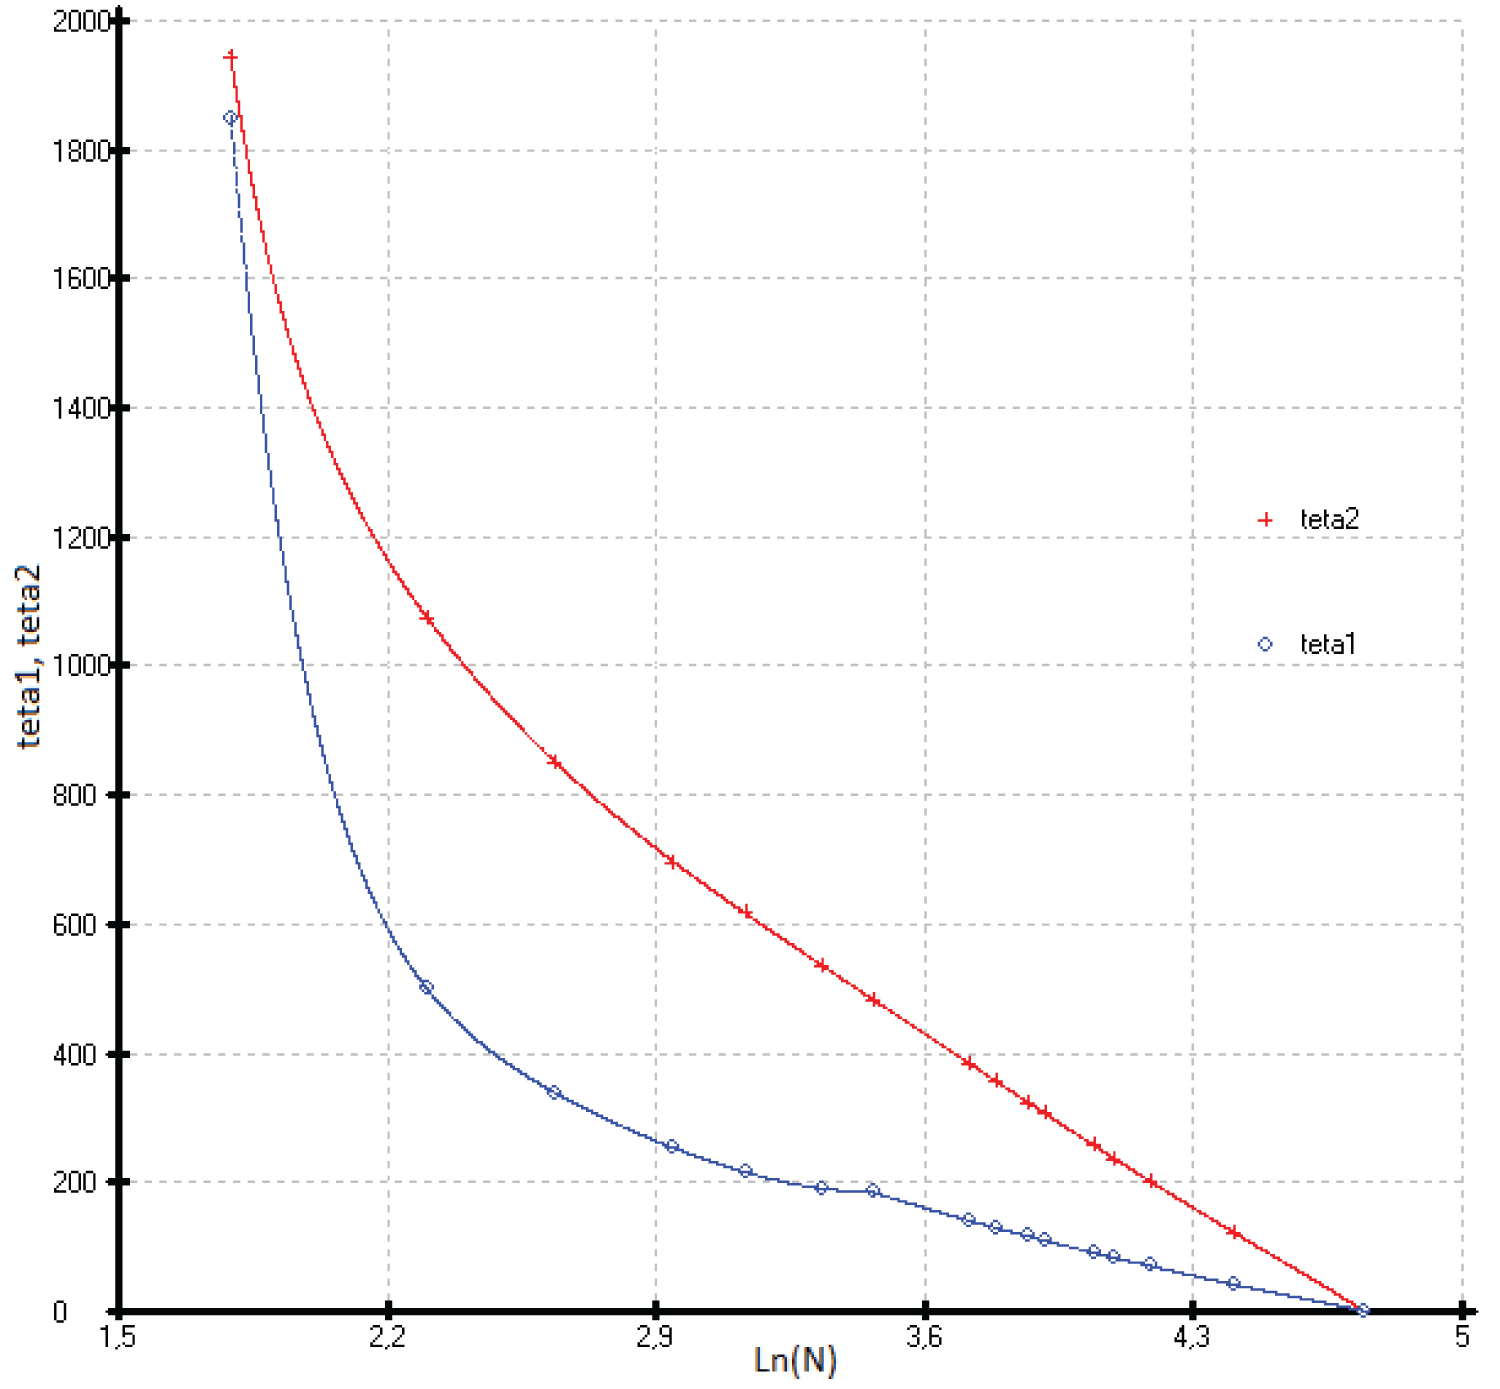
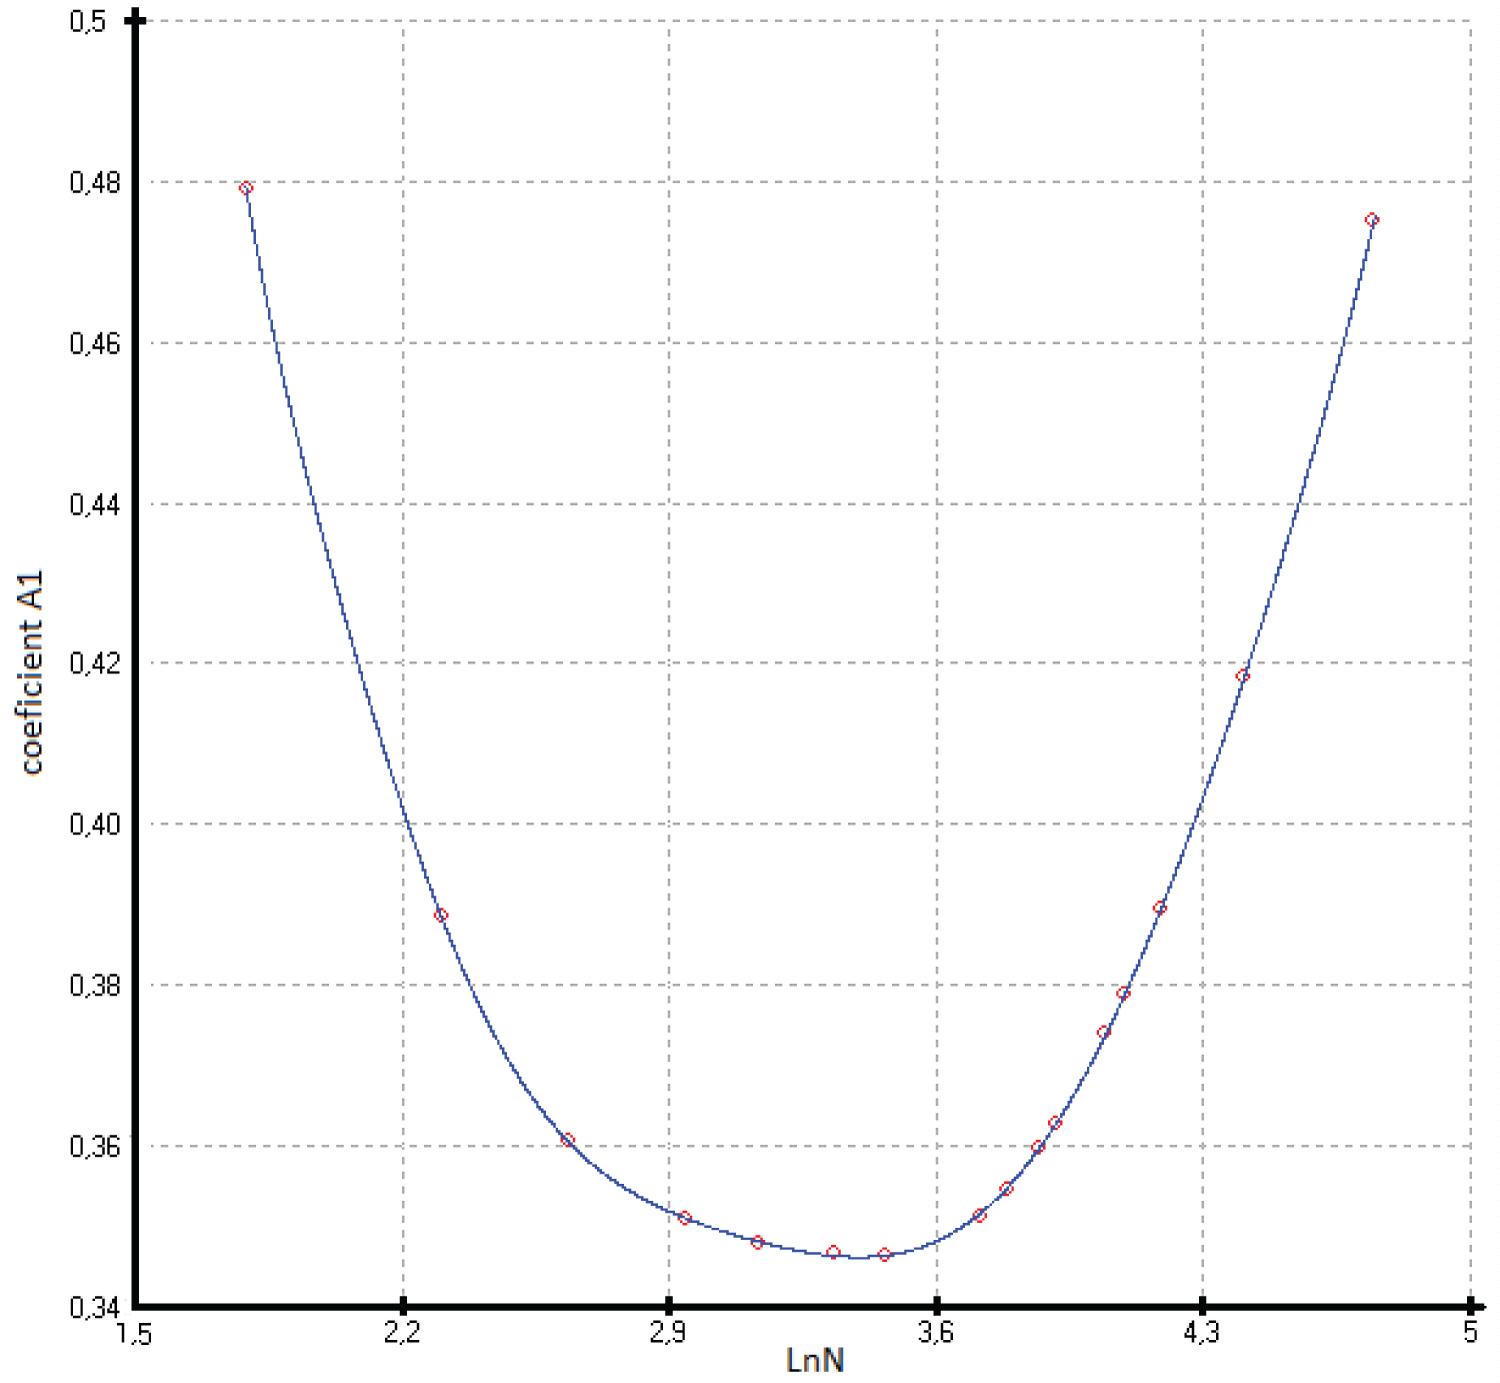
The coefficients of function (3) calculated by the least squares method are presented in Table 1 and Figure 4, Figure 5, Figure 6, Figure 7 and Figure 8.
The accuracy of describing the coefficients of function (3) by polynomial equations for the two branches of germanium is presented in Table 1. To describe the entire curve of the coefficient A1, a polynomial of the form is used. In this case, the minimum coefficient A1 falls on germanium. Other coefficients of the function (3) are described with fewer members of the polynomial (4).
, Where x = Ln(N) (4)
Materials
What substance can we choose as the standard one for the like-diamond phases? It is better to use the pure elements as diamond, silicon, germanium, and grey tin (α-Sn). Firstly, it is easier to get rid of impurities by zone cleaning, and secondly, there is no problem of stoichiometry, as is the case with two phases. Nevertheless, the modern technology of purification of substances does not allow getting rid of foreign inclusions in the crystal lattice of a substance, defects and dislocations.
Choice of reference elements and discussion
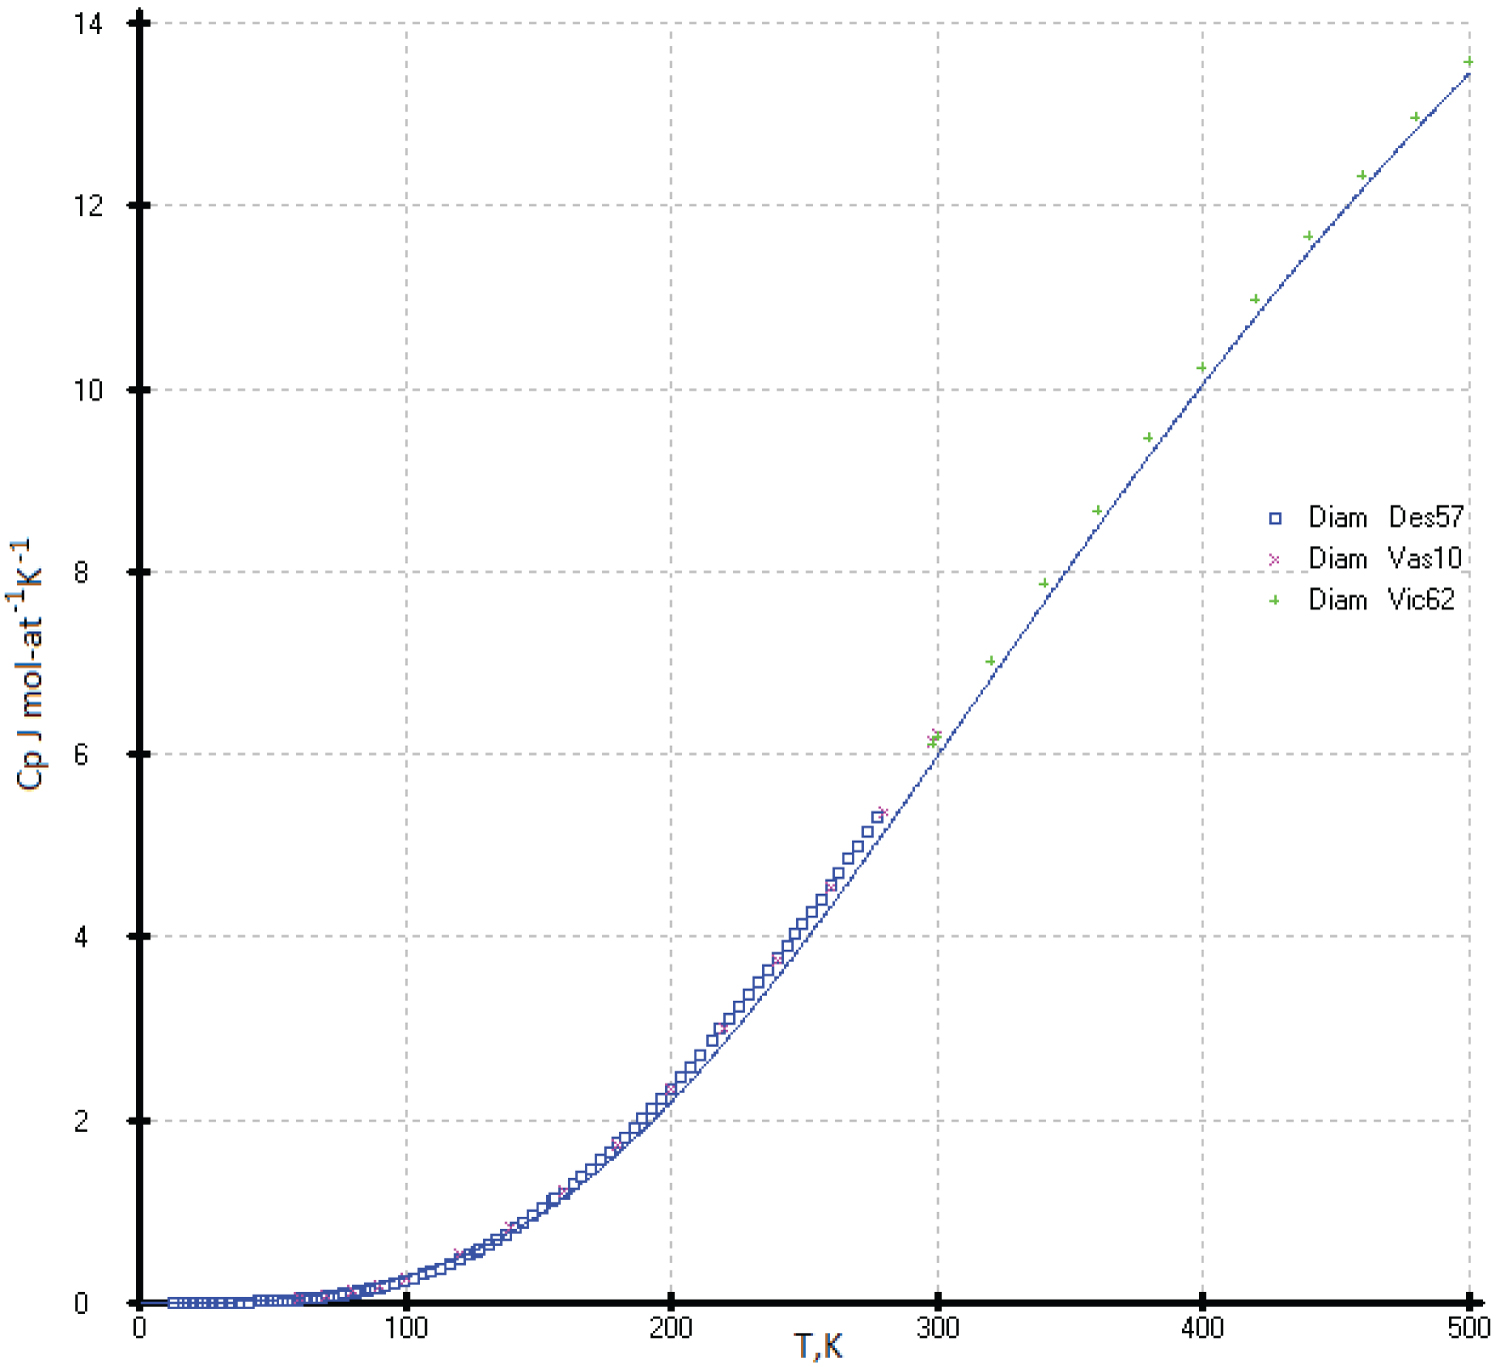
Diamond: There is not any reference incorporates the influence of impurities on the measurements of the heat capacity of diamond. The heat capacity of diamond has been studied on industrial samples with a content of 0.2 wt. % in [7,8] and up to 1 wt. % of impurities in [9]. It is very problematic to obtain a diamond with a purity of 99.999%, since elements close in size to carbon, as well as gases such as oxygen and nitrogen, are easily introduced into the diamond crystal lattice. At the same time, the gem purity of the diamond does not suffer in any way. So, the influence of the impurity on the measure of heat capacities of isostructural diamond is quite significant; therefore, it is not possible to take the diamond as a standard substance (Figure 9).
Silicon and AlP: To measure the heat capacity of high-purity at low-temperature was cured out in [10,11]. The samples were obtained by the crucible-free zone melting method. The content of metal impurities in the investigated sample was at the level of 10 -8 -10 -10 at. % and gas forming impurities at the level of 10 -3 -10 -4 at. %. The resistivity at room temperature was 3 kΩ cm and the dislocation density were less than 100/cm 2 .
Low-temperature heat capacities C p (T) [10] and [11] agree well with earlier work [12]. The high-temperature heat capacities of silicon have been measured in [13,14]. There is complete agreement between the experimental data [13] and our model calculation from 298 to 1000 K.
At higher temperatures, the experimental heat capacities [13,14] are a few of our calculated values. Some additional increases in the heat capacity of silicon at elevated temperatures can be explained by the oxidation of its surface. A thin (1-2 nm) layer of silicon dioxide is forms on the silicon surface under normal atmospheric conditions. Its layer grows upon heating, up to tens of nanometers [15]. The calculated heat capacity of silicon by molecular dynamic simulation [16] confirms the experimental data in the range of 700-1400K (Figure 10).
Thus, we have chosen the C p (T) of high-purity Si as a main standard substance up to 700K [10,11]. We re-optimized C p (T) data above 1000K according to our new concept [6].
It is expedient to describe C p (T) two isostructural Si and AlP phases with the same sums of atomic numbers (N=14) per mole-atom at high temperature together. Aluminum phosphide (AlP) is highly toxic. Upon contact with water or humid air, this substance releases toxic phosphine PH 3 [17]. That is why the study of its physicochemical properties is limited. Attempts to investigate the heat capacity of aluminum phosphide at high temperature were made in [18,19]. Due to the high error in heat capacity measurements, these data were not used. Data on the heat capacity of aluminum phosphide [20], obtained by optimizing the thermodynamic data of the Al-P system, show satisfactory agreement with our model calculations. The description of the heat capacities of Si and AlP phases was done by a multiparameter family of functions (3) (See Figure 11).
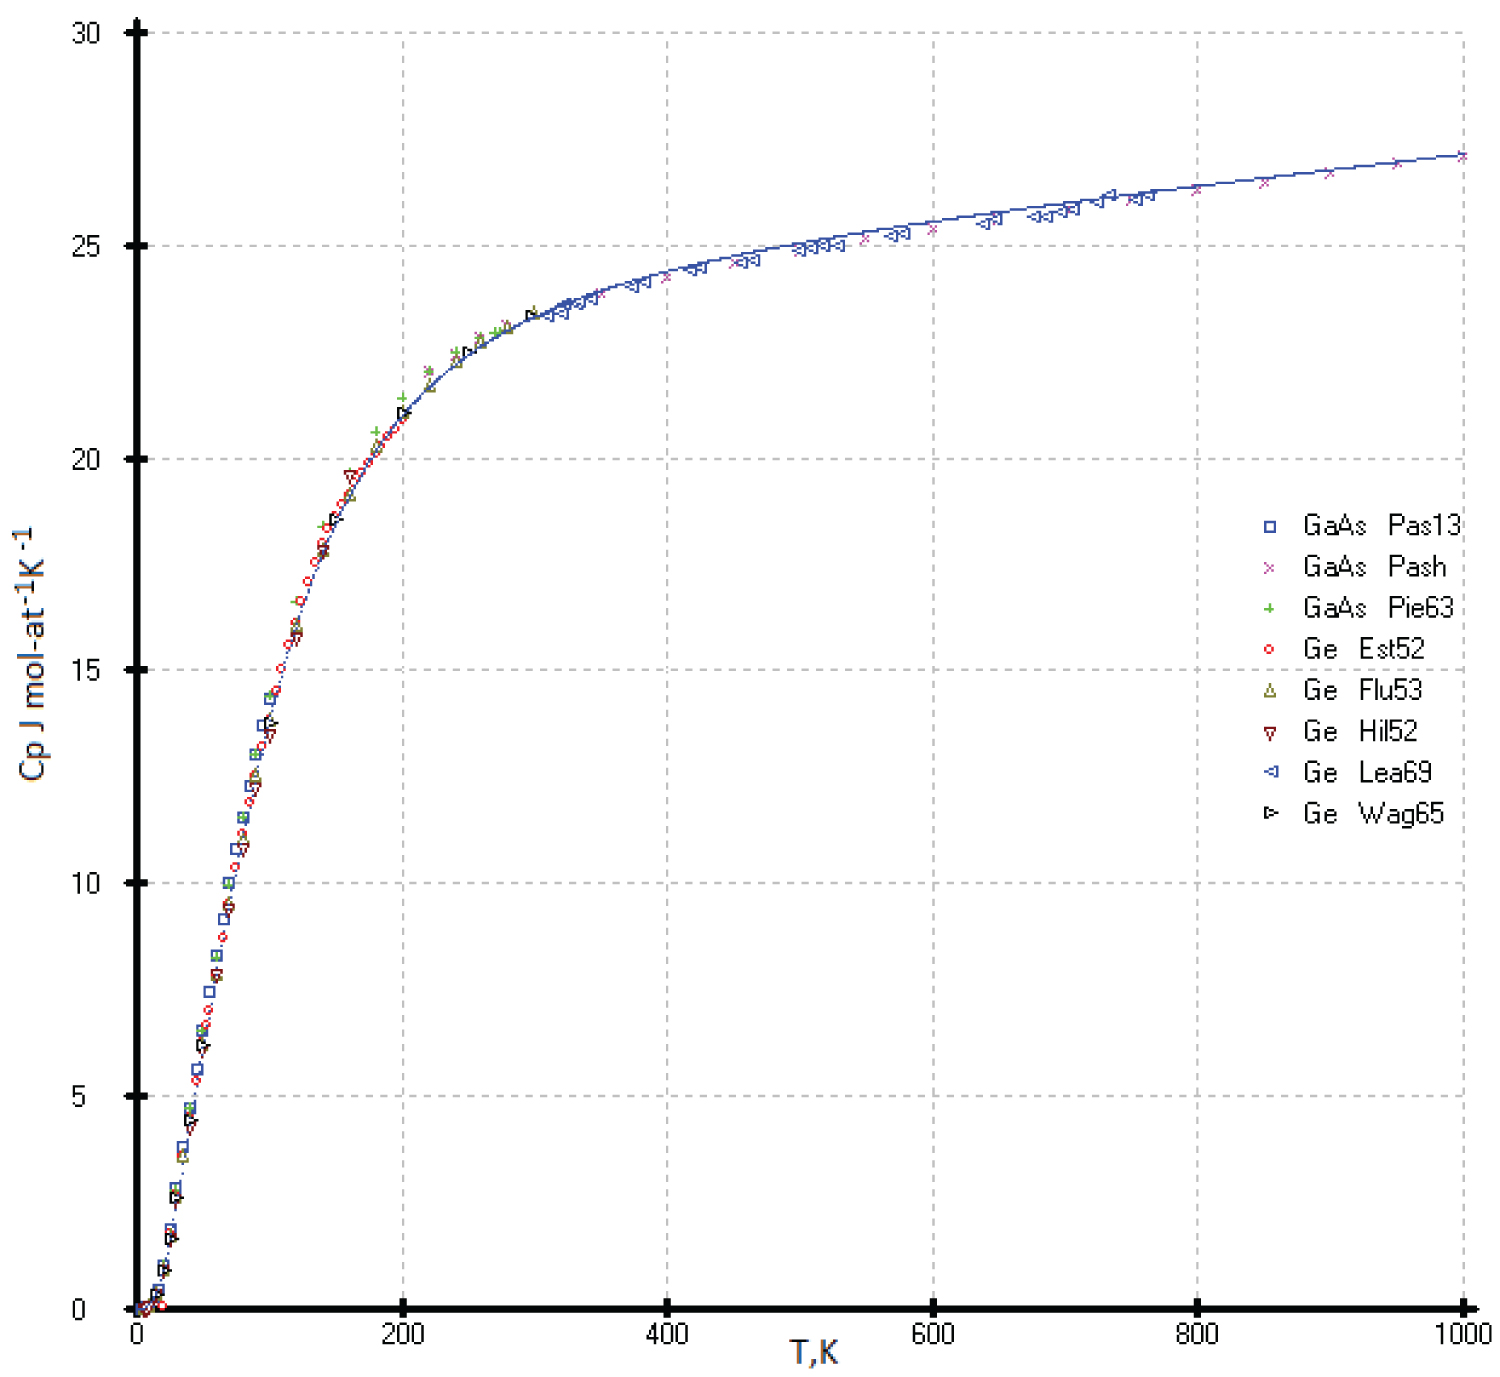
Germanium: Esterman and coworkers [12], studied the effect of alloying additions on the heat capacity of Ge at temperature range 20-200 K. They found the heat capacity of germanium with aluminum content up to 0.006 at. % gives a significant deviation up to 0.17 J·(mole-atom) -1 ·K -1 ) in comparison with pure germanium. A relatively light element Al was used in [12]. Impurities of heavier elements will lead to an even stronger deviation of the heat capacity of germanium from the actual values.
The selected values of the heat capacity of germanium and GaAs were taken from the following references: [12,21-24] and [25-27], respectively (Figure 11). All values of the heat capacity C p (T) of the two phases (Ge and GaAs) agree with each other within the experimental errors, as well as the model curve obtained in this work.
Gray tin (α-Sn) phase: The investigation of the heat capacity of gray tin (α-Sn) is difficult due to the kinetic features of the transformation of the white tin (β-Sn) into gray tin (α-Sn) and the presence of impurities of other elements. Most of the data on the heat capacity of gray tin were obtained in the first half of the twentieth century [28-30] and compiled in the Hultgren handbook [31].
During the process of the β → α phase transformation of the Sn samples subjected to prolonged exposure at low temperatures, insufficient nucleation was found, which are impurities of other elements, and additional nucleation was required at the kinetically optimal temperature of -45 °C (228K). The β → α transformation can be separated into two processes-nucleation and growth. The two processes occur at different rates, and nucleation is the critical event for tin pest formation. Nucleation is associated with long and uncertain incubation periods. Tin can spend anywhere from months to years in cold storage before developing observable signs of tin pest. Following nucleation, growth is relatively rapid, with 100% transformation to α-Sn observed to occur in as little as 30 days [32].
The phase transformation of β-Sn (I41/amd, (tetragonal cell with a = 0.5831 nm, c = 0.318 nm) into α-Sn (Fd3m, cubic cell with a = 0.6489 nm) below 286.4K has specific features. Heat capacity measurements β-Sn phase (99.998%) in the range 80- 373K showed that this phase remains unchanged [32]. Unfortunately, the heat capacity measurements were interrupted at 80 K due to a technical problem. The calculated coefficients of multi parameters function (2) cited in Table 2.
The impurities and closest crystal-chemical analogues of α-Sn, as InSb (F43m, a = 0.6478 nm) or CdTe (F43m, a = 0.641 nm), help transform β-Sn into α-Sn [33-35]. The phase transformation of β-Sn (99.9999%) to α-Sn can also occur in ice. In this case, α-Sn is formed when β-Sn comes into contact with the ice crystals in a closed system [36,37].
Measurements of the low-temperature heat capacity of a-Sn with a purity of less than 99.99%, or if there is an incomplete transformation of β-Sn to α-Sn, can give overestimated C p (T) values. Figure 12 demonstrates the experimental points of the InSb at the low temperature (0-10K) in comparison with calculated curves of the α-Sn (gray tin) and β-Sn (white tin) according to our model. Six experimental points [29], obtained in the temperature range 1.5-4K, are in the best agreement with our model. The experimental points [29] differ significantly as the temperature rises from 7 to 50 K, describing a peculiar hump (Figure 13). Therefore, we failed to describe the low-temperature heat capacities С р (Т) by a multiparameter function (2) of the elements of the 4th group in [6], for which there are similar deviations due to the presence of impurities. Comparison of the measured valued C p (T) a-Sn and InSb phase at low temperature with our model curves a-Sn (black) and b-Sn (green) phases is presented in Figure 12.
Thus, the heat capacities of Si and Ge from 0 to 300 K, and virtual point Cp ( 114 Fl) taken as constant were used as main control points. The heat capacities of diamond and other diamond-like phases as (α-Sn) and (HgTe) with a sphalerite (ZnS) structure served as auxiliary values. Our data on C p (T) for other phases with a sphalerite structure in the solid state are practically independent of the experimental values. To select the low-temperature heat capacities (C p ) of phases with a sphalerite structure, we used the dependencies Ln (C p /R) vs. Ln (N), where N is the number of elements of the Periodic Table (Figure 1). The general expression of a polynomial in the form
Where (5)
was used to describe the heat capacities of phases with a sphalerite structure. To describe the heat capacities from 15K to 140K, the last three terms of the polynomial were sufficient. The range of the heat capacities from 20K to 35K can be described by a straight-line equation. This gives us the possibility to find the point of intersection in Figure 1 with a precision up to 1% and equal 1.3 ± 0.013. Thus, the uncertainty of extrapolation C p (T) at high temperatures can be eliminated.
To describe the isotherms of high-temperature heat capacities of diamond-like phases with a sphalerite structure above room temperature, we used as main control points the re-optimized values C p (Si), C p (Ge), our experimental C p (HgTe) [17] and virtual point C p ( 114 Fl). All curves C p vs. (Ln(N)) are concentrated at one point with coordinates С р = 30.5 ± 0.3 J mol-at -1 K -1 with Ln(N), where N is the atomic number of element 114 ( 114 Fl) (See Figure 2).
In our recent publication [6], we have shown the enormous influence of impurities and the deviation from stoichiometry chemical compounds on the measured values of the specific heats. Only high-purity elements and strictly stoichiometric compounds can be used for low-temperature heat capacity measurements.
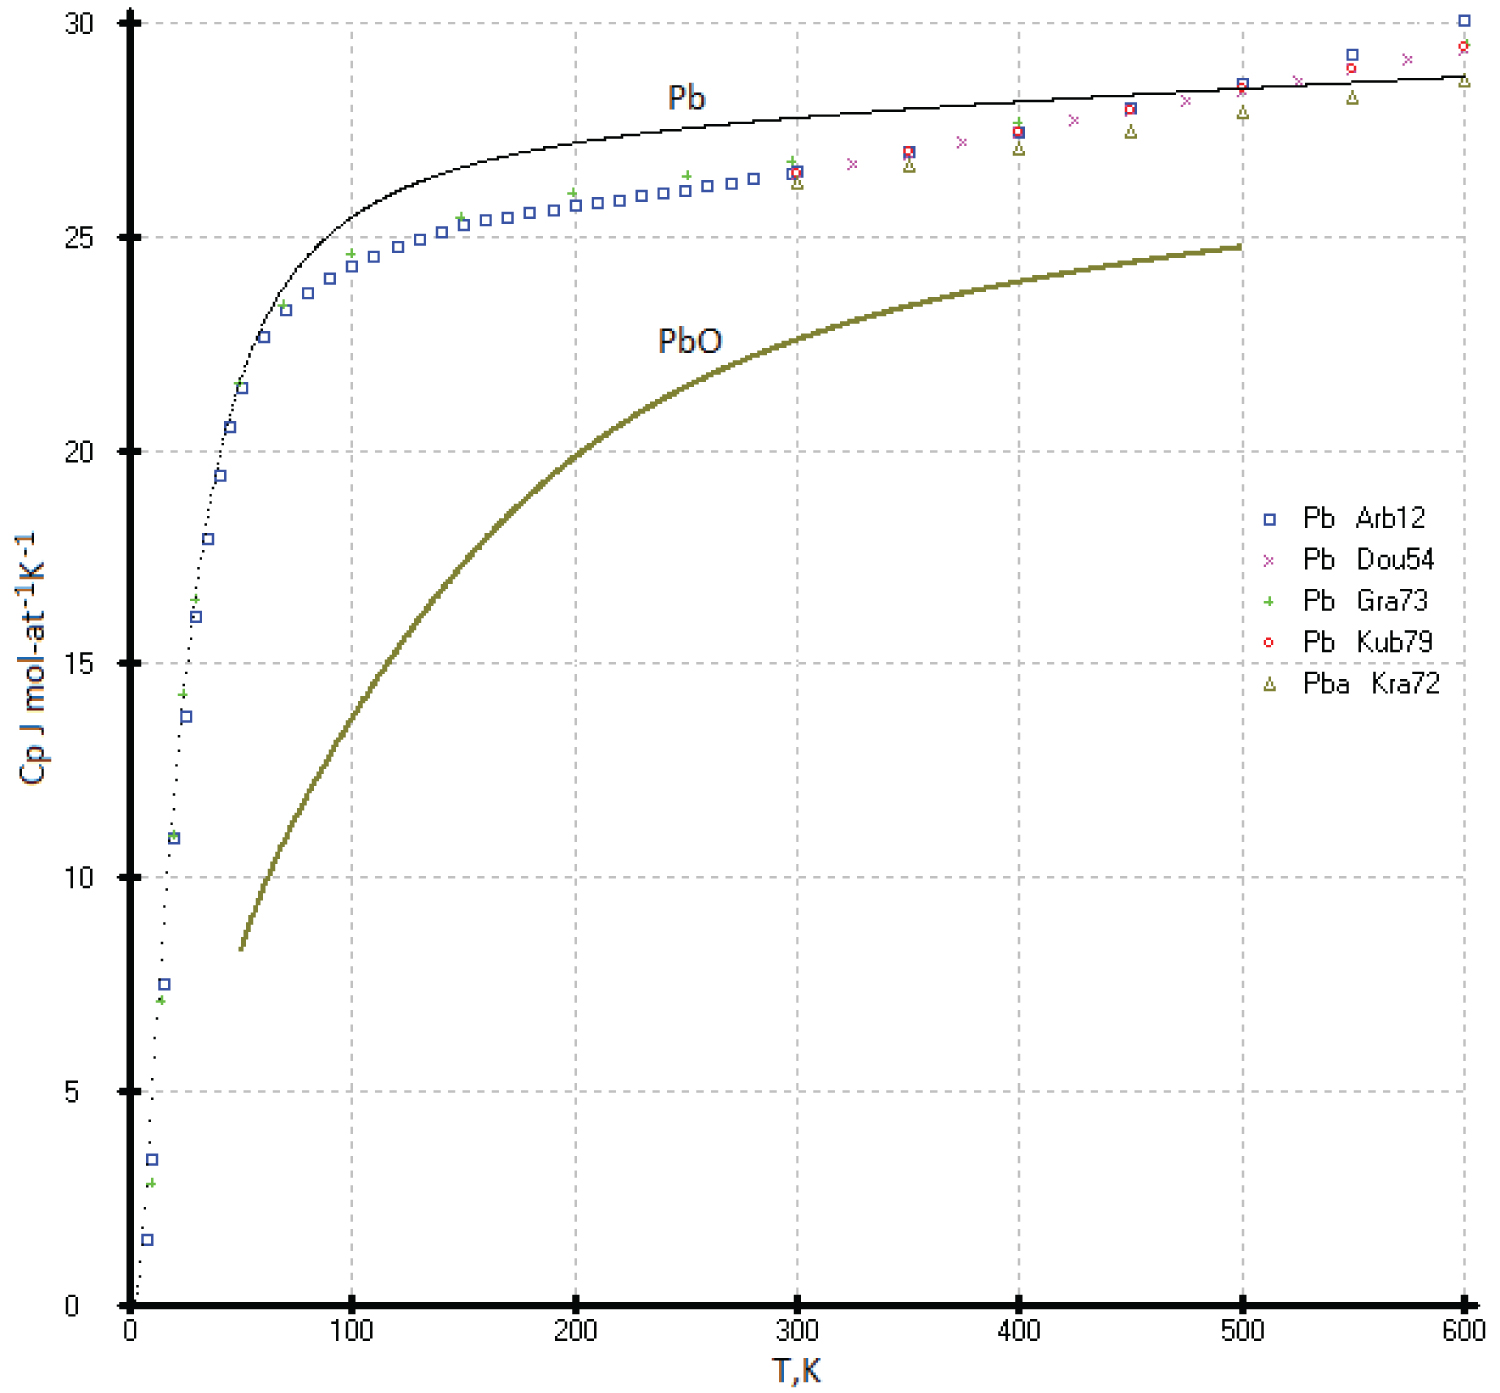
Heat capacities of the diamond-like lead (ZnS structure type) and Pb (fcc): The diamond-like form of lead was discovered quite recently, and the properties of this phase have not been studied at all. Everyone knows that ordinary lead crystallizes in a face-centered cubic ( fcc ) lattice (a = 4.9389 Å). It can be assumed that many of the physicochemical properties of the two modifications of lead will be very similar. In our opinion, the heat capacity of diamond-like lead and lead crystallizing in the fcc lattice should not differ greatly from each other. The heat capacity of lead crystallizing in the fcc lattice was studied in [38,39].
The problem of taking into account the premelting effect when measuring the heat capacities of low-melting metals such as indium, tin, lead, zinc, cadmium, and aluminum remains open. Let's take lead as an example. In experimental works [38,39] the effect of premelting was clearly established when measuring the heat capacity at temperatures long before their melting, 200 degrees before the melting point of the substance. The greatest premelting effect is caused by various impurities of low-melting metals (purity of Pb 99.995% [39] and 99.9%, [38] which form eutectics with lead: Pb-Bi ( T eut. = 398.1K), Pb-Sn ( T eut. = 456.1K), Pb-Mg ( T eut. = 521.8K) or eutectics between the impurities themselves: Bi-Sn ( T eut. = 412.1K), Bi-In ( T eut. = 351.6K).
These eutectics form micro-heterogeneous phases (liquid + solid) which significantly affect heat capacity measurements. The presence of lead oxide in the sample, the heat capacity of which is much lower than pure lead, should also be taken into account.
The presence of an oxide film (PbO) gives an underestimated value of the heat capacity of lead С р (T) (See Figure 14).
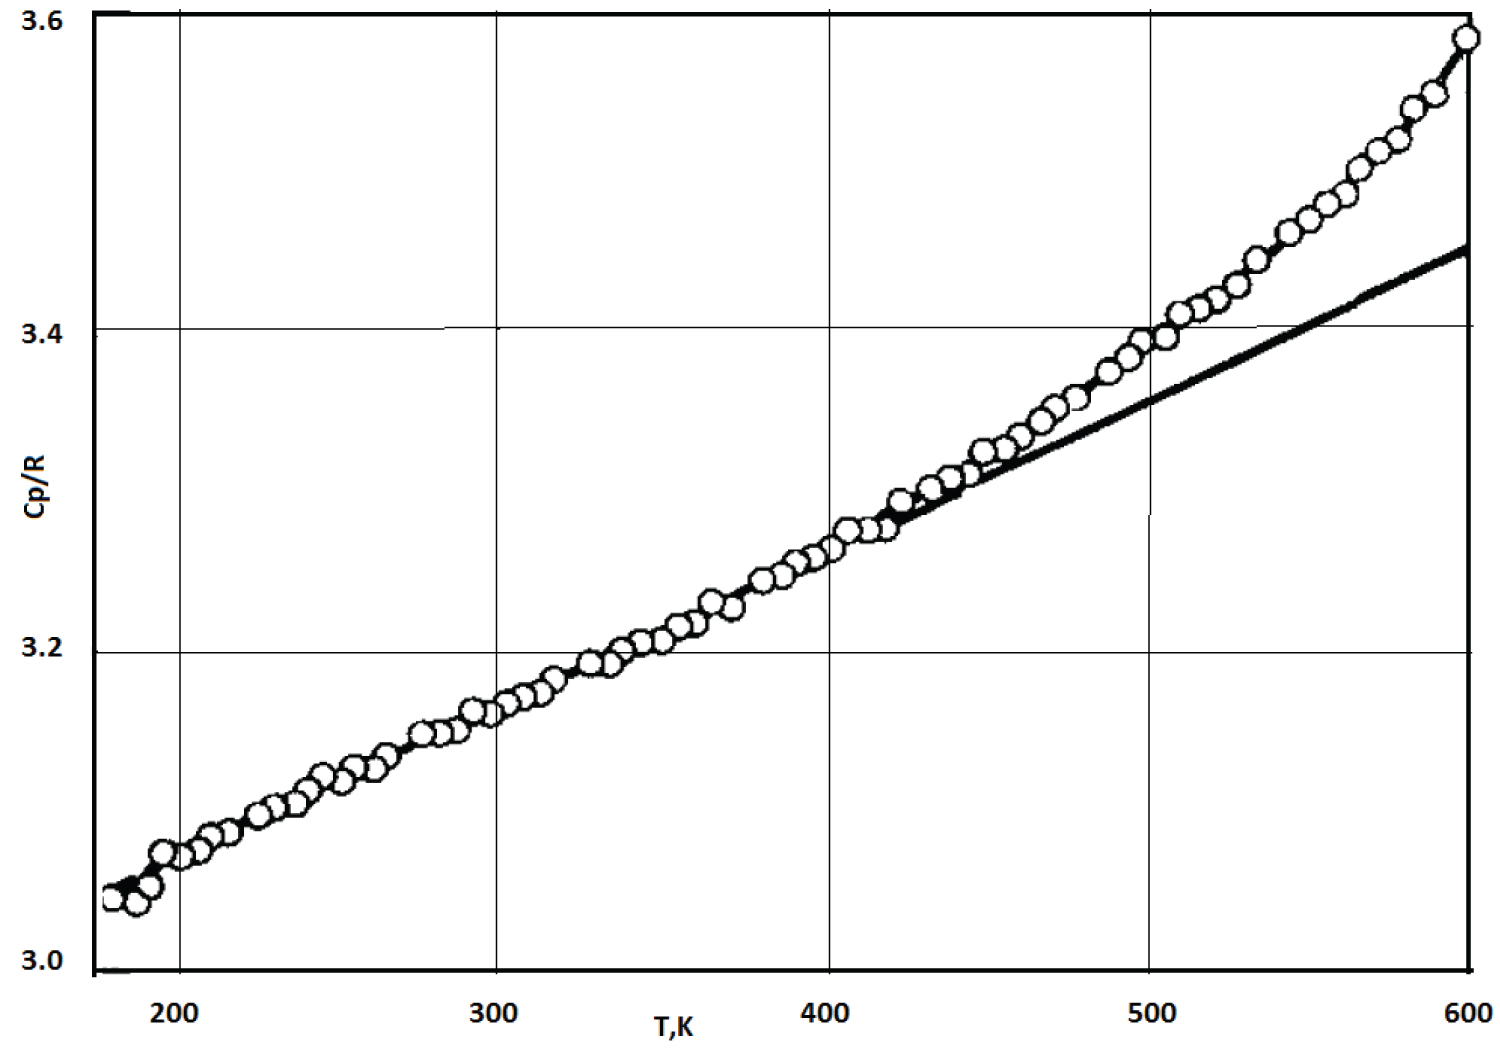
In addition, the effect of premelting, as a rule, is due to an exponential increase in the concentration of structural defects and dislocations in a crystal as its temperature approaches the melting temperature (Figure 15).
In our opinion, the heats of the two allotropic forms of lead (face-centered cubic ( fcc ) and ZnS structure) should be close to each other, and all deviations of the experimental values of C p (T) from the model curve are caused by the influence of impurities (Figure 14).
Heat Capacities of the Binary Diamond-Like Compounds
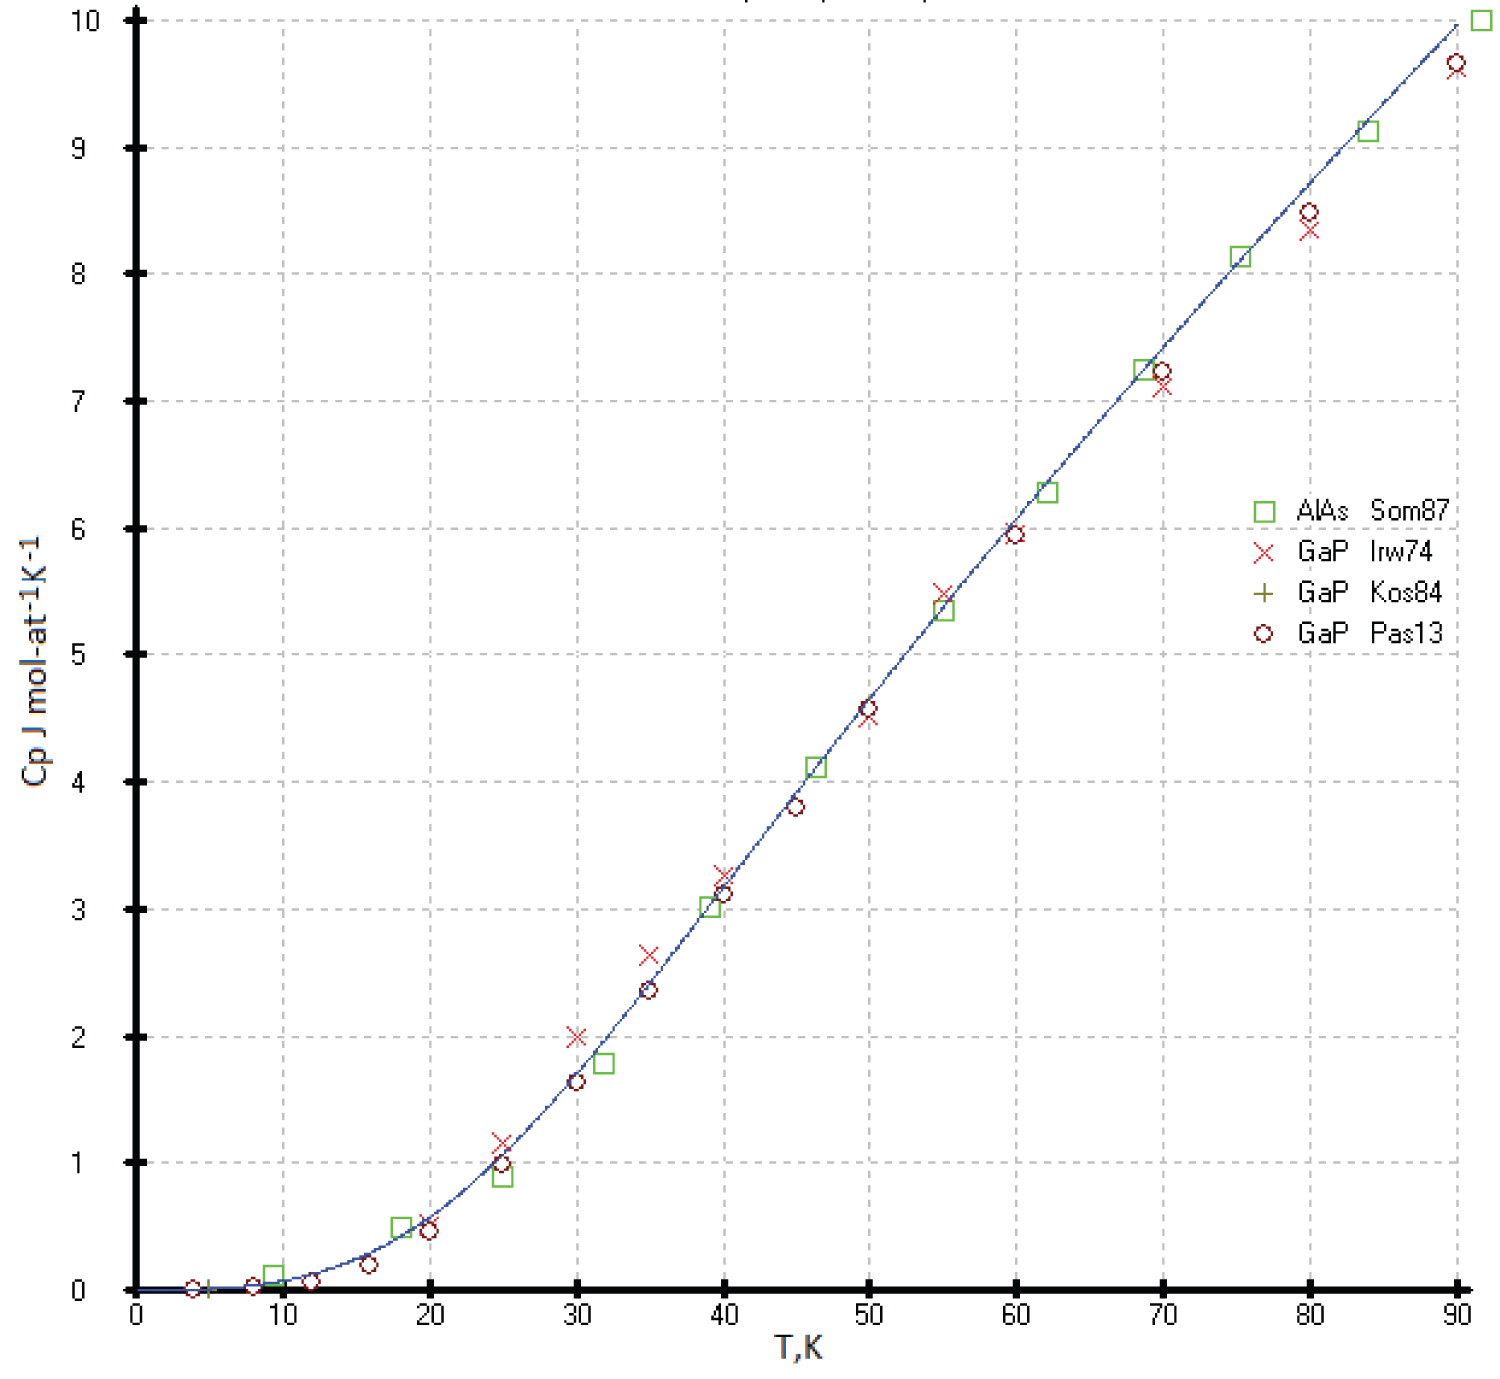
Heat capacities of the AlAs and GaP phases
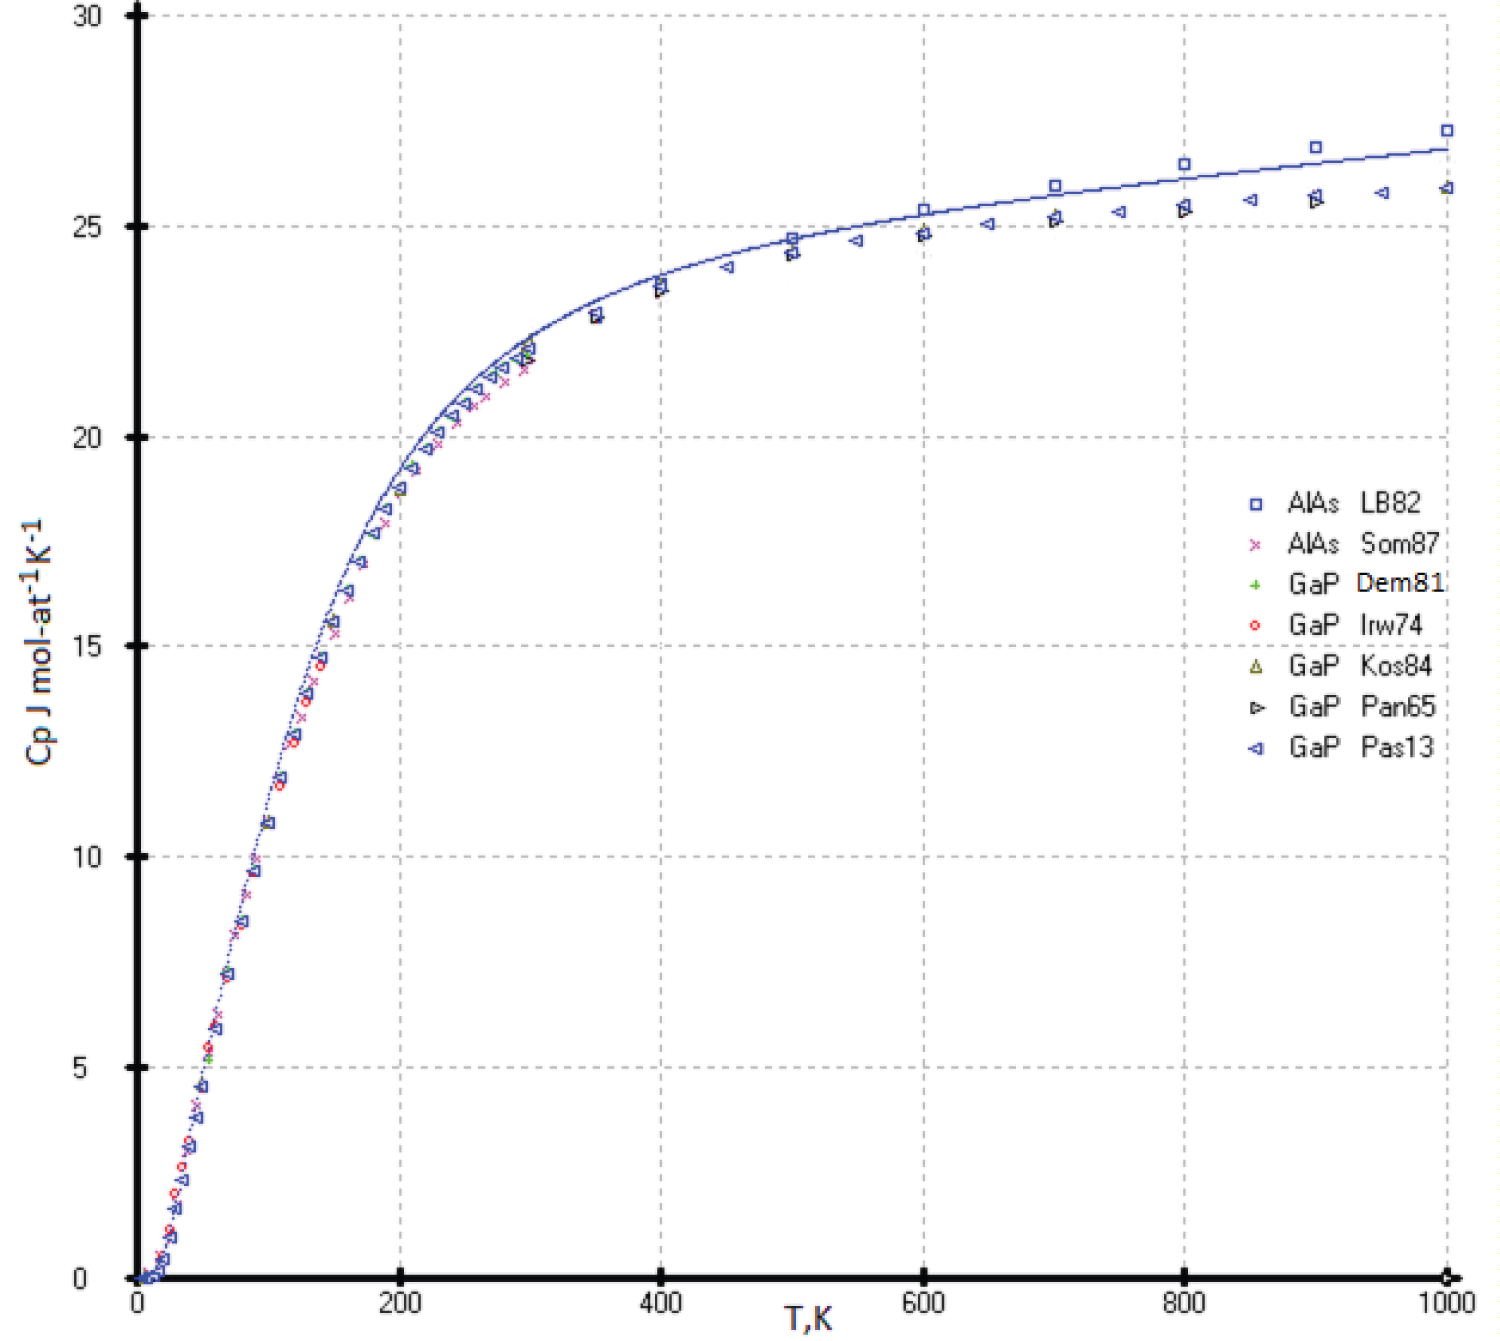
Aluminum compounds with phosphorus (AlP) and arsenic (AlAs) are unstable in air. They are hygroscopic and readily react with moist air to form phosphine (PH 3 ) and arsine (AsH 3 ) [17]. The vapor pressure of the phosphor of indium and gallium phosphides increases exponentially when heated and reaches several atmospheres at T = 1200K [43]. Consequently, the study of the heat capacity of these phases is difficult (Figure 16).
The heat capacity curve C p (T) calculated by our model is somewhat higher than the experimental measurements [44-48] and the compiled values [27,49], except for the reference values [44], which lie higher than our results. The low-temperature values of the heat capacity below 80K agree with ours within the limits of determination errors (Figure 17).
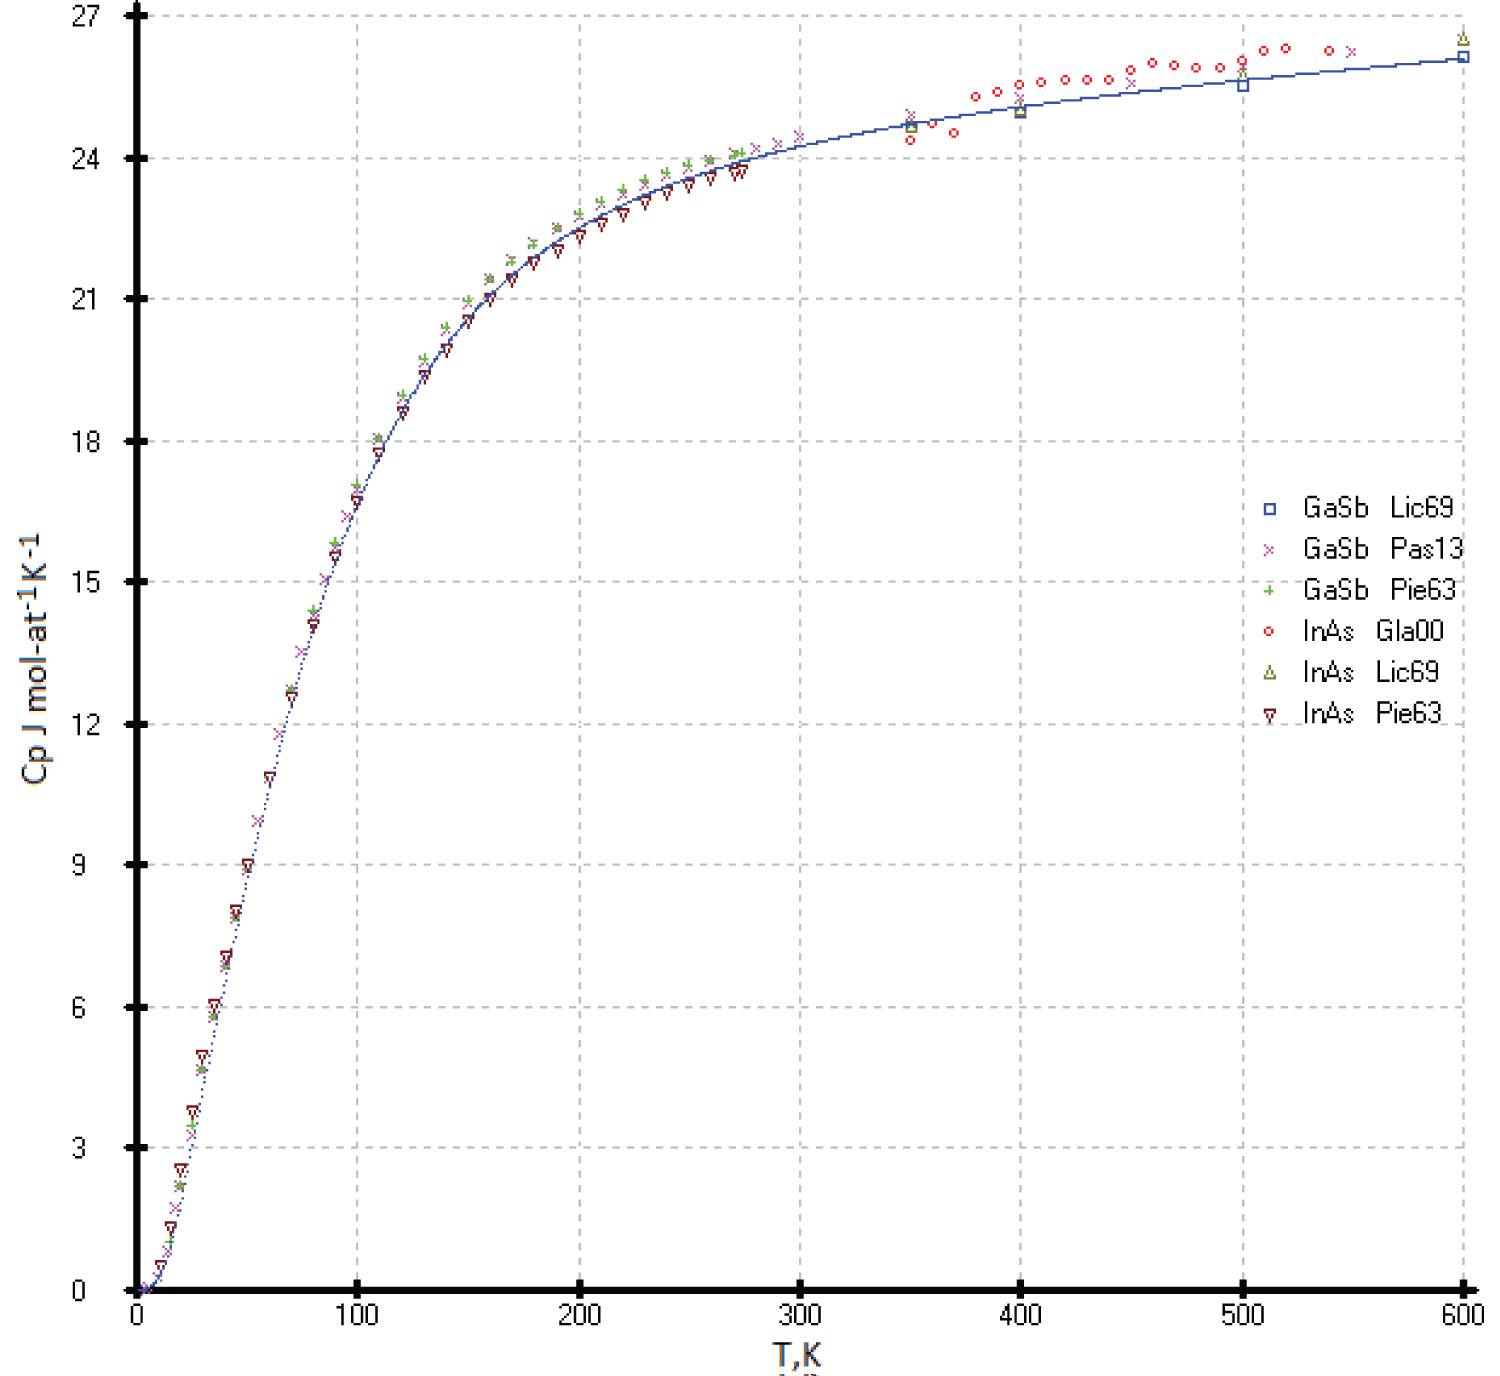
Heat capacities of the InAs and GaSb phases
The experimental values of heat capacities of the InAs and GaSb phases and our model calculation are consistent within the limits of determination errors (Figure 18).
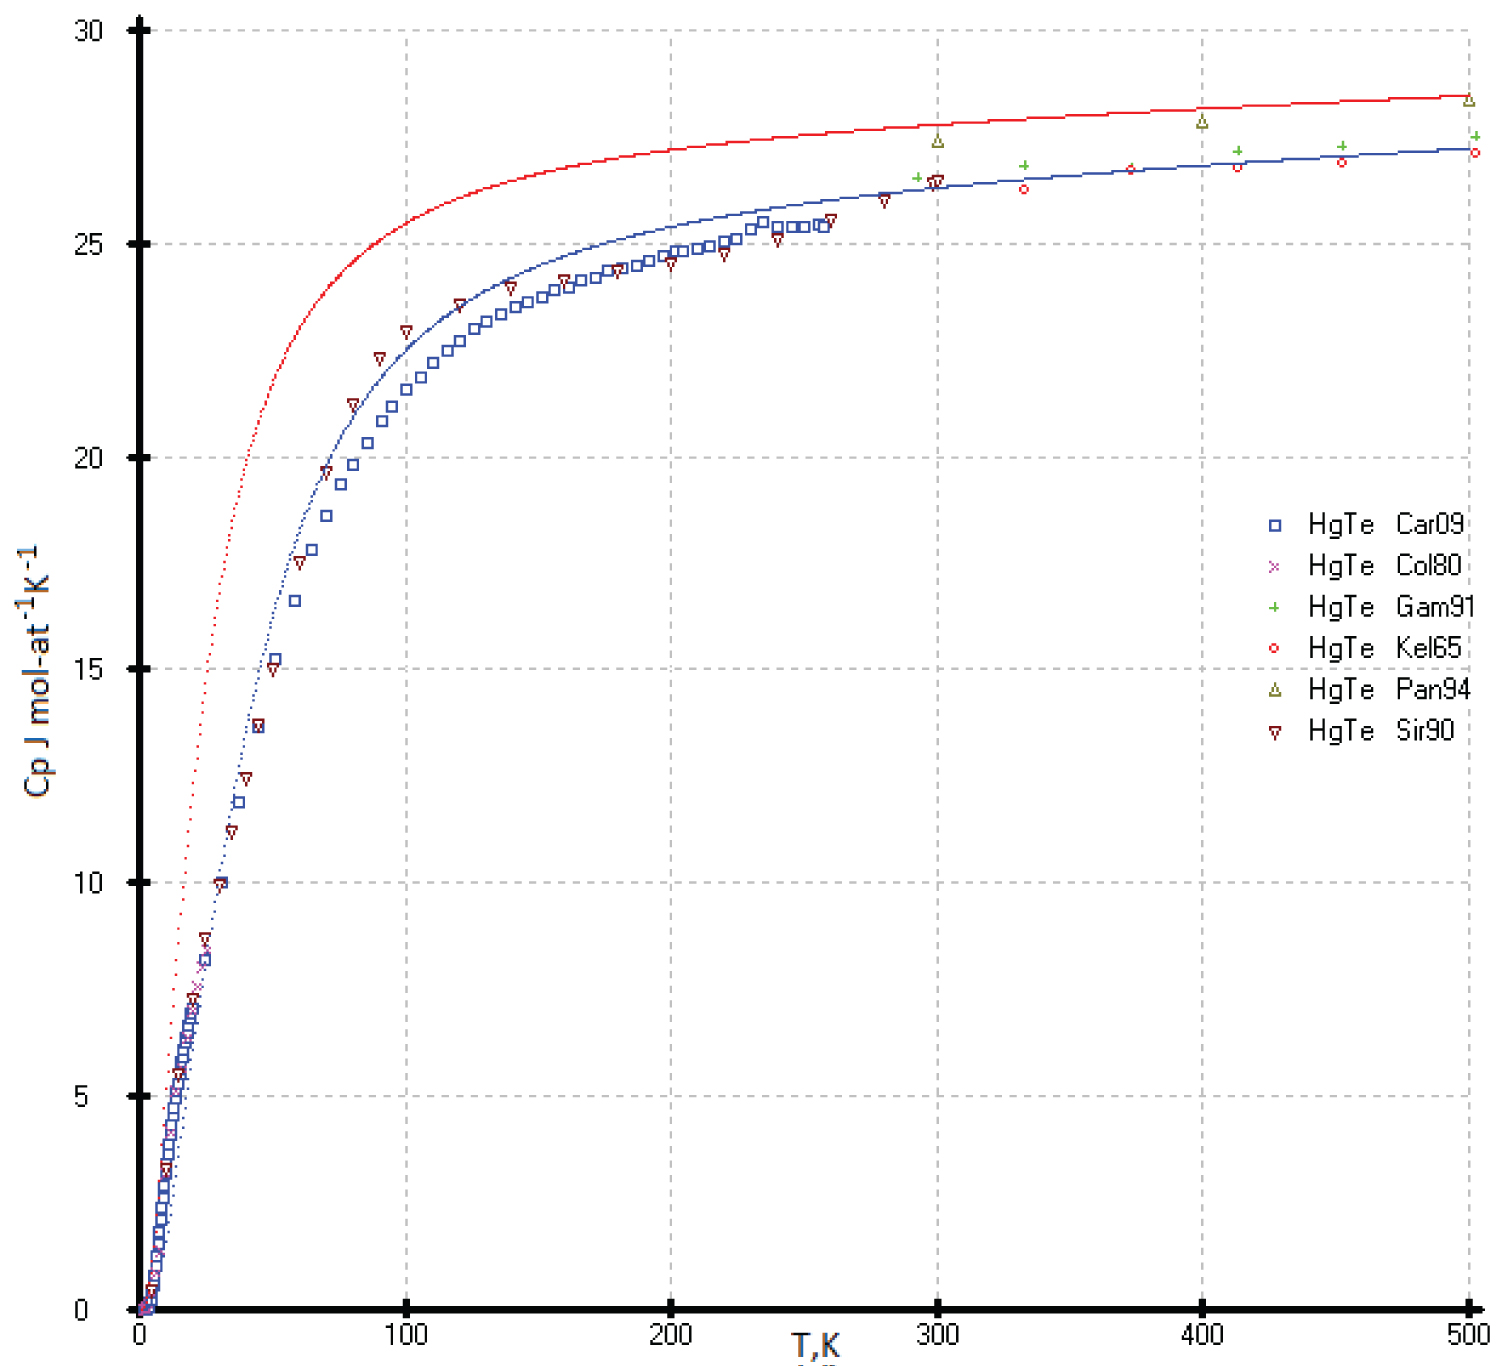
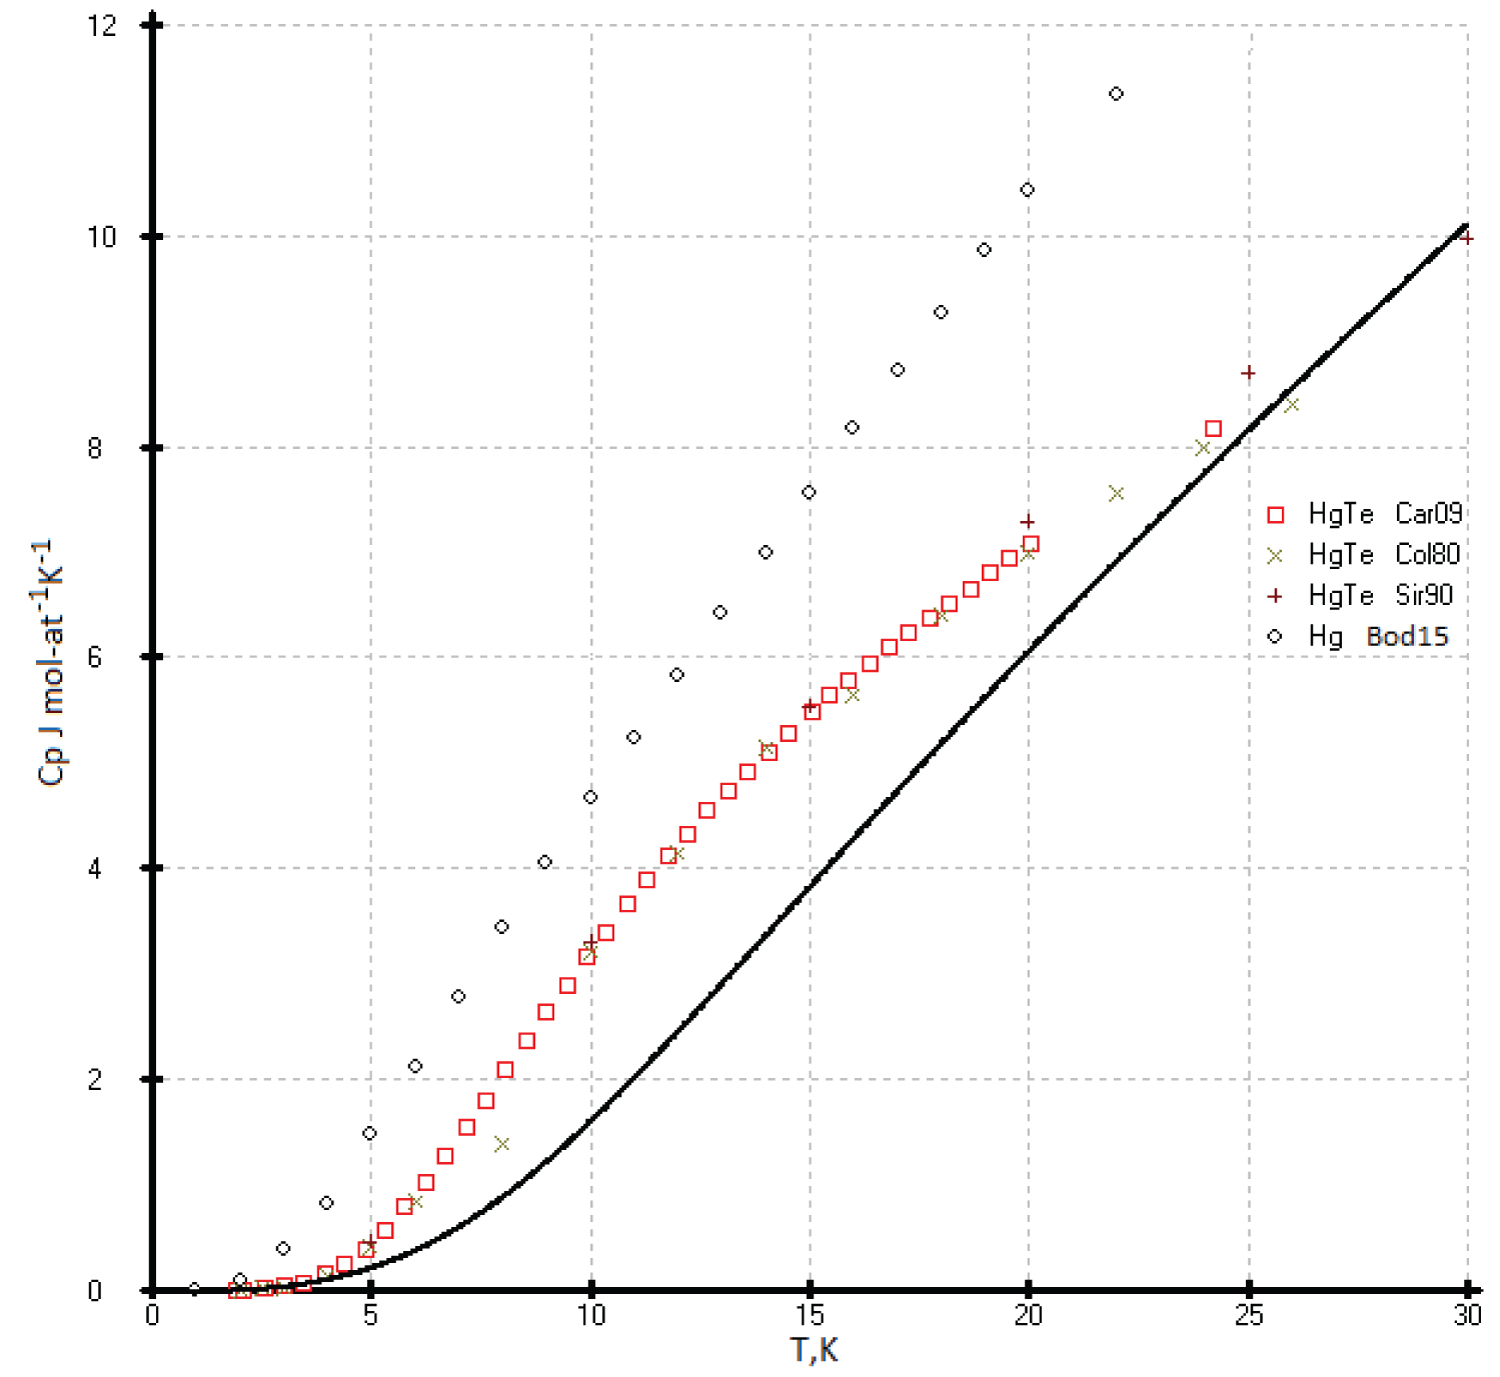
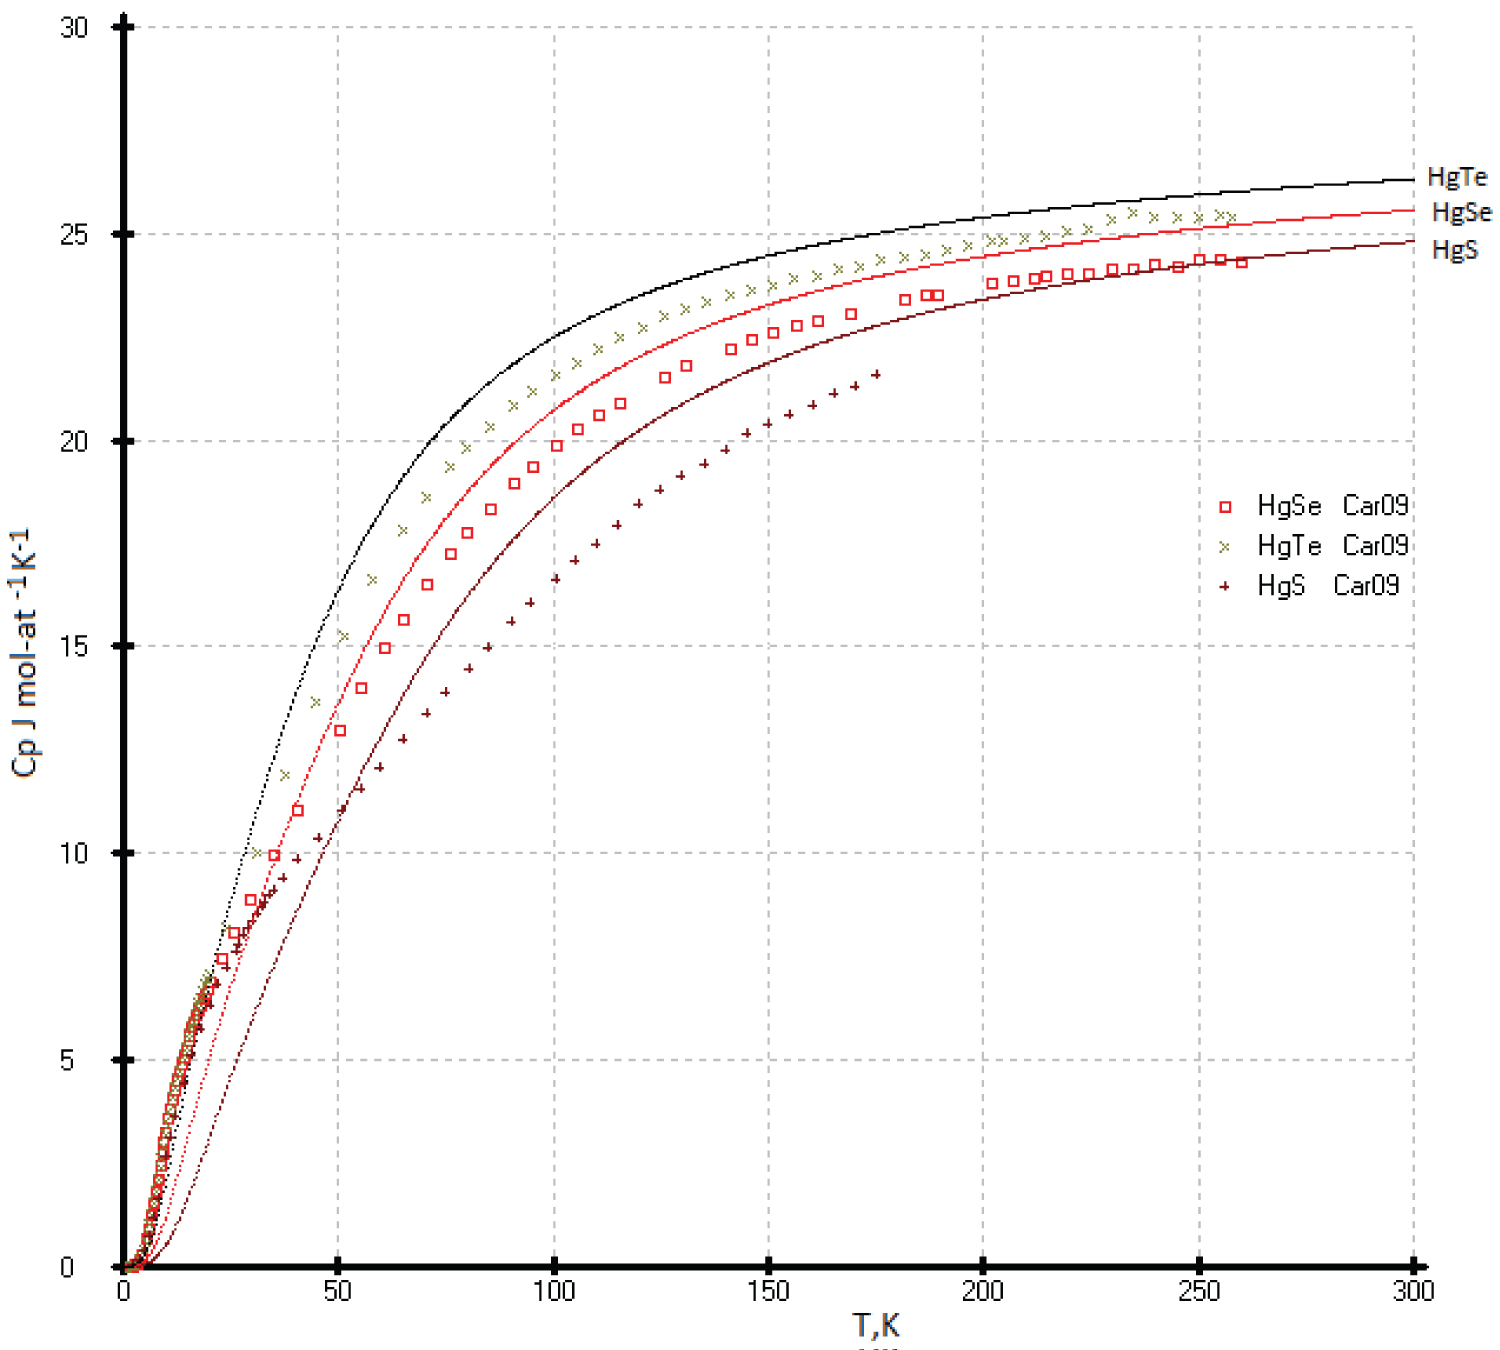
Heat capacities of the chalcogenides of mercury
Heat capacities of the HgTe: The C p(T) of the HgTe phase at high temperature was calculated using our previous results [53] and literature data [55]. The data proposed in the handbook [49] are above that identified in experimental [53,55] and our calculated data, and they fall on the calculated curve of diamond-like lead (Figure 19).It is possible that the deviation of the experimental values of the heat capacity C p (T) for HgTe from our model values is due to the phase transition of the quantum Hall effect (QHE), which was found in [57] in the range of 3-30K (Figure 20). The effect of excess mercury in its telluride in this temperature range is also not ruled out [58]. So, we chosen the low temperature heat capacities of the HgTe phase as the ideal cristal from the corresponding equations of the isotherms Ln( C p /R) vs. Ln(N) (Figure 1). If necessary, excess heat capacity in the range of 3-30K can be taken into account. It can be assumed that a phase transformation (QHE) also exists for the HgSe and HgS phases (See Figure 20, Figure 21 and Figure 22).
Heat Capacities of the Nitrides of III Group with Sphalerite Structure
Using function (3), the heat capacities of aluminum, gallium, indium, thallium, and virtual nihonium nitrides with a zinc blende type structure were obtained. The adjustable parameters of function (3) are presented in Table 1.
Relation of the Thermodynamic and Physical Parameters Vs. Atomic Numbers of Elements
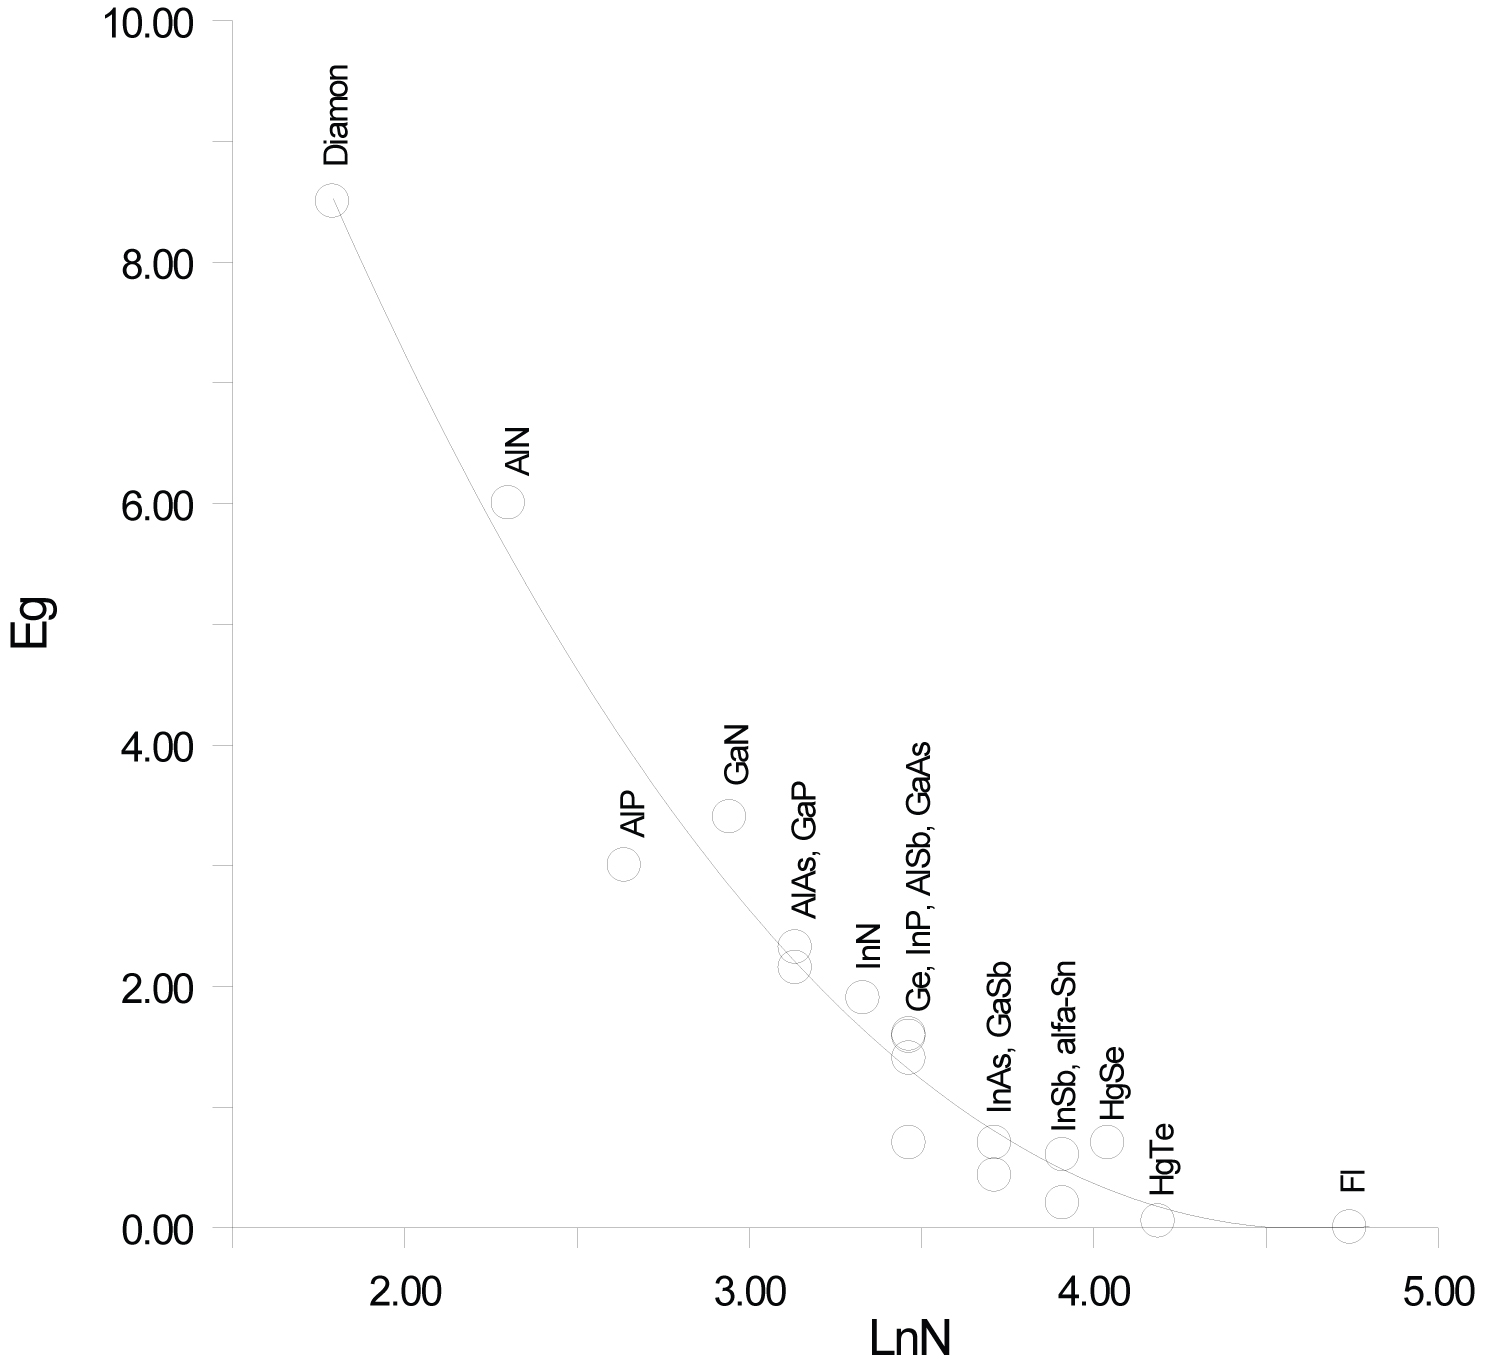
Previously, we established a correlation between the standard thermodynamic functions of formation and the atomic numbers of the elements that make up compounds with the structure of zinc blende. In most cases, these correlations follow a linear relationship with a correlation coefficient ( r ) close to 1 [41]. In this paper, it is shown that the heat capacity isotherms of diamond-like phases also correlate with the atomic numbers of the elements (Figure 2). These dependences are described by polynomial equations. If we consider the low-temperature dependences of the heat capacity in the form Ln(C p /R) vs. Ln(N), then they obey a linear approximation, or are very close to it (Figure 1). The parameters of the multiparameter function (3) (Table 1) can also be described by polynomial equations (Figure 4, Figure 5, Figure 6, Figure 7 and Figure 8). In this case, breaks or inflection points occur in germanium (Ge) and its analogues GaAs, AlSb, and InP, having the same atomic number on mole-at of element or compound. The Ge, GaAs, AlSb, and InP phases can be considered as the boundary between wide-gap and narrow-gap semiconductors (Figure 23).
The band gap parameters also obey the correlation dependence. The dispersion of E g values is due to the presence of phase deviations from their stoichiometric composition, foreign inclusions, defects, or dislocations, since the parameter E g depends very much on the history of the sample. The E g values taken from reference [59].
Conclusion
1. An unconventional approach was used to optimize the heat capacities of isostructural diamond-like phases as a single system using the multiparameter family of functions (3). The uncertainty in the extrapolation of C p (T) at high temperatures is eliminated due to the tight binding of the heat capacity values to one point.
2. The Maier-Kellye equation is quite suitable for describing the heat capacity of the high-temperature region from T o -T m K.
3. One of the main advantages of the presented work is the method for determining the reference point of the high-temperature heat capacity based on the low-temperature heat capacity and its application to various classes of isostructural compounds.
4. A convenient method has been found for describing low-temperature heat capacities, which makes it possible to avoid measurement errors associated with deviations from stoichiometry, crystal structural defects, and impurities.
5. By using an unconventional approach, we were able to optimize the heat capacities of the sphalerite phases in the solid state. Therefore, the extension of this study to other isostructural phases seems possible and promising.
6. The main rule for a set of isostructural phases is the absence of intersections of the heat capacity curves C p (T) with each other.
7. Thus, the heat capacities C p (T) for diamond-like phases with a sphalerite structure were revised in accordance with this new concept. A new description of the heat capacity of gray tin is proposed in accordance with the analysis of the entire class of sphalerite diamond-like phases: Si and AlP, Ge and GaAs, GaP and AlAs, GaAsb and InAs, gray tin and InSb, as well as CdTe, HgS, HgSe, HgTe and Pb.
8. The calculated heat capacities C p (T) of sphalerite structure are recommended for placement in the hand books. Such data allow one to optimize the thermal conditions of crystal growth and perform calculations necessary for vapor phase epitaxy. They are also necessary for the development of the theory of solid state physics.
Acknowledgements
The authors express deep gratitude to Prof. R. K. Kremer (MPI fuer Festkoerperforschung, Stuttgart, Germany) for providing experimental data on the heat capacity of mercury chalcogenides. We would like to thank Prof. R. Pässler, Technische Universität Chemnitz, Institute für Physik, Chemnitz, Germany, J.-C. Gachon, Prof. of Physics, (Henry Poincare University (Nancy 1, France); J.P. Bros, Prof. of Chemistry, (Polytechnic University, Marseille, France), Alex Taldrik, PhD in Chemistry (Institute of Superconductivity and Solid State Physics, Moscow, Russia) for the useful discussion, and Prof. Lorie Wood from the University of Colorado (USA) for the language help. This work was financially supported by the Russian Foundation for Basic Research (project no. 19-08-01723).
References
- Krygier A, Powell PD, McNaney JM, et al. (2019) Extreme hardening of Pb at high pressure and strain rate. Phys Rev Lett 123: 205701.
- Oganessian YT (2020) Periodic table after 150 years. Bulletin of the Russian Academy of Science 90: 207-213.
- Sommerfeld A (1916) Zur Quantentheorie der Spektrallinien. Annal Phys 356: 1-4.
- Garrone E, Areán CO, Bonelli B (2017) How many chemical elements are there in the universe? A (not so) Bohring Question. World Journal of Chemical Education 5: 20-22.
- Vassiliev VP (2021) Optimization of the heat capacities of diamond-like compounds. Journal of Materials Science and Engineering B 11: 76-80.
- Vassiliev VP, Taldrik AF (2021) Description of the heat capacity of solid phases by a multi parameter family of functions. Journal of Alloys and Compounds 872: 159682.
- Desnoyers JE, Morrison JA (1958) The heat capacity of diamond between 12•8° and 277°K. Philosophical Magazine 3: 42-48.
- Victor C (1962) Heat capacity of diamond at high temperatures. J Chem Phys 36: 1903-1911.
- Vasil’ev O, Muratov VB, Duda TI (2010) The study of low temperature heat capacity of diamond: Calculation and experiment. Journal of Super Hard Materials 32: 375-382.
- Devyatykh GG, Gusev AV, Gibin AM, et al. (1997) Heat capacity of high-purity silicon. Russian Inorg Materials 33: 1206-1209.
- Timofeev V (1999) The heat capacity of high-purity silicon, Ph.D. Specialty 02.00.19 Nizhny Novgorod.
- Flubacher P, Leadbetter AJ, Morrison JA (1959) The heat capacity of pure silicon and germanium and properties of their vibrational frequency spectra. Philosoph. Magazine 39: 273-294.
- Desai PD (1986) Thermodynamic properties of Iron and Silicon. J Phys Chem Ref Data 15: 967-983.
- Glazov VM, Pashinkin AS (2001) The thermodynamic properties (heat capacity and thermal expansion) of single-crystal silicon. High Temperature 39: 413-419.
- Neviak SO, Sandulova AV (1974) Thermodynamic characteristics of AlP. Inorg Materials 10: 146-147.
- Wagman DD, Evans WH, Parker VB, et al. (1965) Nat. Bur. Standards Techn. Note 270-1 Washington, October 1, 1965
- Brönsted JN (1914) Studien zur chemischen Affinität, IX. Die allotrope Zinn Umwandlung. Z Phys Chem 88U: 479-489.
- Endo RK, Fujihara Y, Susa M (2006) Calculation of the heat capacity of silicon by molecular dynamic simulation. High Temperature-High Pressure 36: 505-511.
- Wright JT, Carbaugh DJ, Haggerty ME, et al. (2016) Thermal oxidation of silicon in a residual oxygen atmosphere -the RESOX process- for self-limiting growth of thin silicon dioxide films. Semiconductor Science and Technol 3: 105007.
- Holleman AF, Wiberg E, Nils W (2001) (1st) Inorganic Chemistry. Berlin: Academic Press/De Gruyter.
- Yamagouchi K, Itagaki K, Yazawa A (1989) High temperature heat content measurements of the III-V (III: Al, Ga, In; V: N, P, As, Sb) compounds. Journal of the Japan Institute 53: 764-770.
- Liang SM, Schmid-Fetzer R (2013) Thermodynamic assessment of the Al-P system based on original experimental data. CALPHAD 42: 76-85.
- Estermann I, Weertman JR (1952) Specific heat of germanium between 20°K and 200°K Journal of Chemical Physics 20: 972-976.
- Hill RW, Parkinson DH (1952) The specific heats of germanium and grey tin at low temperatures. Philosophical Magazine 43: 309-316.
- Leadbetter AJ, Settatree GR (1969) An harmonic effects in the thermodynamic properties of solids VI. Germanium: Heat capacity between 30 and 500 °C and analysis of data. J Phys C: Solid State Phys 2: 1105-1112.
- Pashinkin AS, Fedorov VA, Malkova AS, et al. (2010) Heat capacity of GaBV and InBV (BV = P, As, Sb) above 298 K. Inorg Mater 46: 1007-1012.
- Piesbergen U (1962) Die durchschnittlichen Atomwärmen der AIIIBV Halbleiter AlSb, GaAs, GaSb, InP, InAs, InSb und die Atomwarme des Elements Ge zwischen 12-273 ?. Naturwissenschaften l8a: 141-147.
- Passler R (2013) Non-Debye heat capacity formula refined and applied to GaP, GaAs, GaSb, InP, InAs, and InSb AIP Advances 3: 082108.
- Webb FJ, Wilks J (1955) The measurement of lattice specific heats at low temperatures using a heat switch. Proc Roy Soc 230: 549-559.
- Bodryakov VY, Babintsev YN (2015) Mutial analysis of the heat capacity and thermal expansion of the solid mercury. Physics State Solidy 57: 1240-1244.
- Lange F (1924) Untersuchungen uber die spezifische Warme bei tiefen Temperaturen. Z Phys Chem Leipz 110: 343-362.
- Hultgren R, Desai PD, Hawkins DT, et al. (1973) Selected values of the thermodynamic properties of the elements. American Society for Metals.
- Ohmura Y (1965) Specific heat of indium antimonide between 6 and 100°K. J Phys Soc Jpn 20: 350-353.
- Zeng G, McDonald SD, Gu Q, et al. (2015) Kinetics of the β → α Transformation of tin: Role of α-tin nucleation. Cryst Growth Des 15: 5767-5773.
- Khvan AV, Babkina T, Dinsdale AT, et al. (2019) Thermodynamic properties of tin: Part I Experimental investigation, abinitio modelling of α-, β-phase and a thermodynamic description for pure metal in solid and liquid state from 0 K. CALPHAD 65: 50-72.
- Risold D, Nagata JI, Suzuki RO (1998) Thermodynamic description of the Pb-O system. J Phase Equilibria 19: 213-233.
- Styrkas D (2003) Growth of gray tin crystals. Inorg Materials 39: 683-686.
- Styrkas D (2005) Preparation of shaped gray tin crystals. Inorg Materials 41: 580-584.
- Douglas TB, Dever JL (1954) Heat capacity of lead from 0 to 900°c, and the heat capacity of the lead-bismuth eutectic alloy from 150 to 800°c. J Am Chem Soc 76: 4826-4829.
- Kramer W, Nölting J (1972) Anomale spezifische Wärmen und fehlordnung der Metalle Indium, Zinn, Bleu, Zink, Antimon und Aluminium. Acta Metallurgica 2: 1353-1359.
- Arblaster JW (2012) Thermodynamic properties of lead. CALPHAD 39: 47-53.
- Gray DE (1972) American Institute of Physics Handbook, 3rd ed.; McGraw-Hill: New York, NY, USA.
- Kubaschewski, Alcock CB (1979) Metallurgical thermo chemistry. Oxford, New York, Pergamon Press, 1979.
- Vassiliev VP, Legendre B, Zlomanov VP (2011) The critical analysis and mutual coherence of the thermodynamic data of the AIIIBV phases. Intermetallics 19: 1891-1901.
- (1982) The Landolt-Börnstein Database.
- Matsuo Kagaya H, Soma T (1987) Specific heat and thermal expansion coefficient of AlP, AlAs and AlSb. Solid State Communications 62: 707-709.
- Demidenko AF, Koschenko VI, Pashinkin AS, et al. (1981) Low-temperature heat capacity of gallium phosphide. Russ Inorg Mater 17: 677.
- Lichter BD, Sommelet P (1969) Thermal Properties of AIIIBV Compounds. I. High-temperature heat constants and heat fusion of InSb, GaSb, and AlSb. Trans Met 245: 99-105.
- Irwin JC, Lacomb J (1974) Specific heats of ZnTe, ZnSe, and GaP. J Appl Phys 45: 567-573.
- Koshchenko VI, Grinberg YK, Demidenko AF (1984) Temperature changes of thermodynamical AlN (5-2700 K), GaP (5-1500 K) and BP (5-800 K) functions were determined according to results of measuring specific heat of AlN, GaP and BP for 5-300 K. Inorg Mater 20: 1550-1553.
- Pankratz LB (1965) High-temperature heat contents and entropies of gallium phosphide indium phosphide and indium sulphide. US Bureau of Mines Rep Invest 6592.
- Glazov VM, Pashinkin AS (2000) Thermal expansion and heat capacity of GaAs and InAs. Inorg Mater 36: 225-231.
- Cardona M, Kremer RK, Lauck R, et al. (2009) Electronic, vibrational, and thermodynamic properties of metacinnabar β-HgS, HgSe, and HgTe. Phys Rev B 80: 195204.
- Gambino M, Vassiliev V, Bros JP (1991) Molar heat capacities of CdTe, HgTe and CdTe-HgTe alloys in the solid state. J Alloys Compd 176: 13-24.
- Collins JG, White GK, Birch JA, et al. (1980) Thermal expansion of ZnTe and HgTe and heat capacity of HgTe at low temperatures. J Phys C: Solid State Phys 13: 1649-1656.
- Kelemen F, Cruceanu E, Miculescu D (1965) Untersuchung einiger thermischer Eigenschaften der Verbindungen HgSe, HgTe und ZnTePhys State Solidi 11: 865-872.
- Sirota NN, Gavaleshko PP, Novikova VV, et al. (1990) Heat capacity and thermodynamic functions of solid solutions (CdTe)x(HgTe)1-x in the range of 5-300K. Russ J Phys Chem 64: 1126-1130.
- Arapov YG, Gudina SV, Neverov VN, et al. (2015) Temperature scaling in quantum Hall effect regime in the HgTe quantum well with an inverted energy spectrum. Semiconductors 49: 1545-1549.
- Kikoin IK (1976) Tables of physical values, Reference book, Moscow.
Corresponding Author
V P Vassiliev, Lomonosov Moscow State University, Chemical Department, 119992, Moscow, Russia.
Copyright
© 2023 Vassiliev VP, et al. This is an open-access article distributed under the terms of the Creative Commons Attribution License, which permits unrestricted use, distribution, and reproduction in any medium, provided the original author and source are credited.