Peroxynitrite and Hypochlorite Fluorescence Quantification by S,N and P,N co-Doped Carbon Dots
Abstract
Carbon Dots (CDs) responding to Peroxynitrite (ONOO-) and Hypochlorite (ClO-) were synthesised by microwave methodology. To improve the quantum yield, selectivity and sensitivity, CDs were doped with Sulphur, Nitrogen and Phosphorous, Nitrogen (S,N-CDs/P,N-CDs) using urea, cysteine and sodium phosphate. In both synthesis the precursors were diluted in 15 mL of water and exposed for 5 min to a microwave radiation of 700 W. Contents of cysteine and sodium phosphate from 0.5 to 2 g were respectively used with 1 g of citric acid and urea for the synthesis of the co-doped S,N-CDs and with 3 g of citric acid and 1 g of urea for the synthesis of the co-doped P,N-CDs. The ONOO- and ClO- detection was achieved respectively with co-doped S,N-CDs and P,N-CDs at pH 7.4. The optimum compositions were: S,N-CDs - citric acid, urea and cysteine in the proportion 1:1:1; P,N-CDs- citric acid, urea and sodium phosphate in the proportion 3:1:1. The quantification of ClO- and ONOO- at pH 7.4 was performed in standard and in fortified serum sample solutions.
Keywords
Co-doped carbon dots, Peroxynitrite, Hypochlorite, Quantification, Fluorescence, Quenching
Introduction
Carbon Dots (CDs) are fluorescent nanoparticles based in carbon with unique optical properties [1-3]. Also attending to their water solubility, photostability, low toxicity, high biocompatibility and resistance to photo bleaching have been applied in fluorescence sensing, drug delivery and in bio imaging [4]. The CDs could yet be passivated, functionalized and doped in order to improve their quantum yield (Φ), to modify their compositions with the aim to improve their properties and to make them sensitive to specific compounds [5,6].
Microwave synthesis of CDs is extensively used for the CDs synthesis since it's an economic, facile and rapid method [7,8]. Citric Acid (CA) and Urea (UR) have also been used as precursors in the microwave synthesis of luminescent CDs that exhibits stable and excitation-wavelength-dependent photoluminescent properties in aqueous solutions with a Φ about 14% [9,10]. The CDs doping with heteroatoms (e.g., oxygen, nitrogen, phosphor, boron or sulfur) allows modifying and adjust their compositions and structures being one way of tuning their electronic and optical properties [11] in order to optimize the synthesis of the CDs for a specific objective. Doped Nitrogen CDs (N-CDs) [12], Doped Sulfur CDs (S-CDs) [13] Co-doped Sulfur, Nitrogen CDs (S,N-CDs) [6,14-21] and Phosphorous, Nitrogen (P,N-CDs) [22] have been applied in published recent works. Li, et al. synthesized S,N-CDs by a microwave methodology using CA as carbon source, UR as nitrogen source and Cysteine (Cys) as sulfur source [15]. CA and Cys were also employed in the preparation of S,N-CDs with high Φ using a hydrothermal synthesis method [19]. Applying a similar hydrothermal synthesis method Xue, et al. prepared S,N-CDs and applied them in the detection of free chlorine [21]. S,N-CDs have been also synthesized using as precursors natural products, like natural plants (garlic acid and alfalfa) [20], milk [23], rice [24] and hair fiber [25]. Gong, et al. synthesized P,N-CDs and applied them as fluorescent probe for real-time measurement of Reactive Oxygen Species (ROS) and Reactive Nitrogen Species (RNS) [22].
The detection of ROS/RNS like Peroxynitrite (ONOO-) and Hypochlorite (ClO-) is extremely important because these species are involved in several physiological and pathological processes. The formation of ONOO- in vivo is the result of the reaction between nitric oxide and superoxide radicals. This RNS is a strong oxidant and a powerful nitration agent of biomolecules, is stable in basic media and very unstable in neutral conditions. Due their instability in physiological conditions their detection is not straight forward. Three sensors for ONOO- detection based in CDs were described. One of them consists in CDs functionalized with Tryptophan (Trp-CDs). Taking into consideration the nitration and oxidation potential of ONOO-, the amino acid tryptophan was used to functionalize the CDs in order to make them reactive toward ONOO-. The CDs were microwave synthesized from glucose and tryptophan and the detection of ONOO- was done through the fluorescence quenching probably due to the oxidation of tryptophan linked to CDs. The evaluated analytical methodology shows a linear response range from 5 to 25 µM with a Limit of Detection (LOD) of 1.5 µM [26]. In other described sensor, also developed as a NO sensor, the ONOO- determination was made with a greater sensitivity at pH 7.4 and 10 with synthesized CDs with 0.25 g of CA and 500 µL of Ethylenediamine (EDA) diluted in 15 mL of water exposed for 5 min to a microwave radiation potency of 700 W [27]. Finally Simões, et al. use synthesized CDs from AC and UR for the ONOO- quantification at pH 9 based in a fluorescence quenching phenomenon by addition of ONOO- [10].
Hypochlorous Acid (HClO) is a weak acid that dissociates into Hypochlorite Ion (ClO-) and hydrogen. Together, HOCl and ClO- are known as free chlorine. The two species are in a pH dependent equilibrium. The dominant species below pH 7.5 is the HClO and above pH 7.5 is the ClO-. The HClO usually used as antimicrobial agent is also used in water treatment for natural defense in living organisms and oxidize a great number of biological compounds [28]. A method based on the fluorescence quenching mechanism of N-CDs was applied in HClO detection showing a relatively fast response time and a linear response range from 0.03 to 15 μM with a LOD of 1 nM. This method has been successfully applied to the determination of HClO in tap and river water with good recoveries showing potential for the detection of HClO in environmental applications [29]. Another sensor for HClO based on the fluorescence of CDs was prepared by one-step microwave-assisted procedure. A decreased of 76% when the concentration of HClO reached 2.2 µM was observed. There is a good linear relationship in the range from 0.2 to 2.0 µM with a LOD of 15 nM [30]. One more sensor based on fluorescence quenching of synthesized CDs from sweet pepper in the presence of ClO- in tap water was reported. The HClO detection was made in two consecutive linear ranges of 0.1 to 10 µmolL-1 to 10 to 300 µmolL-1 with a LOD of 0.05 and 0.06 µmolL-1 using both the down- and up-conversion fluorescence signals [31]. Simões, et al. beside the possibility of the ONOO- quantification at pH 9 by synthesized CDs from AC and UR also demonstrate the possibility of ClO- quantification at pH 4 by these CDs also based in the fluorescence quenching induced by addition of ClO- at this pH [10].
Herein we report the synthesis of co-doped S,N-CDs and P,N-CDs by a simple and facile one step microwave pyrolysis method for the quantification at pH 7.4 of ONOO- and ClO- respectively. The evaluation of the CDs response relatively to other ROS/RNS was also performed. The ONOO- and ClO- quantification capability in standard and in fortified serum solutions with the synthesized were respectively evaluated with the co-doped P,N and S,N-CDs.
Experimental
Reagents
Citric Acid (CA), Urea (UR), Cysteine (Cys), Hydrogen Peroxide (H2O2), Hydrogen Chloride (HCl), Potassium Superoxide (KO2), Sodium Hypochlorite 3.5% (NaClO), Sodium Nitrite (NaNO2), Sodium Nitrate (NaNO3), Sodium Chloride (NaCl), Sodium Phosphate (Na3PO4, SP), Potassium Chloride (KCl), Ethylenediamine Tetraacetic Acid (EDTA), Iron(II) Sulphate (FeSO4.7H2O), Iron(III) Nitrate [Fe3(NO3)3.9H2O], Magnesium Chloride (MgCl2.6H2O), Copper(II) Sulphate (CuSO4.5H2O), Sodium Phosphate Dibasic (Na2HPO4), Monosodium Phosphate (NaH2PO4), Sodium Hydroxide (NaOH), analytical grade reagents were used. Mili-Q water with a resistivity 18 MΩ.cm at 25 ℃ was used in all the work.
Solutions
All the experiments were made at pH 7.4. A phosphate buffer 0.01 M (pH 7.4) was prepared through rigorous weighting of NaH2PO4 and Na2HPO4. Solutions of HCl and NaOH 0.1 M were prepared in order adjust the pH of buffer solution and to evaluate the influence of pH in the CDs fluorescence.
Saturated NO solutions (1.9 mM) were prepared by bubbling argon in water for 15 min and followed bubbling argon of the prepared NO solution for another 15 min. The ONOO- solutions were prepared in a refrigerated beaker under constant stirring by mixing 100 mL of NaNO2 600 mM, 100 mL of H2O2 600 mM in HCl 0.6 M and 100 mL of NaOH 3.6 M. The solution will turn yellow indicating the formation of ONOO-. The agitation is maintained until no O2 is formed. The Hydroxyl (HO.) was generated in situ by the Fenton reaction by addition of a 5 fold excess of H2O2 to the EDTA-Fe (II) complex formed with different concentrations of FeSO4. Human serum fortified sample solutions were done respectively in water by rigorous dilution to the desired concentrations. The other solutions of H2O2, KO2, NaClO, NaNO3, NaNO2 used in the interference studies were prepared in water.
Microwave CDs synthesis
Attending to previous published work CA and UR, a volume of 15 mL of water and a time of 5 min in a domestic microwave with a radiation potency of 700 w were used for all the CDs synthesis [10]. Beside CA and UR also Cys and SP were used to the CDs synthesis. For the S,N-CDs synthesis were used 1 g of CA, 1 g of UR with a mass of Cys from 0.5 to 2 g, and for the P,N-CDs synthesis were used 3 g of CA, 1 g of UR with a mass of SP from 0.5 to 2 g. For the CDs microwave synthesis a domestic microwave with a maximum radiation potency of 700 w was used. The synthesized CDs were leaving to cool, diluted with water and posterior centrifuged at 9000 rpm during 10 min in order to eliminated suspended impurities. A final of 30 mL were posterior set with water.
Instrumentation
The fluorescence sensing evaluations were made using a QE65000 charge-coupled detector, a 380 nm Light Emitting Diode (LED), a sampling compartment (CUV-ALL-UV 4-way) and two 1.0 mm core diameter fiber optics (P1000-2-UV-VIS) from Ocean Optics. One of the fibers guides the light from the source to the sampling compartment and the other guide the emitted light to the detector. The reaction time profiles were obtained collecting the signal at the maximum emission wavelength, every 10 s with an integration time of 300 ms. A difference between the initial and the final fluorescence intensity measured after 10 min the addition of the ROS/RNS (intensity variation) were used in all the work.
The absorbance and fluorescence spectra were obtained in a standard 1 cm fluorescence quartz cell and collected respectively in a Jasco V-530 UV-Visible spectrophotometer and in a Jasco FP-6200 spectrofluorimeter. The absorption spectra were obtained in a wavelength range from 250 to 650 nm with a 2 nm interval, slit widths 2 nm and wavelength scan rate medium; the Fluorescence spectra were obtained in a wavelength range from 300 to 700 nm with a 1 nm interval, slit widths 5 nm, sensitivity response medium, response time fast and wavelength scan rate 1000 nm/min. Fourier Transform Infrared (FTIR) spectra were obtained by a Perkin Elmer FTIR Spectrum 400 in solid state with an Attenuated Total Reflectance (ATR) accessory in a range of 4000 to 650 cm-1 with 16 accumulations and a resolution of 4 cm-1. The particle size, size distribution and shape of the synthesized CDs were evaluated by Transmission Electronic Microscopy (TEM) in a FEI Company Tecnai G2 20 S-Twin electronic microscopic.
Quantum yield
The Φ of the CDs was calculated comparing the integrated photoluminescence intensities and the absorbance values of the synthesized CDs with the ones of the quinine sulfate.
In the equation Φ is the fluorescence quantum yield, Grad is the gradient from the plot of integrated fluorescence intensity vs. absorbance and η is the refractive index. The subscripts R refer to reference fluorophore, quinine sulfate of known Φ. The Φ of the quinine sulfate is Φ = 0.54. The η of the quinine sulfate in 0.1 M H2SO4 and of nanocomposites water solutions used were η = 1.33.
ROS/RNS evaluations
The more adequate CDs dilution in phosphate buffer 0.01 M was assessed by the evaluation of successive dilutions of CDs solution in order to establish the dilution with the higher CDs fluorescence intensity. The ROS/RNS addition, in the required concentration to the more adequate CDs dilution, was done in a cuvette with a Hamilton syringe with permanent agitation while the fluorescence signal is continuously monitored for a period of 10 min.
Results
ROS/RNS evaluations
Preliminary results shows that the co-doped S,N-CDs could be used for the ONOO- detection and the co-doped P,N-CDs could be used to the ClO- detection at pH 7.4. Worse results were obtained with non-doped CDs (data don't shown). Indeed they found with the synthesis of co-doped S,N and P,N-CDs with CA and UR in the range from 1 to 3 g with 1 g of Cys or SP shows that the more selective and sensitivity ONOO- and ClO- fluorescence detection were obtained respectively with the synthesized co-doped CDs with 1 g of CA and UR and with 3 g of CA and 1 g of UR.
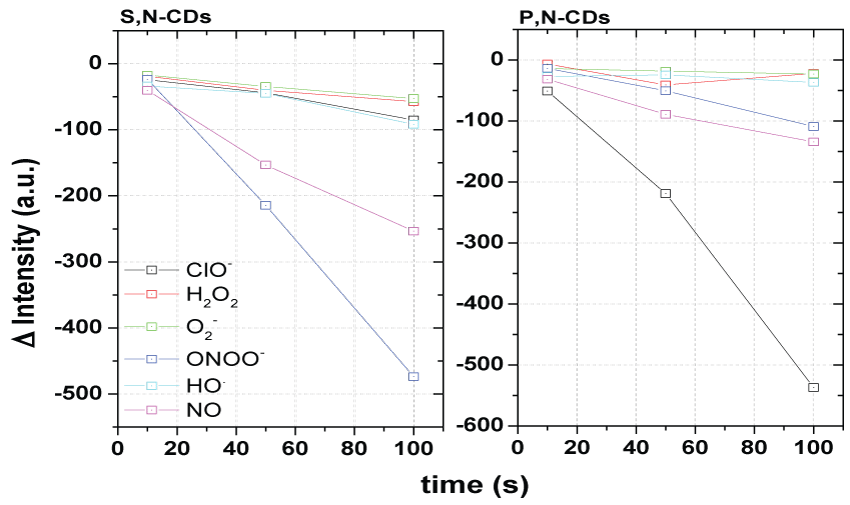
Attending to those preliminary results the possibility of the ONOO- and ClO- fluorescence quantification at pH 7.4 were then evaluated with the co-doped S,N-CDs and P,N-CDs synthesized respectively with 1 g of CA and UR and with 3 g of CA and 1 g of UR with Cys or SP in a range from 0.5 to 2 g. The sensibility and selectivity fluorescence detection of the ONOO- and the ClO- in respect to other ROS/RNS, by the initially evaluated synthesized co-doped S,N-CDs and P,N-CDs, is shown in Figure 1. Other evaluations with different contents of Cys and SP are presented in supplementary information (Figure S1).
The fluorescence detection of the main ROS/RNS (NO, ONOO-, ClO-, HO., H2O2 and O2-) by the S,N-CDs and P,S-CDs was done at concentrations of 10, 50 and 100 µM. A greater sensible and selective response of S,N-CDs to ONOO- and of P,N-CDs to ClO- was verified at pH 7.4. Also was verified that the S,N-CDs responds to the NO and the P,N-CDs responds to ONOO- and NO. A similar quenching effect was verified for the ONOO- with the S,N-CDs and for the ClO- with the P,N-CDs. For the other ROS/RNS a minor quenching effect was verified for the ONOO- and NO with the P,N-CDs.
In comparison with the S,N-CDs synthesized in the other conditions is verified that the CDs synthesized with 0.5 g of Cys don't show selectivity between ROS/RNS and the CDs with 2 g of Cys presented sensibility to NO but wasn't observed a linear variation. Relatively to P,N-CDs although the CDs, with others masses of SP present sensibility to ClO- only the prepared with 1 g of SP showed a linear variation. Also a greater selectivity was verified with the co-doped P,N-CDs synthesized with 1 g of SP.
Attending to this previous evaluation the co-doped S,N-CDs and P,N-CDs, respectively synthesized with 1 g of CA, UR and Cys and with 3 g of CA, 1 g of UR and 1 g of UR and 1 g of SP, were then characterized and their ONOO and ClO- quantification capability was evaluated.
CDs characterization
The synthesized co-doped S,N-CDs and P,N-CDs, posterior used for ONOO- and ClO- quantification, were characterized by fluorescence, FTIR and TEM analysis.
Spectroscopic characterization
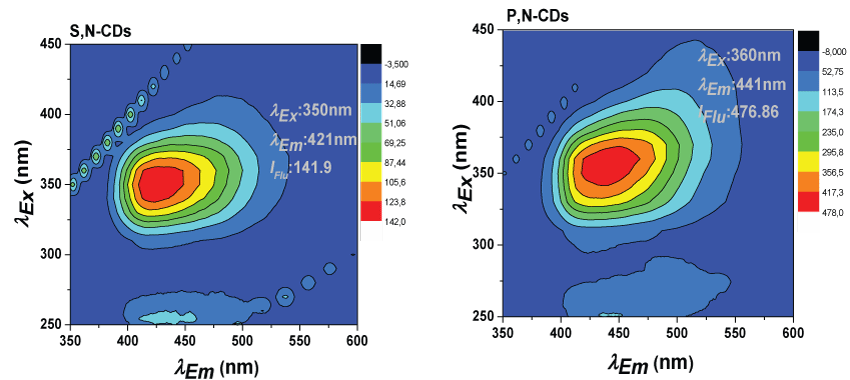
Figure 2 presents the fluorescence Excitation-Emission Matrices (EEM) of the synthesized co-doped S,N-CDs and P,N-CDs used for quantification. In supplementary information are presented the EEM of the other synthesized CDs (Figure S2) and, for easier comparison, a table with the main fluorescence features of the all the synthesized CDs (Table S1).
Relatively similar fluorescence characteristics for the different synthesized CDs were observed. The co-doped S,N-CDs presents a Φ of 21% and the P,N-CDs of 6%. The excitation/emission wavelength of both CDs is similar. The excitation/emission wavelengths at maximum fluorescence intensity found for the S,N-CDs is 350/421 nm and for the P,N-CDs is 360/441 nm. For the co-doped S,N-CDs with different quantities of Cysan excitation wavelength of 350 nm and a similar emission wavelength close to 430 nm and a Φ between 22.09 and 30.53 was observed. For the P,N-CDs with different contents of SP an excitation wavelength close to 360 nm and emission wavelength that increase from 390 nm to 449 nm with the increase of the SP mass was observed. For the co-doped P,N-CDs was also observed that the Φ decrease with higher masses of SP.
In supplementary information (Figure S3) is also presented the influence in the fluorescence intensity of the pH and of the ionic strength of the synthesized co-doped S,N-CDs and P,N-CDs in the synthesis conditions used for the quantification. By analysis of the this figure it's possible to see that the maximum fluorescence intensity for the S,N-CDs it's found at pH 5 and for the P,N-CDs at a pH from 8 to 11. At pH 7.4 a greater decrease and a slightly increase are respectively observed for the S,N-CDs and P,N-CDs.
A non-significate variation of the fluorescence intensity it's obtained with the ionic strength showing that a non-significant influence of the ionic strength could be expected in the fluorescence quantifications.
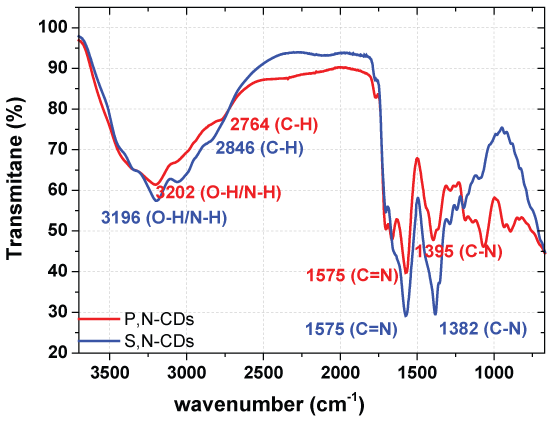
The FTIR spectra of the different CDs synthesized are presented in Figure 3 and in supplementary material (Figure S4).
Slightly different FTIR spectra of the synthesized co-doped S,N-CDs and P,N-CDs used for the quantification are found. Significant difference are for the peaks of the C-H (2846 and 2764 cm-1) and of the C-N (1382 and 1395 cm-1) Even so the great differences are obtained for the co-doped P,N-CDs in the region of the singles bonds below 1500 cm-1 where a stronger peak now appears at 1068 cm-1 (C-C) and of the double bonds between 2000 and 1500 cm-1 where are clearly evident two peaks at 1764 (C = O) and 1663 cm-1 (C = C).
Size and shape
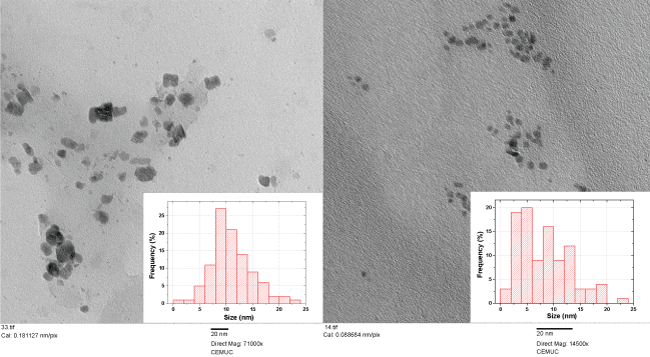
The size and the shape of the two CDs presented were obtained using TEM analysis (Figure 4).
A statistical evaluation of the size distribution considering a sample of 100 nanoparticles shows for the S,N-CDs an average size of 10.9 nm and a standard deviation of 3.7 and for P,N-CDs an average size of 8.2 nm and a standard deviation of 4.9. Comparing the two synthesized co-doped CDs for the co-doped S,N-CDs was found a slightly larger size with a more heterogeneous size distribution. Also by TEM analysis were verified for the S,N-CDs an irregular shape and for P,N-CDs a spherical or quasi-spherical shape. An higher aggregation could be seen for the S,N-CDs.
Fluorescence sensing
Quantification capability
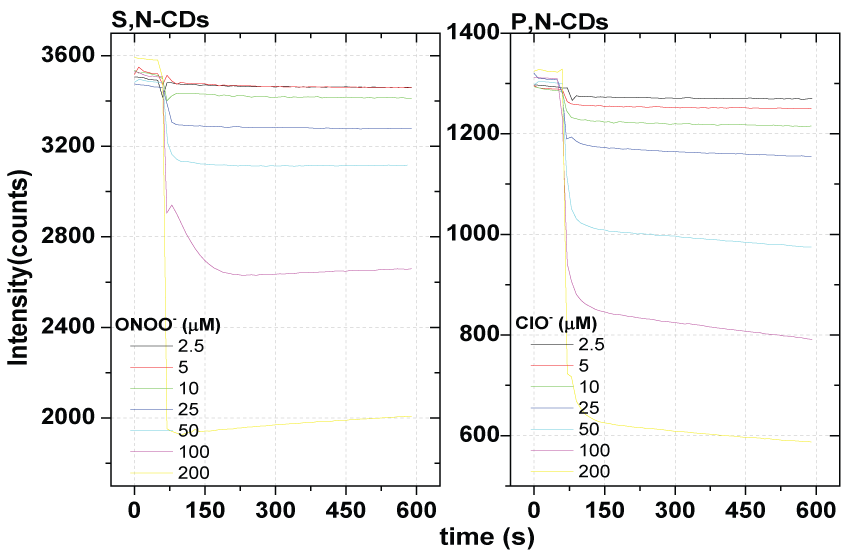
Following are presented the results that allow to evaluate the quantification capability of the ONOO- and ClO- by the S,N-CDs and P,N-CDs, respectively. Both ROS/RNS it's observed a fluorescence quenching effect provoked by addition of ONOO- to the S,N-CDs and of ClO- to the P,N-CDs. The fluorescence quenching mechanism is probably due to a pH dependent redox reaction between the ClO- or ONOO- and the CDs surface oxygen and nitrogen functionalities and dangling bonds. Indeed, the fluorescence of CD are markedly affected by the surface chemistry and the oxidation of surface functionalities modified those properties [32].
In Figure 5 is presented the fluorescence time profiles due to the fluorescence quenching effect of the synthesized CDs at concentrations from 2.5 to 200 µM. In supplementary information (Figure S5) are presented the ONOO- and ClO- linear range evaluation by addition of a ONOO- and ClO- concentration from 2.5 to 200 µM respectively to the synthesized S,N-CDs and P,N-CDs in the synthesis conditions used for the quantification. The average response time at 90% of maximum fluorescence quenching effect is 9 seconds.
It is now clear by analysis of the Figure 5 a higher quenching effect by addition of ONOO- to the co-doped S,N-CDs relatively to the found by addition of ClO- to the co-doped P,N-CDs. By the evaluation of the linear range (Figure 5) in the levels of concentration from 2.5 to 200 µM was also obtained a higher linear range from 2.5 and 200 µM for the ONOO- and for the ClO- a smaller linear range from 2.5 and 100 µM.
In Table 1 is presented the ONOO- and ClO- quantification results obtained in standard and in spiked serum samples in the more adequate linear range.
Good quantification results were found for the ONOO- with the co-doped S,N-CDs and for the ClO- with the co-doped P,N-CDs in the quantification of the standard solutions in the concentrations levels evaluated. Recoveries for the ONOO- with the co-doped S,N-CDs from 81 and 100% and for the ClO- with the co-doped P,N-CDs from 99 and 108% were found. Worse results were generally found in the ONOO- and ClO- quantification in serum samples with recoveries for the ONOO- with the co-doped S,N-CDs from 70 and 85% and for the ClO- with the co-doped P,N-CDs from 39 and 63%. Even so generally better results with the serum samples are obtained with the co-doped S,N-CDs in the quantification of ONOO-.
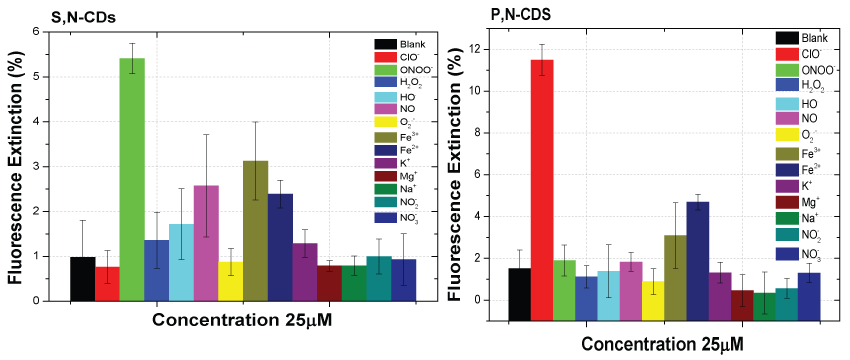
The interference study of the main ROS/RNS and selected ionic species in the ONOO- detection for S,N-CDs and in the ClO- detection for P,N-CDs was also made for a concentration value of the potential interfering species of 25 µM (Figure 6).
Lower selectivity to ONOO- with the co-doped S,N-CDs and higher selectivity to ClO- quantification with the P,N-CDs were observed. The ionic species Fe2+ and Fe3+ causes the highest interference in the ONOO- and ClO- detection by the evaluated co-doped CDs. A greater interference was observed with the co-doped S,N-CDs. As could expected, attending to previous results and beside the Fe2+ and Fe3+ ionic species, only for the co-doped S,N-CDs with the ONOO- a small interference of the NO is observed.
In Table 2 is presented the resume of the methods of synthesis, fluorescence characteristics and principal figures of merit of the already developed CDs based sensors for ONOO- and ClO- detection.
Comparing with previous published works was found: for the ONOO- detection by the co-doped S,N-CDs, a comparable selectivity, a relatively high sensitivity, a slightly lower limit of detection and a larger linear range; for the ClO- detection by the co-doped P,N-CDs a comparable selectivity, a relatively high sensitivity, a slightly higher limit of detection and a comparable linear range. Comparing with our previous work where synthesized N doped CDs were used for the ONOO- and ClO- detection, at pH 9 and 4 respectively, the co-doping with S or P allows the ONOO- and ClO- detection with similar performance characteristics at pH 7.4. Beside that the ONOO- detection was done with co-doped CDs with a higher quantum yield at lowers excitation and emission wavelengths and the ClO- detection was done with co-doped CDs with a slightly lower quantum yield and similar excitation and lower emission wavelengths.
Conclusions
The results obtained shows a sensitive and selective ONOO- and ClO- quantification at pH 7.4 respectively by the co-doped S,N-CDs and P,N-CDs. A higher sensitivity with a lower selectivity in the ONOO- quantification, with the synthesized co-doped S,N CDs, and a lower sensitivity with a higher selectivity in the ClO- quantification, with the synthesized co-doped N,P-CDs, were found.
Good quantification results were obtained in the analysis of the standard solutions and worse results were obtained in the analysis of the spiked serum sample solutions. Generally better quantification results were found by the co-doped S,N-CDs in the ONOO- quantification in serum samples solutions and by the co-doped P,N-CDs in the ClO- quantification in standard solutions. Only for the ONOO- with the co-doped S,N-CDs, and beside the potential interference of the Fe ionic species, a small interference of the NO was evaluated.
Acknowledgments
The use of FTIR from UCQ Farma, Pharmacy Faculty of the University of Coimbra and the TEM analyses from Nanomaterials and Micromanufacturing group of Centre for Mechanical Engineering of the University of Coimbra (CEMUC) are also acknowledged. This work was made in the framework of project PTDC/QEQ-QAN/5955/2014, which is funded with national funds by FCT/MEC (PIDDAC). The project is also co-funded by "Fundo Europeu de Desenvolvimento Regional" (FEDER), through "COMPETE - Programa Operacional Fatores de Competitividade (POFC)". This work was also made in the framework of the project "Sustainable Advanced Materials" (NORTE-01-0145-FEDER-00028), funded by "Fundo Europeu de Desenvolvimento Regional (FEDER)", through "Programa Operacional do Norte (NORTE2020)". Acknowledgment to project POCI-01-0145-FEDER-006980, funded by FEDER through COMPETE2020, is also made.
Supplementary Information
References
- Bao L, Liu C, Zhang Z-L, et al. (2015) Photoluminescence-Tunable Carbon Nanodots: Surface-State Energy-Gap Tuning. Adv Mater 27: 1663-1667.
- Baker SN, Baker GA (2010) Luminescent Carbon Nanodots: Emergent Nanolights. Angew Chem Int Ed 49: 6726-6744.
- Lim SY, Shen W, Gao Z (2015) Carbon quantum dots and their applications. Chem Soc Rev 44: 362-381.
- Lai C-W, Hsiao Y-H, Peng Y-K, et al. (2012) Facile synthesis of highly emissive carbon dots from pyrolysis of glycerol; gram scale production of carbon dots/mSiO2 for cell imaging and drug release. J Mater Chem 22: 14403-14409.
- Ding C, Zhu A, Tian Y (2014) Functional Surface Engineering of C-Dots for Fluorescent Biosensing and in Vivo Bioimaging. Acc Chem Res 47: 20-30.
- Sun Y, Shen C, Wang J, et al. (2015) Facile synthesis of biocompatible N, S-doped carbon dots for cell imaging and ion detecting. RSC Adv 5: 16368-16375.
- Yang Z, Li Z, Xu M, et al. (2013) Controllable Synthesis of Fluorescent Carbon Dots and Their Detection Application as Nanoprobes. Nano-Micro Lett 5: 247-259.
- Zhu H, Wang X, Li Y, et al. (2009) Microwave synthesis of fluorescent carbon nanoparticles with electrochemiluminescence properties. Chem Comm 34: 5118-5120.
- Qu S, Wang X, Lu Q, et al. (2012) A Biocompatible Fluorescent Ink Based on Water-Soluble Luminescent Carbon Nanodots. Angew Chem Int Ed 51: 12215-12218.
- Simoes EFC, Leitao JMM, da Silva JCGE (2016) Carbon dots prepared from citric acid and urea as fluorescent probes for hypochlorite and peroxynitrite. Microchim Acta 183: 1769-1777.
- Park Y, Yoo J, Lim B, et al. (2016) Improving the functionality of carbon nanodots: doping and surface functionalization. J Mater Chem A 4: 11582-11603.
- Zhu S, Meng Q, Wang L, et al. (2013) Highly photoluminescent carbon dots for multicolor patterning, sensors, and bioimaging. Angew Chem 52: 3953-3957.
- Xu Q, Pu P, Zhao J, et al. (2015) Preparation of highly photoluminescent sulfur-doped carbon dots for Fe(iii) detection. J Mater Chem A 3: 542-546.
- Wang Y, Kim S-H, Feng L (2015) Highly luminescent N, S-Co-doped carbon dots and their direct use as mercury (II) sensor. Anal Chim Acta 890: 134-142.
- Li L, Yu B, You T (2015) Nitrogen and sulfur co-doped carbon dots for highly selective and sensitive detection of Hg (II) ions. Biosens Bioelectron 74: 263-269.
- Lu W, Gong X, Nan M, et al. (2015) Comparative study for N and S doped carbon dots: Synthesis, characterization and applications for Fe3+ probe and cellular imaging. Anal Chim Acta 898: 116-127.
- Chen Y, Wu Y, Weng B, et al. (2016) Facile synthesis of nitrogen and sulfur co-doped carbon dots and application for Fe(III) ions detection and cell imaging. Sens Actuator B: Chem 223: 689-696.
- Xu Q, Liu Y, Gao C, et al. (2015) Synthesis, mechanistic investigation, and application of photoluminescent sulfur and nitrogen co-doped carbon dots. J Mater Chem C 3: 9885-9893.
- Dong Y, Pang H, Yang HB, et al. (2013) Carbon-based dots co-doped with nitrogen and sulfur for high quantum yield and excitation-independent emission. Angew Chem 52: 7800-7804.
- Guo Y, Yang L, Li W, et al. (2016) Carbon dots doped with nitrogen and sulfur and loaded with copper(II) as a "turn-on" fluorescent probe for cystein, glutathione and homocysteine. Microchim Acta 183: 1409-1416.
- Xue M, Zhang L, Zou M, et al. (2015) Nitrogen and sulfur co-doped carbon dots: A facile and green fluorescence probe for free chlorine. Sens Actuator B: Chem 219: 50-56.
- Gong Y, Yu B, Yang W, et al. (2016) Phosphorus, and nitrogen co-doped carbon dots as a fluorescent probe for real-time measurement of reactive oxygen and nitrogen species inside macrophages. Biosens Bioelectron 79: 822-828.
- Wang D, Wang X, Guo Y, et al. (2014) Luminescent properties of milk carbon dots and their sulphur and nitrogen doped analogues. RSC Adv 4: 51658-51665.
- Hu Q, Paau MC, Zhang Y, et al. (2014) Green synthesis of fluorescent nitrogen/sulfur-doped carbon dots and investigation of their properties by HPLC coupled with mass spectrometry. RSC Adv 4: 18065-18073.
- Sun D, Ban R, Zhang P-H, et al. (2013) Hair fiber as a precursor for synthesizing of sulfur- and nitrogen-co-doped carbon dots with tunable luminescence properties. Carbon 64: 424-434.
- Simoes EFC, da Silva JCGE, Leitao JMM (2014) Carbon dots from tryptophan doped glucose for peroxynitrite sensing. Anal Chim Acta 852: 174-180.
- Simoes EFC, Esteves da Silva JCG, Leitao JMM (2015) Peroxynitrite and nitric oxide fluorescence sensing by ethylenediamine doped carbon dots. Sens Actuator B: Chem 220: 1043-1049.
- Davies MJ, Hawkins CL, Pattison DI, et al. (2008) Mammalian heme peroxidases: from molecular mechanisms to health implications. Antioxid Redox Signal 10: 1199-1234.
- Wang D, Xu H, Zheng B, et al. (2015) N-doped carbon dots with high sensitivity and selectivity for hypochlorous acid detection and its application in water. Anal Meth 7: 5311-5317.
- Huang Z, Lin F, Hu M, et al. (2014) Carbon dots with tunable emission, controllable size and their application for sensing hypochlorous acid. J Lumin 151: 100-105.
- Yin B, Deng J, Peng X, et al. (2013) Green synthesis of carbon dots with down- and up-conversion fluorescent properties for sensitive detection of hypochlorite with a dual-readout assay. Analyst 138: 6551-6557.
- Ding H, Yu S-B, Wei J-S, et al. (2016) Full-Color Light-Emitting Carbon Dots with a Surface-State-Controlled Luminescence Mechanism. ACS Nano 10: 484-491.
Corresponding Author
João MM Leitão, Centro de Investigação em química, Universidade do Porto; Faculdade de Farmácia, Universidade de Coimbra, Portugal.
Copyright
© 2017 Simões EFC, et al. This is an open-access article distributed under the terms of the Creative Commons Attribution License, which permits unrestricted use, distribution, and reproduction in any medium, provided the original author and source are credited.


