Develop Infographics with all Stakeholders on Board
Health information is a key health management strategy to support patients and family caregivers at home. However, patients often find the health information incomprehensible, which leaves them anxious, and information overloaded [1]. Therefore, validity and usability of most pictorial educational handouts that health providers distribute is concerning. The research to date has tended to focus on the content or validity of health information rather than information presentation, information delivery, and handout usability in a target population. This is because our current practice of developing educational handout is led primarily by clinicians with little participation from patients. The challenges that require solving are (1) Inadequate patient engagement in handout development and (2) Lack of structured evaluation measurement to guide its development process. We aim to address these challenges by preliminarily testing an evidence-based handout development protocol.
Evidence-Based Infographics Development Protocol
We designed a 3-stage (development, iterative revising with multidisciplinary panel and field-testing stages) participatory action study to develop and validate a pictographic handout on tracheostomy care. Instead of combining the content validity and usability testing in one stage, we believe it is not ethical to share infographics before reaching content validity due to pictographs' high risk of introducing confusion to the patient. Therefore, in collaboration with all stakeholders on the board, we first reviewed the handout with an interdisciplinary expert panel to assure content validity and then a patient and family caregiver panel to field-test its usability.
Invited Experts Represent Full Spectrum of Expertise
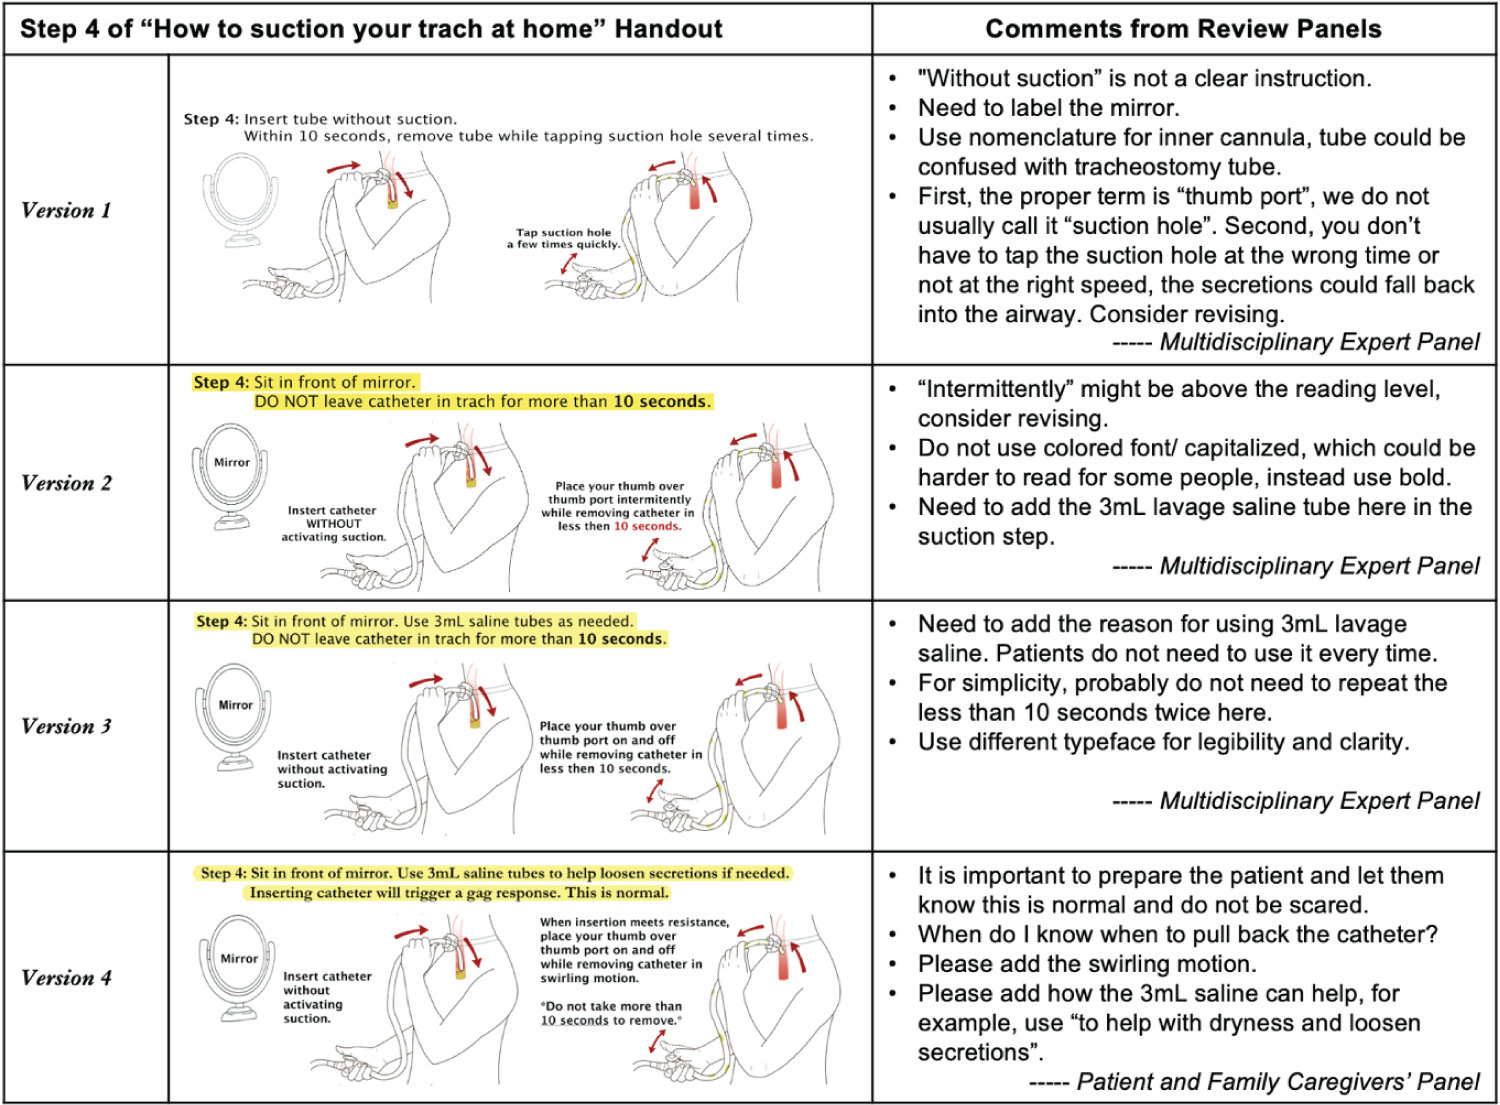
The selection of multidisciplinary experts should be guided not only by their experience on the information content, but also their areas of expertise. In addition to the clinical experts on tracheostomy care, a health psychologist and graphic artist were also invited to join the multidisciplinary expert panel. Feedback from the graphic artist is essential to the overall presentation of the pictorial validity. For instance, our graphic expert suggested that multiple typefaces should be used to improve clarity and legibility. The health psychologist assessed whether the pictographic content was too overwhelming or confusing for patients or family caregivers to practice independently at home. Figure 1 illustrates the unique comments from each panel on improving the infographics on tracheostomy care.
Perceived Infographics Usability Measurement (PIUM)
To structure the revising stage, a PIUM was developed to consistently quantify experts' feedback and judgment. We reviewed literature on pictorial education and found six measurement constructs, which encompass consistency with clinical practice, handout's usefulness, overall informativeness, comprehensibility of pictographs and captions, layout simplicity, and pictographs' risk of introducing confusion [2]. Based on the theory of content validity, content with below 78% agreement scores on each measurement construct is considered non-valid [3]. In our study, the revising stage was repeated until the PIUM reached 78% on each measurement construct.
In conclusion, the evidence-based handout development protocol on tracheostomy care showed preliminary efficacy on establishing infographics' validity and usability in the target population.
Acknowledgements
We thank all the reviewers for their assistance in revising the handout and Rachel Neal, the Scientific Illustrator for all her great artwork on the posters.
Funding
This work was supported by 2020 Sigma Theta Tau International Foundation for Nursing/Doris Bloch Research Award and the Fellowship from Sarah Cole Hirsh Institute of Evidence based Practice.
References
- Chae J, Lee CJ, Jensen JD (2016) Correlates of cancer information overload: Focusing on individual ability and motivation. Health Communication 31: 626-634.
- Wang T, Voss JG (2020) Effectiveness of pictographs in improving patient education outcomes: A systematic review. Health Education Research 36: 9-40.
- Almanasreh E, Moles R, Chen TF (2019) Evaluation of methods used for estimating content validity. Res Social Adm Pharm 15: 214-221.
Corresponding Author
Tongyao Wang, Frances Payne Bolton School of Nursing, Case Western Reserve University, Cleveland, USA; School of Nursing, University of Hong Kong, 4/F, William M.W. Mong Block, 21 Sassoon Road, Pokfulam, Hong Kong, Tel: 5596-8294, Fax: 2872-6079
Copyright
© 2022 Wang T, et al. This is an open-access article distributed under the terms of the Creative Commons Attribution License, which permits unrestricted use, distribution, and reproduction in any medium, provided the original author and source are credited.