Minimum Sample Size Requirements for a Validation Study of the Birth Satisfaction Scale-Revised (BSS-R)
Abstract
Introduction
The 10-item Birth Satisfaction Scale-Revised (BSS-R) is a theoretically anchored and easy to administer multidimensional measure of the birth satisfaction construct. The use of the BSS-R Internationally has led to an increasing number of translation and validation studies being conducted. An important consideration for any validation/translation study of the measure concerns sample size. However, sample size estimations for validation studies are invariably based on 'rules of thumb' that are insensitive to the dynamics of the measure under scrutiny and may consequently lead to underpowered investigations. The current study sought to determine empirically the minimum sample size for a validation study of the BSS-R.
Methods
A Monte Carlo simulation study was conducted using the parameter specifications of the original BSS-R validation study as the input model. An extensive series of simulations were conducted to estimate statistical power and simulation quality for a range of sample sizes (N = 50 to N = 1000). Sample sizes from published BSS-R studies were also included in the simulations conducted.
Results
Monte Carlo simulations revealed the minimum sample size for a validation study of the BSS-R to be N = 175. The original BSS-R development study and the US validation study were found to be adequately powered and satisfied all quality criteria for the simulations. Two published BSS-R studies had insufficient sample size to assure confidence in avoiding type 1 error.
Conclusion
Sample size estimation for validation studies should be empirically informed to avoid type 1 error and ensure an adequately powered investigation.
Keywords
Birth satisfaction, Simulation, Sample size, Questionnaire
Introduction
The concept of birth satisfaction represents a construct of importance and relevance to the psychological well-being of the mother [1,2]. Rooted in a theoretically robust model of birth satisfaction based on an extensive thematic review of the literature, the Birth Satisfaction Scale (BSS) was developed by Hollins Martin and Fleming [1] as a multidimensional measure comprising birth satisfaction sub-scale domains of (i) Stress, (ii) Quality of care and (iii) Women's attributes. A psychometrically robust short-form (10-item) version comprising the same structure (three correlated sub-scale domains) was developed by Hollins Martin and Martin [3]. This revised version of the scale (BSS-R) uses the same Likert scoring format as the BSS and thus BSS-R scores can be derived from both 30-item and 10-item versions [3]. Monopolising on coherent theoretical underpinnings and robust measurement characteristics, the BSS-R is increasingly being used internationally, with the instrument being adapted to accommodate cultural context [4] and language requirements [5,6]. Evidence for the utility and applicability of the BSS-R in large sample studies is forthcoming from a recent birth satisfaction survey conducted in the United States [7]. Further, it has been demonstrated that where a rigorous psychometric protocol was undertaken to translation and validation of the tool, the translated version demonstrated equivalence to the original English-language version, thus allowing the opportunity for meaningful comparisons to be made between populations as a function of sub-scale measurement directly [8].
A central tenet to the development of a translated or adapted version of the BSS-R concerns replication of the unpinning tri-dimensional structure of the tool [3]. An accepted and robust method of accomplishing this is through using Confirmatory Factor Analysis (CFA), which represents a special case of structural equation modelling [9]. A fundamental methodological concern with the use of CFA for psychometric appraisal of factor structure is the issue of sample size, an issue of similar concern to other forms of factor analysis also such as Exploratory Factor Analysis (EFA). It is indeed, striking, that given the statistical sophistication of EFA, CFA and SEM-based approaches, that sample size calculations are generally based on 'rules of thumb' such as number of participants to number of items ratios, which range from 3-10+ [10,11] or overall sample size minima with recommendations ranging from 50 [12,13], 100 [14], 150 [15] and 200 [16]. Low N factor analysis studies are not uncommon e.g. [17]. A critical problem with these approaches is that they are insensitive to the particular model being tested, for example, whether the model has one, two, three or more factors, and also insensitive to the relationship between factors and the relationship of items to factors in terms of anticipated factor loadings. An alternative has been suggested by Muthén and Muthén [18] representing a model contextually sensitive statistical approach to determine a sample size for CFA for an adequately powered study. Therefore, if the model can be specified based on an established factor structure, with the relationships between factors, and between items and factors also specified, a Monte Carlo simulation can be conducted based on established sample size determination conventions [19,20], such as power (0.80) and alpha (p = 0.05). Determining the minimum sample size for a translation/adaptation/validation study of the BSS-R would be extremely useful for researchers to inform the feasibility, pragmatics and practicalities of conducting such a study and ensuring confidence in the findings of an investigation by knowing the study is adequately powered and that the sample size estimation is based on empirical observations drawn from the original BSS-R model from which all derivations are developed. Additionally, determination of sample size for adequate power based on the BSS-R tri-dimensional model would also be of value in reflecting on the contemporary portfolio of BSS-R validation studies to consider if the sample sizes used in those studies were likely to be adequate; a worthy consideration since such concerns have been raised by authors themselves [8]. Finally, a realistic appraisal of the minimum sample size required for a translation/adaptation/validation study of the BSS-R represents an ethical contribution to these studies, since taking part in any study represents a burden to participants and it is therefore contingent on the investigators to do this with the most appropriate number taking part to satisfy the study aims and objectives.
Objectives
The current investigation sought to determine the minimum sample size required for translation/adaptation/validation study of the BSS-R based on the factor structure of the BSS-R from the original BSS-R development and validation study [3] using Monte Carlo simulation methods. Muthén and Muthén [18] acknowledge that the optimal way of deciding model parameter estimates is from previous research, thus the parameters from the original BSS-R provide an exemplar for model specification.
The following research questions were addressed:
1. What is the minimum sample size required to conduct a translation/adaptation/validation study of the BSS-R?
2. Are the current published translation/adaptation/validation studies of the BSS-R of sufficient sample size to demonstrate adequate statistical power?
Method
Monte Carlo simulation: Overview of approach
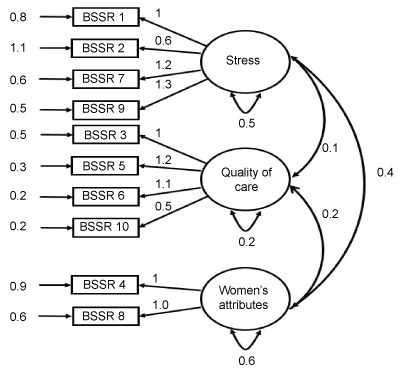
A Monte Carlo simulation study for sample size determination using the power analysis methods of Muthén and Muthén [18] and Beaujean [21]. The parameter values (factor structure, factor covariances, item-factor loadings, residuals) of the original BSS-R (3) are used as the model from which data is generated and the model estimated over a large number of samples (N = 10,000). The resulting parameter estimates and standard errors are then averaged across samples. The minimum sample size is then determined by comparison against a threshold minimum power value (0.80) for each parameter modeled within the simulated data and predicated by the simulated data reaching threshold on specified quality criteria. The specification for the population model evaluated based on the Hollins Martin and Martin [3] analysis is shown in Figure 1.
Quality criteria for simulated data
Confidence in simulated data and its consequent application to sample size approximation is informed by specified quality indices. Muthén and Muthén [18] recommends that indices of Relative Parameter Estimate Bias (RPEB) and Relative Parameter Standard Error Bias (RPSEB) be used to determine simulation quality with RPEB and PRSEB values of < 0.10 for all parameters. Muthén and Muthén [18] further specify a more stringent RPSEB value of < 0.05 for parameters of major interest. To emphasis precision within the current simulation study, all parameters are considered major within the BSS-R model and therefore all threshold values for RPSEB are set at < 0.05. A third quality criteria is coverage. Coverage represents the percentage of repeats (replications) within the simulation in which the parameter value lies within the 95% Confidence Interval (CI) with acceptable coverage criteria being between 0.91 and 0.98 [18]. Type 1 error rate was set by convention at 0.05, thus de facto setting the 95% CI value. A normal distribution resampling procedure was adopted which assumes data normality and is consistent with Hollins Martin and Martin [3] report of generally normally distributed data in their development study. Fit indices commonly used to evaluate CFA models were also estimated from simulated data thus offering a fit index approximation based on the BSS-R model for a given sample size. These fit indices included the Comparative Fit Index (CFI) [22], the Root Mean Squared Error of Approximation (RMSEA) [9], and the Squared Root Mean Residual (SRMR) [23]. CFI values of > 0.95 indicate good model fit [23] and values of > 0.90 acceptable model fit [24]. RMSEA values of < 0.08 are indicative of acceptable fit [25] while more stringent values (< 0.05) indicate good fit [26]. SRMR values of < 0.08 indicate acceptable fit [23]. A Chi-square (Χ2) statistics was also approximated for each simulation. Models run are summarised in Table 1, these being specified by the sample N of published CFA studies on the BSS-R or a range of N specified as small, medium and large samples. 10,000 replications were run per simulation and two simulations run per model. Each pair of simulations per model was compared for consistency. In the event of non-convergence of quality criteria outcomes between simulation pairs a further pair of simulations was run with alternative random number seeds and a larger number of replications. Each simulation was set by a unique random number seed. A model was considered acceptable if all threshold criteria outlined in terms of coverage, RPEB and RPSEB are reached and the model fit is also determined acceptable by CFI, RMSEA and SRMR. Statistical analysis was conducted using the R programming language [27] and the specialist R SEM packages Lavaan [28] and Simsem [29].
Results
The findings of the Monte Carlo simulations are summarised in Table 1 with relevant details of simulation quality, model fit and statistical power. The acceptability of models across criteria of simulation quality, approximated model fit and statistical power as a function of sample size reveal models with sample sizes of N < 175 are not acceptable.
Discussion
The current investigation represents the first study, to the author's knowledge, to empirically determine the minimum sample size required to conduct a validation study on a measure of birth satisfaction which implicitly accommodates pertinent details of factor structure. Moreover, the study itself, uniquely, utilizes the parameters specified by the measure based on the original instrument development and validation study [3]. Therefore, the model parameters specified for the simulations represent an exemplar in being isomorphic to the measurement characteristics and structure of the BSS-R. It is of note that this approach not only represents a departure from 'rule of thumb' criteria for sample size estimation, but is also innovative within the simulation literature where Monte Carlo models are often based on a simplified model approximation (for example, item-factor loadings specified as identical across the model). Explanation for this aspect rests in terms of the availability of original model specification derived from original data and the use of simulation approaches to an applied research question, given that simulation approaches are more generally used for theoretical applications.
Evaluation of the model offers valuable insights into sample size planning for future validation studies of the BSS-R. Firstly, of note is that the original validation study of Hollins Martin and Martin [3] was confirmed by the simulations to be both adequately powered and of sufficient sample size across all indices and both simulation cycles. Similarly, the validation study of the US version of the BSS-R [4] was also found to be adequately powered and of sufficient sample size. Interestingly, the study of Vardavaki, et al. [6] was found to be unacceptable in terms of simulation quality based on RPSEB criteria, though the power estimations of this study were observed to be adequate. However, confidence in sample size calculation and power estimation from a simulation study can only be held in the event of threshold simulation quality criteria, thus the conclusion from this model evaluation is insufficient sample size. It was of note that the model specified with a sample size of N = 175 did achieve both adequate power and satisfied all simulation quality criteria across both cycles. Reflecting on the absolute sample size difference between this model and that of Vardavaki, et al. [6] is just N = 13 participants. However, this difference is not trivial in terms of the simulations conducted and represents a meaningful difference in minimum number acceptability in relation to future replication studies. It should be conceded that the recent invariance study conducted by Martin and colleagues [8] demonstrates equivalence between the factor structure of the Vardavaki, et al.'s study [6] and Hollins Martin and Martin's [3] study, however the findings from the current simulation study strongly indicate that a minimum sample size of N = 175 is required for future validation/translation studies of the BSS-R to avoid type 1 error. Identification of minimum N offers opportunity to consider the small and medium sample models. The first small sample (N = 50) model was found to represent a profoundly under-powered model, failing to reach any of the simulation quality criteria and indeed, all simulated model fit indices were unacceptable by any contemporary threshold standard. It is important to note that these findings are readily applicable in interpretation to EFA models, therefore the notion that has been postulated [12,13] that small N in model evaluation is statistically robust is clearly challenged by the current findings. Interestingly, the second small sample (N = 100) was observed to have approximated model fit indices that were within the acceptable range, however, consistent with the first small sample model, the sample size resulted in an underpowered model and RPSEB estimates outside the acceptable range. Both these small sample models would be at unacceptable risk of type 1 error. Similar to the model of Vardavaki, et al. [6], the third small sample model was found to be unacceptable based on RPSEB estimates. It was observed that all medium sample and large sample simulations had excellent power and approximated model fit indices in addition to satisfying the quality criteria for the Monte Carlo simulations. An appraisal of these models in terms of ascending sample size also reveals as would be anticipated improved overall model acceptability.
The clinical research reality of instrument translation and validation is often limits in terms of sample size due to the pragmatics of recruitment, resource availability, participant availability and convenience sampling. It is therefore no surprise that many validation studies are conducted with sample sizes between N = 100 - N = 200 and generally, these sample sizes are justified on the basis of 'rule of thumb' recommendations. The investigator in these circumstances is caught between a 'rock and a hard place' methodologically-speaking, balancing study requirements of participant availability, resource accessibility and scientific plausibility. A perusal of the literature reveals that many published EFA and CFA studies with sample sizes within the 'rule of thumb' range acknowledge caveat modest sample size as a limitation. It would be anticipated that a bespoke sample estimation for a specific instrument, in the case of the current study, the BSS-R, would engender confidence in the investigator in terms of justifiable sample size from the outset, thus presenting a prima face case for not only securing the resources required for conducting the study, but more, over determining from the outset the feasibility of the proposed investigation. Additionally, adherence to empirically-derived and instrument-specific sample size estimation may offer useful evidence in the write up of the study that sample size was indeed both sufficient and appropriate.
A limitation of the current study is that the sample size estimations derived by simulations conducted are specific to the BSS-R, therefore, the sample size estimations are not directly transferable to other instruments. The sample size estimations were also based on the assumption of a normal distribution, though this is entirely justified by the distributional characteristics observed from the original BSS-R validation study [3]. It is acknowledged that two factors that would impact on increasing sample size requirements for a CFA model are non-normal data and missing data [18]. We would therefore advocate that researchers consider these factors in relation to future BSS-R studies and indeed, any planned validation study. It is suggested that, wherever possible, complete data should be used for analysis and should a small degree (< 5%) of missing data be present, investigators consider robust data imputation methods to replace missing data points or alternatively delete missing cases.
Conclusion
The current simulation study has empirically estimated the minimum sample size for future validation studies of the BSS-R. The minimum sample size is N = 175. It is recommended that future validation studies on the BSS-R subscribe to this as a minimum sample size in order to avoid type 1 error. Thus studies which have sufficient sample size (N = 175) and find acceptable model fit can be determined to be adequately powered and the findings not the result of a 'false positive'. The study also revealed that a larger sample size results, as would be anticipated in greater power and precision, thus the provision of the Table within the paper will be of value in anticipating the findings from validation studies of a much larger sample size. The issue of sample size in EFA and CFA has traditionally been informed by 'rules of thumb' which are insensitive to the nuances and characteristics of the instrument under investigation. It is therefore suggested that irrespective of the particular instrument being considered for a validation study, a robust appraisal of sample size requirements be conducted as part of the formal planning phase of the study. The findings from the current study also highlight somewhat disconcerting limitations in the advocacy of small N for validation studies using EFA, CFA and SEM.
References
- Martin CH, Fleming V (2011) The birth satisfaction scale. Int J Health Care Qual Assur 24: 124-135.
- Sawyer A, Ayers S, Abbott J, et al. (2013) Measures of satisfaction with care during labour and birth: a comparative review. BMC Pregnancy Childbirth 13: 108.
- Hollins Martin CJ, Martin CR (2014) Development and psychometric properties of the Birth Satisfaction Scale-Revised (BSS-R). Midwifery 30: 610-619.
- Barbosa Leiker C, Fleming S, Hollins Martin CJ, et al. (2015) Psychometric properties of the Birth Satisfaction Scale-Revised (BSS-R) for US mothers. Journal of Reproductive and Infant Psychology 33: 504-511.
- Fatma Cosar Cetin, Ayse Sezer, Yeliz Dogan Merih (2015) The birth satisfaction scale: Turkish adaptation, validation and reliability study. North Clin Istanb 2: 142-150.
- Vardavaki Z, Hollins Martin CJ, Martin CR (2015) Construct and content validity of the Greek version of the Birth Satisfaction Scale (G-BSS). Journal of Reproductive and Infant Psychology 33: 488-503.
- Fleming SE, Donovan-Batson C, Burduli E, et al. (2016) Birth Satisfaction Scale/Birth Satisfaction Scale-Revised (BSS/BSS-R): A large scale United States planned home birth and birth center survey. Midwifery 41: 9-15.
- Martin CR, Vardavaki Z, Hollins Martin CJ (2016) Measurement equivalence of the Birth Satisfaction Scale-Revised (BSS-R): further evidence of construct validity. Journal of Reproductive and Infant Psychology 34: 394-402.
- Byrne BM (2010) Structural Equation Modeling with AMOS: Basic Concepts, Applications and Programming. (2nd edn), Routledge/Taylor and Francis Group, New York, London.
- Cattell RB (1978) The Scientific Use of Factor Analysis. Plenum, New York.
- Everitt BS (1975) Multivariate analysis: the need for data, and other problems. Br J Psychiatry 126: 237-240.
- De Winter JC, Dodou D, Wieringa PA (2009) Exploratory factor analysis with small sample sizes. Multivariate Behavioral Research 44: 147-181.
- Jung S, Lee S (2011) Exploratory factor analysis for small samples. Behav Res Methods 43: 701-709.
- Kline P (2000) A psychometrics primer. Free association books, London.
- Hutcheson G, Sofroniou N (1999) The multivariate social scientist: Introductory statistics using generalized linear models. Thousand Oaks, Sage, CA.
- Gorsuch RL (1983) Factor analysis. (2nd edn), Hillsdale, Erlbaum, NJ.
- Crothers CE, Dorrian J (2011) Determinants of nurses' attitudes toward the care of patients with alcohol problems. ISRN Nursing 2011: 821514.
- Muthén LK, Muthén BO (2002) How to use a monte carlo study to decide on sample size and determine power. Structural Equation Modeling: A Multidisciplinary Journal 9: 599-620.
- Cohen J (1988) Statistical power analysis for the behavioral sciences. (2nd edn), Lawrence Erlbaum Associates, NJ.
- Martin CR, Thompson DR (2000) Design and analysis of clinical nursing research studies. Routledge, London.
- Beaujean AA (2014) Sample size determination for regression models using Monte Carlo methods in R. Practical Assessment, Research & Evaluation 19: 1-16.
- Bentler PM (1990) Comparative fit indexes in structural models. Psychol Bull 107: 238-246.
- Hu LT, Bentler PM (1999) Cutoff criteria for fit indexes in covariance structure analysis: Conventional criteria versus new alternatives. Structural Equation Modeling: A Multidisciplinary Journal 6: 1-55.
- Hu LT, Bentler PM (1995) Evaluating model fit. In: RH Hoyle, Structural Equation Modelling: Concepts, Issues and Applications. Thousand Oaks, Sage, CA.
- Browne MW, Cudeck R (1993) Alternate ways of assessing model fit. In: KA Bollen, JS Long, Testing Structural Equation Models.
- Randall E Schumacker, Richard G Lomax (2010) A beginner's guide to structural equation modeling (3rd edn). Structural Equation Modeling: A Multidisciplinary Journal 18: 694-701.
- R Core Team (2015) R: A language and environment for statistical computing. R Foundation for Statistical Computing, Austria.
- Rosseel Y (2002) Lavaan: An r package for structural equation modeling. Journal of Statistical Software 48: 1-36.
- Pornprasertmanit S, Miller P, Schoemann A (2012) Simsem: Simulated structural equation modeling (Computer Program).
Corresponding Author
Colin R Martin, Professor of Mental Health, Faculty of Society and Health, Buckinghamshire New University, Uxbridge Campus, Room 2.11, 106 Oxford Road, Uxbridge, Middlesex, UB8 1NA, UK, Tel: 01494-522141, Extension: 2349, Fax: 01494-603179.
Copyright
© 2017 Martin CR, Hollins Martin CJ, et al. This is an open-access article distributed under the terms of the Creative Commons Attribution License, which permits unrestricted use, distribution, and reproduction in any medium, provided the original author and source are credited.