Accurate Evaluation of Dynamics and Specific Interactions in PLA/TiO2 Nanocomposites
Abstract
Near infrared spectroscopy in the transmission mode was used to study the effect of the presence of TiO2 nanoparticles on the dynamics of Polylactic Acid (PLA) in PLA/TiO2 nanocomposites. The variation of IR absorbance of certain bands, the average energy of those absorptions (< ν >, cm-1) and two-dimensional Infrared (2D IR) correlation spectroscopy as a function of temperature and TiO2 content (0, 1, 5 and 10% wt) were used. Thermal transitions associated to the glass transition (64 ℃) and cold crystallization temperatures (123 ℃) are clearly identified from the analysis of integrated absorbance of bands at 4770 and 4725 cm-1, assigned to amorphous phase, as they were more sensitive to temperature changes. The band at 4440 cm-1, related with the formation of crystalline regions, showed a better definition of the thermal transitions as well as the bands at 4307 and 4255 cm-1 associated to the combination of C-H wagging modes showed sharp changes, suggesting that transitions occur due to backbone conformational changes. The evolution of integrated absorbance of different bands in PLA-TiO2 nanocomposites as a function of temperature, seem to point out the presence of specific interactions between the C = O group and TiO2 nanoparticles. This effect is observed up to 1% wt whereas for higher loadings it is not possible to detect thermal transitions due to the scattered of the data for higher loadings of particles.
Keywords
Polymer dynamics, 2D-Infrared correlation spectroscopy, Polylactic Acid (PLA), TiO2 nanoparticles
Introduction
The incorporation of certain nanoparticles in a polymer matrix can lead to polymer nanocomposites with improved or unique properties in relation to the neat polymer. However, many times it is difficult to understand the real origin of the properties since it is not clear if they come from the sole presence of the particles, the specific interactions between them and the polymer matrix or a combination of both.
The simplest interpretation of the WGM phenomenon comes from geometric optics. When laser light is coupled into the sphere nearly tangentially (Figure 1a), it circumnavigates along the interior surface of the sphere through total internal reflection.
Probably, the easiest way to make physico-chemical interpretations about the influence of the presence of a nano filler is to ensure uniform dispersions of the nanoparticles because statistically all the effects should be averaged. However, even with a uniform dispersion of the nanoparticles there might be multiple interrelated factors contributing to the final properties of a nanocomposite: i) The nature of the constituents (polymer and particles); ii) The composition of the nanocomposite; iii) The existing specific interactions between constituents; iv) The induced morphology changes during processing by the presence of the particles; v) The size and shape of the particles; etc. Vibrational spectroscopic techniques are useful to study molecular structures, as well as environmental changes around and inter- or intra-molecular interactions [1-3]. Possibly, one of the most well-known and economically viable techniques for that purpose is infrared spectroscopy, IR. In fact, knowing the infrared absorption bands it is possible to monitor changes of chemical groups associated to specific interactions as well as vibrational couplings [4]. Therefore, studies about changes in polymer dynamics and its structural changes due to the presence of nanoparticles could be done by infrared spectroscopy.
Although there are other methods and techniques that can give information about the dynamics of a polymer such as DSC, DMA and others, conclusions at a molecular scale must be indirectly extracted. For this reason, experimental methods or techniques which directly allow extracting information at a molecular scale are always preferable. Among the cheapest and easiest handling methods in this sense is to monitor the evolution of selected infrared bands of a polymer as a function of temperature or time. For example, FTIR spectroscopy has been widely used to monitor curing reactions in polymer composites by analyzing the bands of different absorbing moieties as a function of curing time at different temperatures [5,6].
More recently, the analysis of FTIR-ATR absorption bands has been used for the study of the changes accompanying interfacial conformations and molecular structure in PMMA-silica nanocomposites [3,7]. Among the different IR ranges, spectra in the middle IR range are easier to interpret since; in general, the assignment of the bands corresponds to normal modes of vibration. However, for the middle range it is required very thin samples in order to avoid saturation of detectors. This limitation might impede extrapolating conclusions to thicker samples or polymer bulk. In the case of working with polymer composites this also would limit the way of preparing the samples and therefore; many times being impossible to mimic the real material as it is processed for a certain application [8]. To overcome this problem, IR spectroscopy in the near range may be used, since most of the times to have measurable absorbance relatively thick samples are needed. In this case the only disadvantage is the band assignment because in the near infrared region only overtones and combination bands appear. However, there are only a few research works which, based on NIR spectroscopy, have offer valuable information about structure and conformational changes of many molecules [9-12]. Besides, the use of FTIR spectroscopy in the near range with the aid of fluorescence spectroscopy has also allowed studying different processes such as chemical reactions [13,14], phase separation [15] or water absorption processes [16].
On the other hand, different ways to indirectly improve spectroscopic resolution exist and two-dimensional, 2D, correlation spectroscopy is probably one of the best. The theory of generalized 2D correlation spectroscopy was developed by I. Noda [17] in 1993, as an extension of the original 2D correlation spectroscopy proposed by him [18-20]. By the use of 2D correlation spectroscopy, it is possible to enhance spectra resolution of individual component bands. In the 2D analysis, two kinds of correlation maps, synchronous and asynchronous ones are generated based upon a set of dynamic spectra calculated from dynamic fluctuations of spectroscopic signals. The generalized 2D method can handle signals fluctuating as an arbitrary function of time or any other physical variable such as temperature, pressure, or even concentration [21-23]. Correlation peaks appearing in the synchronous and asynchronous maps represent in-phase and out-of-phase variation tendencies of corresponding band intensities, respectively. The generalized 2D correlation spectroscopy has been applied extensively to analyze IR spectra of polymer. The use of the 2D IR approach to analyze temperature-dependent spectra collected in situ during the temperature elevation process effectively enhances the spectral resolution, reveals details on the specific interactions and gives information about specific order of the spectral intensity changes taking place during the measurement from the analysis of the asynchronous spectra [24].
Poly(lactic acid) (PLA) (-[CH(CH3)COO]n-) is an environment friendly polymer that has found applications to produce biocompatible implant materials, plastic parts, films, fibers, etc. However, its poor mechanical properties, its relatively high gas permeability and the lack of other properties such as bactericidal effect have limited its use in some industrial applications [25]. In relation to the later issue modification of materials with nanostructures that exhibit antimicrobial properties may be an efficient mode of prevention of bio film development [26]. Particularly in the case of PLA based materials the modification of the polymer by the incorporation of nanoparticles with antibacterial properties might be a good choice to develop easy processing anti-microbial materials to be applied among others, in food packaging.
Titanium dioxide, TiO2, is a material in which, by the action of light transition of an electron occurs in the conduction band, resulting in a positive hole with oxidizing ability and a negative charge with reducing ability. Bacteria subjected to oxidative stress trigger a self-destruct mechanism that makes TiO2 a material which bactericidal properties are enhanced by the presence of light. Several studies have shown the bactericidal properties of TiO2 [27-32]. On the other hand, the small size of nanoparticles of TiO2 also improves the catalytic effect of this material which is also biocompatible [33,34]. Therefore, the addition of TiO2 nanoparticles should provide the final material some of their corresponding functional properties such as protection against UV radiation and bactericidal action.
However, in general, to be successful on improving the polymer nanocomposites properties nanofillers must be introduced within the polymer ensuring adequate dispersion of them. Besides, the uniform particle dispersion should ease the task of interpreting data about the effect of particles on the properties of the polymer. Up to now, several options have been investigated in order to attain the best dispersion of nanoparticles in polymer matrices, for example i) Modification of the nanoparticles surface [35-37]; ii) “in situ” polymerization by prior dispersion of the nanoparticles in a monomer [38] and iii) Addition of surfactants or other dispersant substances [39]. However, it is difficult to find some which ensure uniform dispersions in polymer matrices when the amount of nanofiller is higher than 5% by weight or when the polymer is highly viscous. In this context, using high energy ball milling promising results have been recently obtained [40-45]. It has been stated that the strong shear forces imposed by the milling process allow nanoparticles to be randomly embedded into the polymer [41].
In this research near infrared spectroscopy in the transmission mode was used to study the effect of the presence of TiO2 nanoparticles on the PLA dynamics in PLA/TiO2 nanocomposites. In particular, specific interactions between the nanofiller and the polymer will be determined analyzing FT-NIR spectra. The evolution of the absorbance of certain bands, the average energy of those absorptions and two-dimensional Infrared (2D IR) correlation spectroscopy as a function of temperature and TiO2 content were used to accurately study those interactions, the PLA dynamics so as their changes.
Experimental
Materials
Polylactic Acid (PLA) provided by Resinex Spain S.L. (manufactured by Nature Works LLC with reference code PLA Polymer 7032D with a specific gravity of 1.24) was used as the polymer matrix. Nanopowder of TiO2 purchased from Sigma Aldrich (purity 99.5% and average diameter < 100 nm) was used as the nanofiller. Dichloromethane supplied by Sigma Aldrich (purity 99.9%) was used as solvent to prepare solutions and suspensions of PLA + TiO2.
Sample preparation
A solution of 2.0 grams of PLA in 10 mL of CH2Cl2 was prepared first swelling the polymer for 30 mins and then stirred for 1 h. Then a sonicated solution of TiO2 nanoparticles in 10 mL of CH2Cl2 was mixed with the PLA solution. The mixture was stirred for 1h and then casted on a Petri dish at room temperature. The pre-films obtained after casting were dried in an oven at 40 ℃ for 24 h. The material was hot-pressed in a FONTIJNE PRESSESS machine model TP400 at 160 ℃ with a load of 30 kN for 10 mins to obtain the final film materials (Figure 1) with an average thickness of 200 µm. the following nomenclature was used for the samples: PLA (Pure Polylactic Acid) and PLA- X TiO2 for the composites where 'x' indicates the amount of nanoparticles in weight percent.
Near range fourier transform infrared spectroscopy, FT-NIR
Structural and dynamics studies were done by Fourier transformed infrared spectroscopy in the near range, FT-NIR, and measured with a Perkin Elmer Spectrum GX. The FT-NIR transmission spectra for each sample were recorded as a function of temperature. Spectra were collected from the average of 20 scans in the range of 5000 to 4000 cm-1, with a resolution of 4 cm-1. The samples were located in an oven SPECAC in the sample holder of the spectrometer. A temperature ramp from 30 to 170 ℃ at a 2 ℃/min was programmed and run using a PC and a temperature controller with an accuracy of ± 1 ℃.
Results and Discussion
In the case of PLA polymer the most prominent absorption bands occurring in the near region of the infrared, NIR, are related to overtones and combinations bands of fundamental vibrations of the groups -CH3, C = O, and C-O-C [46]. Unfortunately, the assignment of NIR bands of PLA has not been fully established yet [47]. Hence, a first effort should be focused on band assignment that might be useful for the subsequent analysis of the PLA dynamics under the influence of the presence of TiO2 nanoparticles.
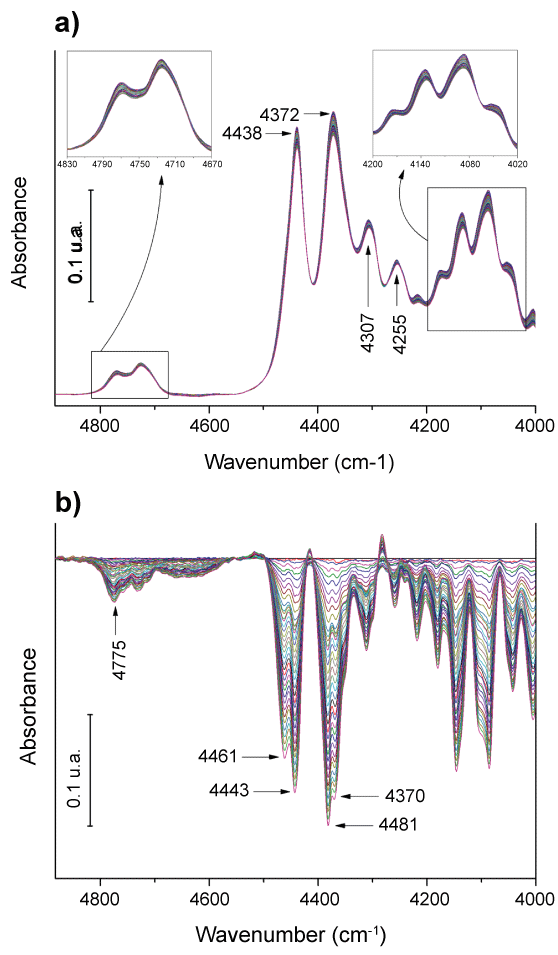
Figure 2a shows near-infrared spectra of neat PLA film at different temperatures. As can be seen the NIR bands do not seem to show big changes as a function of temperature. In order to choose conveniently bands with the most significant changes, subtractions between the spectra at a certain temperature with the spectrum obtained at room temperature were considered (Figure 2b). The most evident observation was that the absorbance of at all bands decreases with temperature. The most common interpretation for this behavior can be made in terms of the number of absorbing species. As temperature increases, the material density decreases the concentration of absorbing species decreases and therefore their corresponding optical density [8].
On the other hand, band splitting phenomena are clearly observed in the difference spectra (Figure 2b). For example, the band at 4438 cm-1 turns into two bands at 4461 and 4443 cm-1 during the heating and the band at 4372 cm-1 splits into two bands at 4381 and 4370 cm-1 respectively. For some other bands a clear split is not observed but distortion of their shapes is observed instead. These results revealed therefore that the heating induces structural changes in the polymer which are reflected in the relative position of the absorbing groups therefore in their corresponding specific interactions and consequently, in the required energy to activate the vibrations. Taking into account the band assignments proposed by Jianming Zhang, et al. [48] of amorphous and semi crystalline PLLA in the 500-1000 cm-1 region it seems reasonable to think that the splitting must come from small variations in the contribution of the two phases, amorphous and crystalline. In fact, considering the assignation already known for the middle range IR bands [48,49] it could be stated that: i) The bands found between 4830 cm-1 and 4670 cm-1 can be associated to combinations of the CH3 asymmetric stretching with the C = O stretching; ii) The band centered at 4438 cm-1 can be assigned to the combination of the CH3 asymmetric stretching with the CH3 asymmetric bending; iii) The band at 4372 cm-1 can be assigned to the combination of the CH3 symmetric stretching with the CH3 asymmetric bending; iv) The band found at 4307 cm-1 can be assigned to the combination of the CH3 symmetric stretching with the CH3 asymmetric bending although there exist another possibility the combination of the CH3 asymmetric stretching with the C-H wagging; v) The band found at 4255 cm-1 can be assigned to the combination of the CH3 symmetric stretching with the CH3 symmetric bending (these band assignments and others can be found in Table 1).
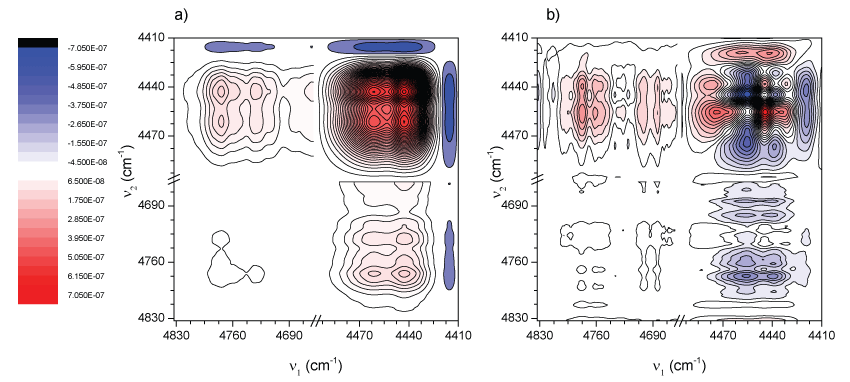
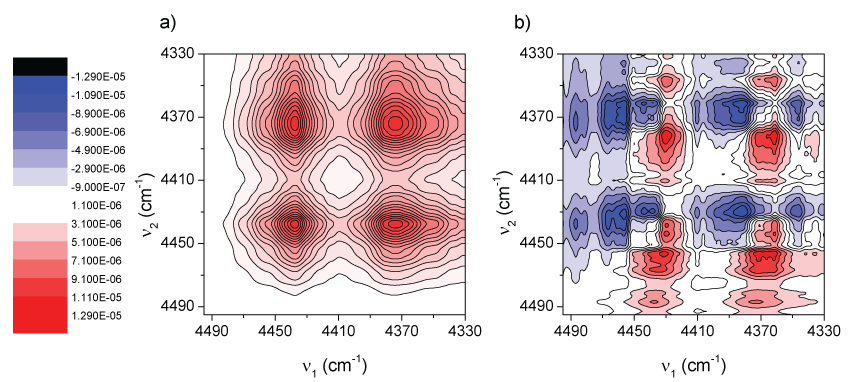
Figure 3 shows the synchronous and asynchronous correlation spectra of PLA, in the region of 4830-4410 cm-1, calculated from the spectra in Figure 2. The intensity of a synchronous 2D correlation spectrum Φ(ν1, ν2) represents the simultaneous or coincidental changes of spectral intensity variations measured at ν1 and ν2; an asynchronous spectrum Ψ(ν1, ν2), on the other hand, represents sequential or successive changes of spectral intensities measured at ν1 and ν2. According to Noda's rules [50,51] the sign of an asynchronous cross-peak becomes positive, if the intensity change at ν1 occurs predominantly before ν2 in the sequential order of the variable (in this case, the temperature). It becomes negative, on the other hand, if the change occurs after ν2. This rule is, however, reversed if the corresponding synchronous intensity becomes negative; i.e., Φ(ν1, ν2) < 0. On the basis of this unique feature of asynchronous spectra, we expect to obtain more information about the origin of the three bands at 4770, 4725, and 4438 cm-1.
In the synchronous spectrum (Figure 3a) apart from the three bands mentioned above, another band located around 4460 cm-1 can also be de convoluted effectively. According to the sign of cross-peaks in Figure 3a, the intensities of all the bands vary in the same direction (a decrease in intensity as temperature increases, see Figure 2). This trend was already explained in terms of density changes. However, depending on the phase considered (amorphous or crystalline), the changes could be faster or slower. Taking into account that the amorphous phase should change its density faster the 2D asynchronous spectra should give information to identify those bands more related with a particular phase.
In the asynchronous spectrum (Figure 3b), there is a non-expected cross-peak, attending the synchronous spectrum (Figure 3a), where a band at around 4690 cm-1 correlates with those in the range 4410-4500 cm-1. In fact in Figure 2b it is observed the disappearance of a band centered at about 4690 cm-1 being in good agreement with these observations.
Besides, it is not difficult to see that the so-called “butterfly pattern” appears in apparently splitting of the band at 4438 cm-1. Usually, the appearance of such a pattern in an asynchronous spectrum is attributed to a peak shift combined with the intensity changes [52]. Considering this, one could conclude that there is not a real splitting in the band at 4438 cm-1. On the other hand, from the asynchronous spectrum (Figure 3b), other information was obtained only from the clearly well separated cross-peaks. According to Noda's rule, from Φ(4770,4460-4440) > 0, Φ(4725,4460-4440) > 0, Φ(4770,4460-4440) > 0, Φ(4725,4460-4440) > 0 presented respectively in Figure 3a and Figure 3b, the intensity changes of the 4770 and 4725 cm-1 bands occur prior to that of the 4460 cm-1 and 4440 cm-1 signals. Second, in Figure 3b it is noted that there is no cross-peak between the bands at 4770 and 4725 cm-1. This indicates that the changes of these two bands are synchronous. All these results are suggesting first, that absorption bands at 4770 and 4725 cm-1 proceed from modes of groups located in the same region (or phase) and because they are more sensitive to temperature changes they should have more participation of the amorphous phase whose changes in density with temperature are faster.
To confirm the above mentioned it is possible to study the polymer dynamics under the effect of increasing temperature. Simply by representing the absorbance and the wave numbers of the bands as a function of temperature one should have a general idea of different thermal transitions at a molecular scale. Besides, depending on the sensitiveness of the particular band to a given thermal transition important conclusions may be extracted in terms of the groups participating in a certain phase, crystalline or amorphous for instance.
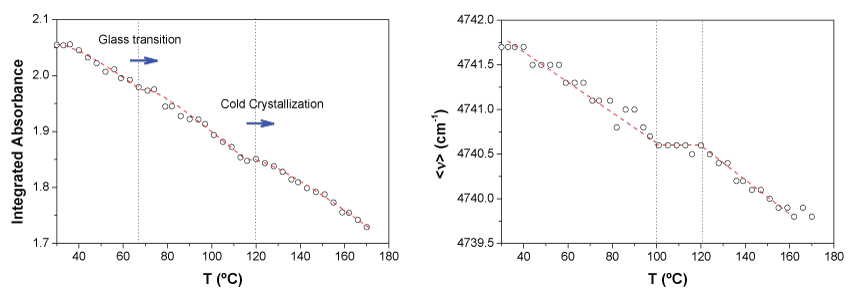
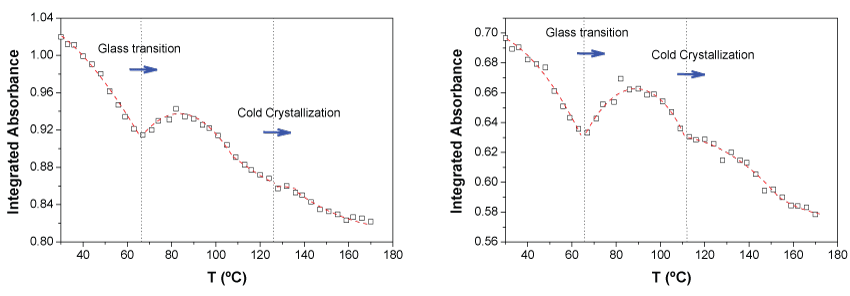
In Figure 4 the integrated absorbance of both synchronized bands at 4770 and 4725 cm-1 and the first moment, < ν >, associated to the distribution of energies of the two bands for the neat PLA are represented as a function of temperature.
As expected, the general absorbance decreases with temperature. This trend can be explained considering a simple reduction of density which implies lower concentration of the absorbent species. However, at particular values of temperature, 64 ℃ and 123 ℃ respectively there are abrupt changes of this tendency for which the slope decreases. Here, it is important to highlight that those values of temperature are coincident with the enthalpy relaxation just after the glass transition temperature, Tg, and the temperature at the maximum rate of the cold crystallization for the neat PLA as revealed DSC experiments. Just when those processes are occurring there is a reordering of chains, consequently at those points, in terms of absorbance, the higher order should compensate the density decrease due to the increase of temperature as it is observed (Figure 4, left).
On the other hand, although very slightly, the first moment decreases continuously with temperature, indicating a very small shift of the bands to lower wave numbers. The use of the first moment of spectral bands allows following very small spectral shifts with an indirectly increased accuracy, thus avoiding the limitations imposed by the measurement resolution of the equipment [53]. This variation of the first moment may be associated with an increase in the population of the most energetic rotational levels of the corresponding vibrational ground state. This effect is usually called 'hot bands' which are red shifted with respect to the corresponding fundamental transitions (they appear at lower wave numbers) [8,54]. In Figure 4b it can be also seen a clear change in the tendency of the first moment with temperature in the interval 100-120 ℃ which matches with the interval in which the cold crystallization occurs.
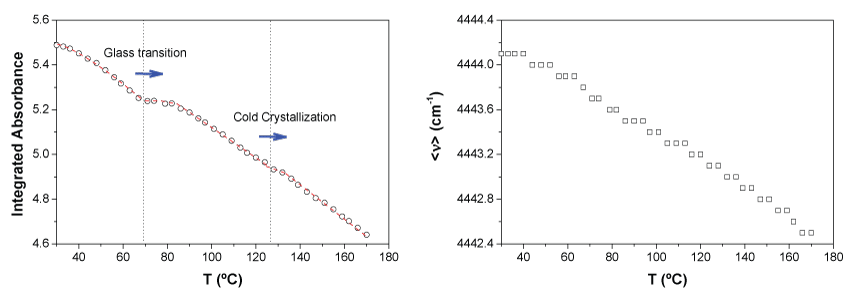
In Figure 5 is represented the integrated absorbance and the first moment of the band centered at 4440 cm-1 for the neat PLA. In terms of profiles, similar results to those of the bands at 4770 and 4725 cm-1 were found. However, the representation of the integrated absorbance shows better definition of the thermal transitions. This result is in accordance with the consideration that the band at 4440 cm-1 arises form vibrations of groups more related with the formation of the crystalline regions since they are more sensitive to changes in the macromolecular chain order. The absorption at 4770 and 4725 is caused by combination modes of the groups C = O and CH3 while in the case of absorption at 4440 cm-1 only the methyl group participates. Therefore, it seems that the methyl group is the main group being affected by changes in the molecular order in the PLA polymer. This result is also in agreement with the consideration of that the CH3 groups form close inters chain contact during crystallization as stated J. Zhang, et al [49]. The first moment does not seem to be sensitive enough as to see thermal changes, with the band at 4440 cm-1, since no clear changes of slope were observed.
On the other hand, from the analysis of data in Figure 4 and Figure 5 it is observed that the relative change of absorbance for the bands at 4770 and 4725 cm-1 in the interval of temperatures monitored was 15.8% while in the case of the band at 4440 cm-1 15.4%. This result is in agreement with what is observed in the 2D correlation spectra of Figure 3, the absorbance changes of the 4770 and 4725 cm-1 bands occur faster than that of the 4440 cm-1 signal.
The rest of bands show similar results except those at 4307 cm-1 and 4255 cm-1 showing the sharpest changes of absorbance with temperature (Figure 6). It seems that these bands have an important contribution of combination with the C-H wagging mode of the tertiary carbon. Therefore, one could conclude that transitions occur mainly due to backbone conformation changes occurring when the most rigid part of the monomer unit start having more free motion looking for more favorable interactions which allow them to be more stacked or ordered. Therefore, during the ageing phenomena and/or the cold crystallization there must be mainly a local increase of C-H concentration because of macromolecular chain ordering which causes absorbance to increase.
To study the influence of the presence of the nanoparticles of TiO2 for a specific temperature one could study the evolution of absorbances, shifts of bands and band ratios as a function of the amount of nanoparticles. However, taking into account the difficulty on preparing samples exactly with the same amount of material and/or thickness very difficult processes of spectra correction should be done in order to have all spectra ready for comparisons. On the other hand, it has been demonstrated that the use of the 2D IR approach effectively enhanced the spectral resolution and revealed details on the specific interactions and conformational changes which are not easily detected in the traditional one-dimensional spectra [24]. Therefore, 2D correlation spectroscopy will be carried out to understand the possible structure changes appearing in the PLA due to specific interactions between the TiO2 nanoparticles.
The 2D correlation was performed as a function of the TiO2 nanoparticles content at three temperatures, 30, 82 and 170 ℃ respectively. These temperatures were chosen because 30 ℃ represents one temperature well below the glass transition temperature, Tg, of PLA. 82 ℃ because is a temperature in between the Tg and the cold crystallization temperature, Tcc, and 170 ℃ was chosen because is a slightly higher temperature than the melting point of PLA.
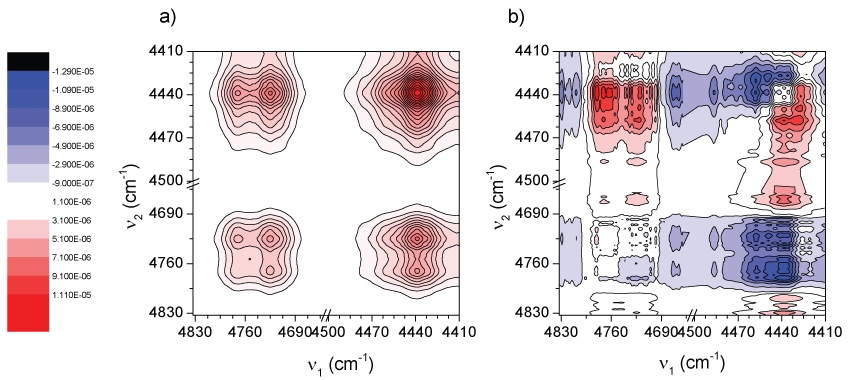
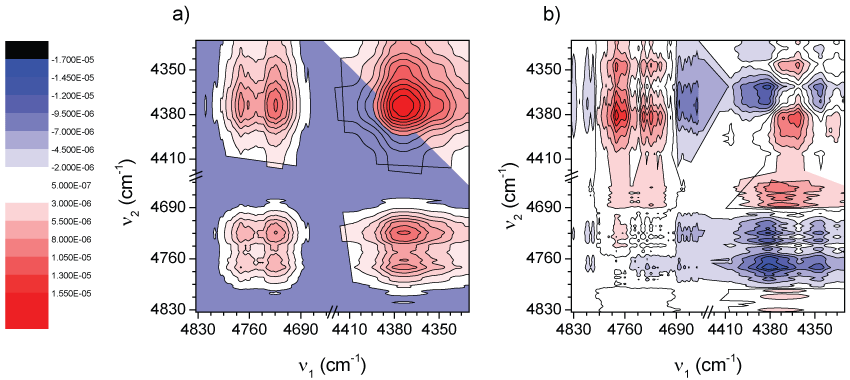
The Figure 7, Figure 8 and Figure 9 show the 2D correlation spectra between three NIR regions when the variable is the TiO2 nanoparticle content (0, 1, 5 and 10%) at 82 ℃. For the rest of temperatures similar results were observed. In Figure 7 the region between 4490 and 4330 cm-1 is considered where correlations between the bands at 4428 cm-1 and at 4372 cm-1 might be observed. In Figure 7a it is observed how these bands do correlate positively without showing any band splitting. In the corresponding asynchronous spectrum (Figure 7b) again the so-called “butterfly pattern” appears therefore here it could be said again that the pseudo correlation seems to be due to very slight peak shifts combined with the intensity changes [55]. The later suggests no new specific interactions with CH3 groups since all its vibrational modes seem to be altered in the same way and only a proportional decrease of absorbance occurs due to a decrease of the absorbing group's concentration of PLA when the TiO2 content is increased.
In Figure 8 correlations as a function of TiO2 content between the bands at 4770, 4725 and 4440 cm-1 are considered. It is observed how these bands do correlate positively without showing any band splitting. However, in the corresponding asynchronous spectrum (Figure 8b) following the Noda's rules it is possible to see how the bands at 4770 and 4725 cm-1 precede their variations to that of the band at 4440 cm-1. This result may be and indicative that the presence of TiO2 nanoparticles affects in a different way the carbonyl group (which participate in the combination mode whose absorption occurs at 4770 and 4725 cm-1) than that of the methyl group. If the carbonyl group of the polymer interact favorably with the surface of the TiO2 nanoparticles and additional decrease of absorbance might be expected since the change in the dipole moment may be lower if stretching is inhibited.
In Figure 9 correlations between the bands at 4770, 4725 and 4370 cm-1 are considered. It is observed how these bands do correlate in the same way as it happened between the bands 4770, 4725 and 4440 cm-1 (Figure 8). Taking into account that the band at 4370 cm-1 arises from combination of vibration of the methyl group as in the case of the band at 4440 cm-1 the same conclusion can be extracted. The carbonyl group seems to specifically interact with TiO2 nanoparticles.
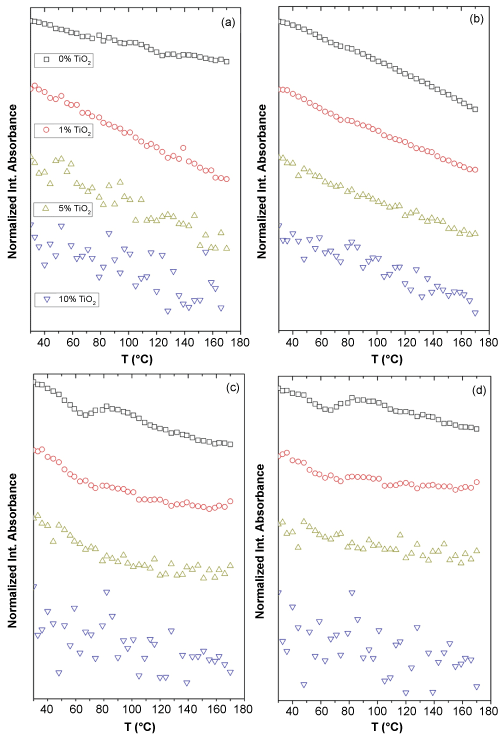
Finally, the influence of the presence of TiO2 nanoparticles in the PLA dynamics was studied from the NIR spectra recorded during heating from 30 to 170 ℃ at a 2 ℃/min for the different systems or samples under consideration with different TiO2 contents. In this case only the change in the integrated absorbance for certain bands (4770 cm-1 + 4725 cm-1, Figure 10a, 4440 cm-1, Figure 10b, 4307 cm-1, Figure 10c and 4255 cm-1, Figure 10d) was considered. Regardless the band chosen similar results were obtained. The absorption in general decreases with temperature independently of TiO2 content and the higher the amount of filler the more scattered the data. The last observation can be explained taking into account that the higher the TiO2 contain the smaller the amount of polymer for the same amount of sample. Therefore, the integrated absorbance is getting lower and lower with the consequence of decreasing the signal to noise ratio that surely causes the high scatter observed for the higher loaded samples. These scattered results impede clearly identify the thermal transitions in the samples with higher amount of nanofiller. However, from the samples with lower amount of nanoparticles interesting observations and conclusions can be extracted. It is observed an increase of about 10 ℃ in the glass transition temperature when 1% by weight of TiO2 nanoparticles is added to the neat PLA. This result is indicating a restriction on the PLA chain motion under the presence of TiO2 nanoparticles that could be caused by the specific interactions found between the carbonyl groups of the polymer and the nanoparticles.
The band at 4770 and 4725 cm-1 does not seem to be sensitive enough to detect thermal transitions in the presence of TiO2 nanoparticles. The bands at 4440, 4305 and 4255 cm-1 all are sensitive to the presence of nanoparticles, at least up to 1% (wt/wt). All three bands result from the combination of methyl group vibration modes. In fact the sharpest changes are observed in (Figure 10c) and (Figure 10d), where bending vibrations of methyl groups are involved. These results suggest that methyl groups are in close inter-chain contact during thermal transitions as it was observed before [49].
Conclusions
Near infrared spectroscopy in the transmission mode was used to study the effect of the presence of TiO2 nanoparticles on the PLA dynamics in PLA/TiO2 nanocomposites. The evolution of the absorbance of certain bands, the average energy of those absorptions (< ν >, cm-1) and 2D IR correlation spectroscopy as a function of temperature and TiO2 content were used to accurately study those interactions, the PLA dynamics so as their changes.
Thermal transitions associated to the glass transition (64 ℃) and cold crystallization temperatures (123 ℃) are clearly identified from the analysis of integrated absorbance of the different bands. Absorption bands at 4770 and 4725 cm-1 were more sensitive to temperature changes suggesting a higher participation of the amorphous phase whose changes in density with temperature are faster. The band at 4440 cm-1, related to the formation of crystalline regions, showed a better definition of the thermal transitions. Bands at 4307 and 4255 cm-1 associated to the combination of C-H wagging modes showed sharp changes, suggesting that transitions occur due to backbone conformational changes.
The 2D correlation was performed as a function of the TiO2 nanoparticles content (0,1,5 and 10%) at three temperatures, 30, 82 and 170 ℃ respectively. Results suggest that the carbonyl group seems to specifically interact with TiO2 nanoparticles. An increase of approximately 10 ℃ in the glass transition temperature was observed for the nanocomposites with 1% by weight of TiO2 nanoparticles. This result is indicating a restriction on the PLA chain motion in the presence of TiO2 nanoparticles that could be caused by the specific interactions found between the carbonyl groups of the polymer and the nanoparticles. The results of this study also suggest that the method is not sensitive enough for PLA-TiO2 nanocomposites with high TiO2 loadings because the amount of polymer decreases and scatter of the data increases.
Acknowledgements
Authors gratefully acknowledge financial support from the Ministerio de Ciencia e Innovación (project MAT2010-16815) and the Ministerio de Economia y competitividad (Project MAT2014-59116-C2-1-R) and project number 2011/00287/002.
References
- Madejova J (2003) FTIR techniques in clay mineral studies. Vib Spectrosc 31: 1-10.
- Tyagi B, Chudasama CD, Jasra RV (2006) Determination of structural modification in acid activated montmorillonite clay by FT-IR spectroscopy. Spectrochim Acta A Mol Biomol Spectrosc 64: 273-278.
- Gonzalez Benito J, Gonzalez Gaitano G (2008) Interfacial Conformations and Molecular Structure of PMMA in PMMA/Silica Nanocomposites. Effect of High-Energy Ball Milling. Macromolecules 41: 4777-4785.
- Koenig JL (1999) Spectroscopy of Polymers. (2nd edn), Elsevier Science, New York, USA.
- Gonzalez Benito J, Mikes F, Baselga J, et al. (2002) Fluorescence Method Using Labeled Chromophores to Study the Curing Kinetics of a Polyurethane System. J App Polym Sci 86: 2992-3000.
- J Gonzalez Benito (2003) The Nature of the Structural Gradient in Epoxy Curing at a Glass Fiber/Epoxy Matrix Interface using FTIR Imaging. J Colloid Inter Sci 267: 326-332.
- Sanchez FA, Redondo M, Olmos D, et al. (2014) A Near-Infrared Spectroscopy Study on Thermal Transitions of PMMA and PMMA/SiO2 Nanocomposites. Macromolecular Symposia 339: 48-59.
- Olmos D, Martin EV, Gonzalez Benito J (2014) New Molecular-Scale Information of Polystyrene Dynamics in PS and PS-BaTiO3 composites from FTIR spectroscopy. Phys Chem Chem Phys 16: 24339-24349.
- Wu P, Siesler HW (1999) The assignment of overtone and combination bands in the near infrared spectrum of polyamide 11. J Near Infrared Spectrosc 7: 65-76.
- Ozaki Y, Murayama K, Wang Y (1999) Application of two-dimensional near-infrared correlation spectroscopy to protein research. Vib Spectrosc 20: 127-132.
- Ozaki Y, Siesler HW, Kawata S, et al. (2002) Near-Infrared Spectroscopy. Weinheim, Germany.
- Wang J, Sowa MG, Ahmed MK, et al. (1994) Photoacoustic near-infrared investigation of homo-polypeptides. J Phys Chem 98: 4748-4755.
- Olmos D, Aznar AJ, Baselga J, et al. (2003) Kinetic study of the epoxy curing in the glass fiber/epoxy interface using dansyl fluorescence. J Colloid Interface Sci 267: 117-126.
- Castrillo PD, Olmos D, Torkelson JM, et al. (2010) Kaolin-Epoxy-Based Nanocomposites: A Complementary Study of the Epoxy Curing by FTIR and Fluorescence. Polym Compos 31: 781-791.
- Olmos D, Loayza A, Gonzalez-Benito J (2010) Phase-Separation Process in a Poly(methyl methacrylate)-Modified Epoxy System: A Novel Approach to Understanding the Effect of the Curing Temperature on the Final Morphology. J Applied Polym Sci 117: 2695-2706.
- Olmos D, Lopez-Moron R, Gonzalez-Benito J (2006) The nature of the glass fibre surface and its effect in the water absorption of glass fibre/epoxy composites. The use of fluorescence to obtain information at the interface. Comp Sci Technol 66: 2758-2768.
- Noda I (1993) Generalized 2-dimensional correlation method applicable to infrared, raman, and other types of spectroscopy. Appl Spectrosc 47: 1329-1336.
- Noda I (1986) Bull. Am Phys Soc 31: 520-524.
- Noda I (1989) Two-dimensional infrared spectroscopy. J Am Phys Soc 111: 8116-8118.
- Noda I (1990) Two-dimensional infrared (2D IR) spectroscopy: theory and applications. Appl Spectrosc 44: 550-561.
- Noda I, Liu Y, Ozaki Y, et al. (1995) 2-dimensional Fourier-transform near-infrared correlation spectroscopy studies of temperature-dependent spectral variations of oleyl alcohol. J Phys Chem 99: 3068-3073.
- Noda I, Liu Y, Ozaki Y (1996) Two-dimensional correlation spectroscopy study of temperature-dependent spectral variations of N-methylacetamide in the pure liquid state .1. Two-dimensional infrared analysis. J Phys Chem 100: 8665-8673.
- Noda I, Liu YL, Ozaki Y (1996) Two-dimensional correlation spectroscopy study of temperature-dependent spectral variations of N-methylacetamide in the pure liquid state .2. Two-dimensional Raman and infrared-Raman heterospectral analysis. J Phys Chem 100: 8674-8680.
- Jiang H, Wu P, Yang Y (2003) Variable Temperature FTIR Study of Poly(ethylene-co-vinyl alcohol)-graft-poly(E-caprolactone). Biomacromolecules 4: 1343-1347.
- Chiang MF, Chu MZ, Wu TM (2011) Effect of layered double hydroxides on the thermal degradation behavior of biodegradable poly (L-lactide) nanocomposites. Polym Degrad Stab 96: 60-66.
- Martinez-Gutierrez F, Boegli L, Agostinho A, et al. (2013) Biofouling 29: 651-660.
- Nieto I, Olmos D, Orgaz B, et al. (2014) Titania Nanoparticles Prevent Development of Pseudomonas fluorescens Biofilms on Polystyrene Surfaces. Mater Lett 127: 1-3.
- JM Arroyo, D Olmos, B Orgaz, et al. (2014) Effect of the Presence of Titania Nanoparticles in the Development of Pseudomonas fluorescens biofilms on LDPE. RSC Adv 4: 51451-51458.
- Bahloula W, Mélisa F, Bounor-Legaréa V, et al. (2012) Mater Chem Phys 134: 399-404.
- Robertson JMC, Robertson PKJ, Lawton LA (2005) A comparison of the effectiveness of TiO2 photocatalysis and UVA photolysis for the destruction of three pathogenic micro-organisms. J Photochem Photobiol A: Chem 175: 51-56.
- Rincon AG, Pulgarin C (2003) Photocatalytical inactivation of E. coli: effect of (continuous–intermittent) light intensity and of (suspended–fixed) TiO2 concentration. Appl Catal B Env 44: 263-284.
- Christos Trapalis, Panagiotis E Keivanidis, George Kordas, et al. (2003) TiO2 (Fe3+) nanostructured thin films with antibacterial properties. Thin Solid Films 433: 186-190.
- Rong Min Wang, Bo Yun Wang, YuFeng He, et al. (2010) Preparation of composited Nano-TiO2 and its application on antimicrobial and self-cleaning coatings. Polym Adv Technol 21: 331-336.
- Chawengkijwanich C, Hayata Y (2008) Development of TiO2 powder-coated food packaging film and its ability to inactivate Escherichia coli in vitro and in actual tests. Int J Food Microbiol 123: 288-292.
- Kim P, Jones SC, Hotchkiss PJ, et al. (2007) Phosphonic acid-modiried barium titanate polymer nanocomposites with high permittivity and dielectric strength. Adv Mater 19: 1001-1005.
- Yang MJ, Dan Y (2005) Preparation and characterization of poly(methyl methacrylate)/titanium oxide composite particles. Colloid Polym Sci 284: 243-250.
- Benjamin J Ash , Richard W Siegel, Linda S Schadler (2004) Mechanical behavior of alumina/poly(methyl methacrylate) nanocomposites. Macromolecules 37: 1358-1369.
- Bikiaris DN, Vassiliou A, Pavlidou E, et al. (2005) Compatibilisation effect of PP-g-MA copolymer on iPP/SiO2 nanocomposites prepared by melt mixing. Eur Polym J 41: 1965-1978.
- Reynaud E, Jouen T, Gauthier C, et al. (2001) Nanofillers in polymeric matrix: a study on silica reinforced PA6. Polymer 42: 8759-8768.
- Olmos D, Martinez Tarifa JM, Gonzalez Gaitano G, et al. (2012) Uniformly dispersed submicrometre BaTiO3 particles in PS based composites. Morphology, structure and dielectric properties. Polym Test 31: 1121-1130.
- Olmos D, Dominguez C, Castrillo PD, et al. (2009) Crystallization and final morphology of HDPE: Effect of the high energy ball milling and the presence of TiO2 nanoparticles. Polymer 50: 1732-1742.
- Olmos D, Montero F, Gonzalez Gaitano G, et al. (2013) Structure and Morphology of Composites Based on Polyvinylidene Fluoride Filled With BaTiO3 Submicrometer Particles: Effect of Processing and Filler Content. Polym Comp 34: 2094-2104.
- Castrillo PD, Olmos D, Amador DR, et al. (2007) Real dispersion of isolated fumed silica nanoparticles in highly filled PMMA prepared by high energy ball milling. J Colloid Inter Sci 308: 318-324.
- Serra R, Gonzalez-Gaitano G, Gonzalez-Benito J (2012) Composites Based on EVA and Barium Titanate Submicrometric Particles: Preparation by High-Energy Ball Milling and Characterization. Polym Compos 33: 1549-1556.
- Olmos D, Rodriguez-Gutierrez E, Gonzalez-Benito J (2012) Polymer structure and morphology of low density polyethylene filled with silica nanoparticles. Polym Compos 33: 2009-2021.
- Reich G (2005) Near-infrared spectroscopy and imaging: basic principles and pharmaceutical applications. Adv Drug Deliv Rev 57: 1109-1143.
- Shinzawa H, Nishida M, Tanaka T, et al. (2012) Thermal behavior of drawn poly (lactic acid)-nanocomposite fiber probed by near-infrared hyperspectral imaging based on roundtrip temperature scan. Anal Methods 4: 2259-2265.
- Zhang J, Tsuji H, Noda I, et al. (2004) Structural Changes and Crystallization Dynamics of Poly(L-lactide) during the Cold-Crystallization Process Investigated by Infrared and Two-Dimensional Infrared Correlation Spectroscopy. Macromolecules 37: 6433-6439.
- Zhang J, Tsuji H, Noda I, et al. (2004) Weak Intermolecular Interactions during the Melt Crystallization of Poly(L-lactide) Investigated by Two-Dimensional Infrared Correlation Spectroscopy. J Phys Chem B 108: 11514-11520.
- Noda I (2000) Determination of two-dimensional correlation spectra using the Hilbert transform. Appl Spectrosc 54: 994-999.
- Noda I, Dowrey AE, Marcott C, et al. (2000) Generalized two-dimensional correlation spectroscopy. Appl Spectrosc 54: 236-248.
- Czarnecki MA (1998) Interpretation of two-dimensional correlation spectra: Science or art? Appl Spectrosc 52: 1583-1590.
- Mikes F, González-Benito J, Serrano B, et al. (2002) Fluorescence Monitoring of Polyaddition Reactions. Treatment of Fluorescence Experimental Data for Determination of Conversion Degree. Polymer 43: 4331-4339.
- Coates J (2000) Interpretation of Infrared Spectra, A Practical Approach. In: RA Meyers, Encyclopedia of Analytical Chemistry. John Wiley & Sons Ltd, Chichester, England, 10815-10837.
- Czarnecki MA (2000) Two-dimensional correlation spectroscopy: Effect of band position, width, and intensity changes on correlation intensities. Appl Spectrosc 54: 986-993.
Corresponding Author
J González Benito, Department of Materials Science and Engineering and Chemical Engineering, IQMAAB, Universidad Carlos III de Madrid, Av. Universidad 30, 28911 Leganes, Madrid, Spain.
Copyright
© 2017 González EAS, et al. This is an open-access article distributed under the terms of the Creative Commons Attribution License, which permits unrestricted use, distribution, and reproduction in any medium, provided the original author and source are credited.

