Low Cost ECG Using Neuro-Diffuse System for Recognition of Medical Signs
Abstract
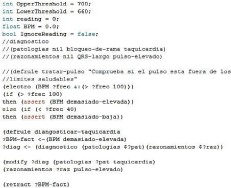
The objective of this project is to optimize the diagnostic process in the industry dedicated to the medical sector through diffuse control. For this, an automated system capable of carrying out the aforementioned process will be implemented in such a way that the diagnosis is carried out in an automated manner and in this way will reduce the risks and costs in the medical industry. This will have a portable device mechanism in which several pathologies will be diagnosed in the heart, three wires of different colors that will show the signal on the mobile screen, and an embedded system that will perform the digital signal processing system.
Keywords
Automation, ECG, INA
Introduction
At present, the use of devices or instruments to know certain information by the organs of the human body, has helped and facilitated a large number of doctors and patients to determine the treatment to follow and to be able to have a control or health record. The electrocardiogram (ECG) is a record of the electrical activity of the heart, the information of which is not limited to the conduction zone, but to the entire heart as a whole [1]. The electrocardiogram, also called ECG, is a traditional method definitively established in current electrocardiography as a very valuable diagnostic method. Due to its simplicity and low cost, the electrocardiogram has become one of the most widely used diagnostic techniques. The ECG is a non-invasive diagnostic procedure that is used to examine the electrical phenomena of the heart, which provide us with useful information about its functioning.
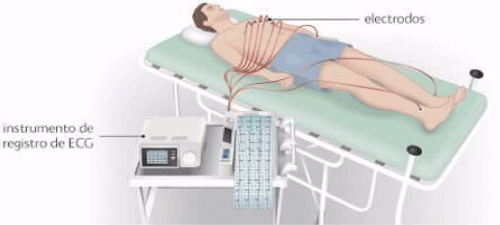
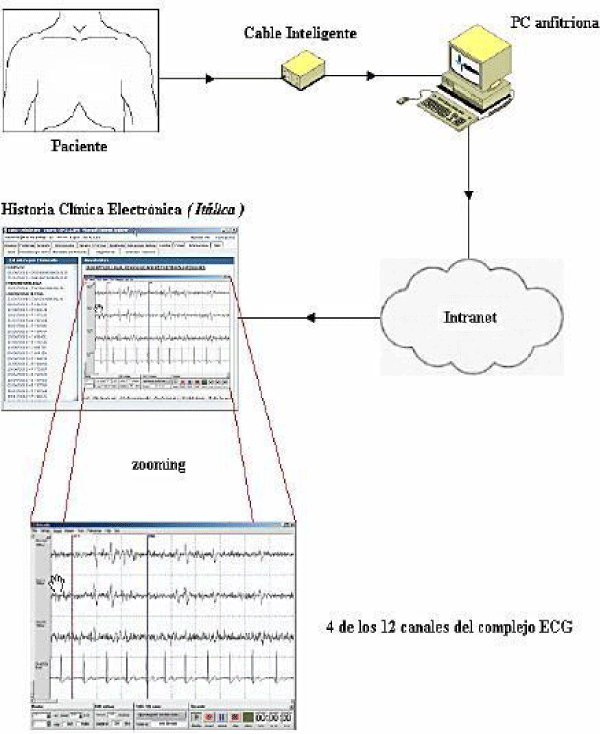
The ECG measures the electrical signals that make the heart beat. During the exam, wires are connected to the arms, legs, and chest to pick up the electrical signals. These signals can be displayed on a screen or plotted on a sheet of paper [2]. As seen in (Figure 1). This section defines the functional specifications of the project, which consists of the development of an electronic circuit based on a microprocessor for the generation of different studies and their transmission through an intranet or direct link to the server. This project is included in a framework for the development of a neuro-diffuse system for capturing biomedical signals, which in a first stage allows the capture of signals from the ECG complex for a remote or local diagnosis of possible heart disease, see (Figure 2).
The main objective in achieving this project has been to achieve an ideal size to facilitate portability and comfort in the use of the smart device, as well as to reduce the consumption of the circuit to the maximum, to make it robust enough so that it can be used without the worry of having to continually recharge it. The circuit works either with the universal power system consisting of two 1.5 V batteries with a warning device for the end of battery charge or powered directly from the host PC and its design with a power cable does not pose any risk to the patient [3]. The values recorded in the different biological signals are of a very small value, of the order of a few milli volts (ECG) or in some cases of the order of a few micro volts (EEG), as indicated in (Table 1) [4]. The specific arrangement that the electrodes keep when they are placed on the body surface is called a shunt [5].
More than 40 different leads have been used in the electrocardiographic recordings; however, twelve are usually recorded:
• 6 in the frontal plane called: Derivations of the limbs.
• 6 in the horizontal plane, precordial leads.
The 12 leads mentioned above are known as standard ECG leads and various measurements are obtained from the different signals through 10 electrodes placed on the surface of the skin:
• One in each of the lower and upper limbs or limbs, of which the one placed on the right leg is used as a reference electrode to reduce external electrical interference.
• And the other 6 on the patient's chest.
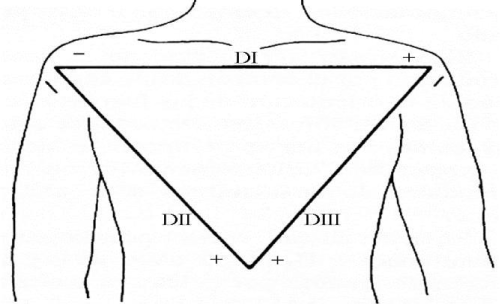
The 12 standard leads include three different types, of which we will focus on bipolar: Bipolar leads record the electrical signal from the heart between two specific electrodes. These are three, which are called as:
• Lead I, represents the potential difference measured between the electrode of the right arm and that of the left arm,
• Lead II, represents the potential difference between the electrode of the right arm and that of the left leg
• Lead III, given by the potential difference between the electrode of the left arm and that of the left leg.
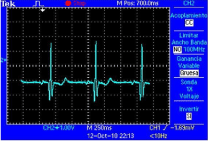
The union between these three signals represents the figure known as the Einthoven Triangle, see (Figure 3). The sample of the cardiac period is carried out by means of the derivative of signal 1 in order to obtain its maximum peak, which occurs when the R wave rises, this time where this maximum peak occurs is stored until the next peak occurs, the value stored between peak and peak of the R wave indicates the period of the cardiac signal [7].
The instrumental amplifier made is governed by equation 3. The transfer function being the gain. It should be noted that the inputs to the circuit are V1 and V2; these are the electrode outputs, that is, the common input [8].
The common input will be white noise from outside or from the environment surrounding the system. That is why the CMRR factor of the instrumental amplifier has to be as high as possible in this case the project has a CMRR factor greater than 100dB. Finally the gain of the amplifier is governed by the resistance R1 and Rg. In this case it will be 50. See equation 4.
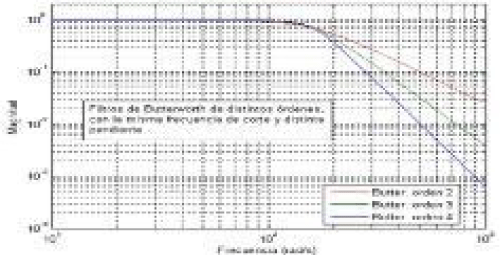
(Figure 4) shows a graph with a low-pass Butterworth filter, in different colors several filters with the same cutoff frequency but with different orders, as can be seen the higher the order of the filter, the more pronounced the fall, which is it is better because the filter responds better, but this entails a higher processing cost, which is a parameter to take into account when developing applications for teams with limited resources [9].
Equation 5 shows the formula for a Butterworth filter [10-11].
Where:
ωc: Is the cutoff frequency of the filter. ω
= jw (complex angular frequency) N: The order of the filter
The following equation represents the general form of the transfer function of a low pass filter.
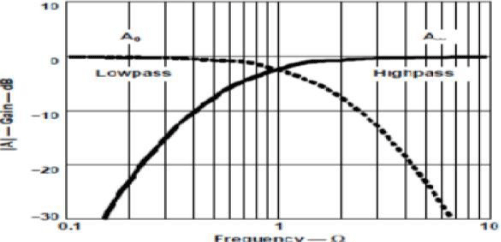
Normalized low-pass filters can be converted to normalized high-pass filters by changing the normalized variable Sn by 1 / Sn. This change in variable means in the Bode plot, above the cutoff frequency, drawing the mirror image of the amplitude-frequency response of the low-pass filter, as shown in the following (Figure 5). The gain A0 at low frequencies is converts into high frequencies. [eleven]
Development (Technical Work Repair)
Analogous processing theory was followed for the implementation of filters. These are cascaded to increase order. We begin with obtaining the ECG signal via silver chloride electrodes. Then these electrical signals are transmitted to the input of the instrument amplifier. Before the implementation of the board, a prototype in protoboar was made, to carry out the tests, to be able to calibrate the resistance values, and thus be able to obtain the desired signal without noise.
The stages that were carried out are the following:
Mechanical design
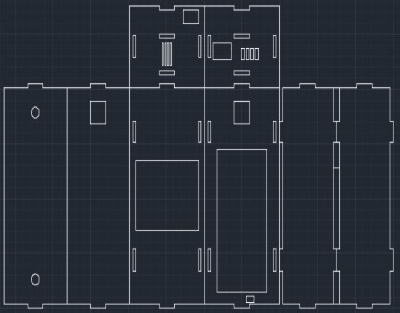
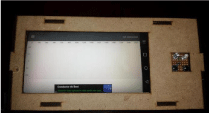
The design of the work will be a 20 × 10 × 15 cm3 model, based on easily accessible materials such as the 0.2 mm MDF that was used, which will become the hardware, case or box; which will contain the cell phone or tablet, the plate and the power and control elements. The design was made in such a way that the pieces can easily fit between them by means of cuts in the form of grooves as we see in (Figure 6). In order for the project system to display the signal, we will use electronic components programmed by the Arduino Nano microcontroller.
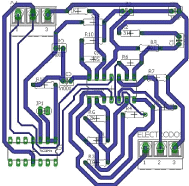
Electrical design and control
Likewise, the electrical circuit for the elaboration of the control board will be designed for a better presentation of the design, which will have the following stages shown in the following (Figure 7).
Scheduling
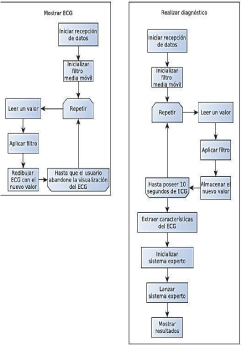
Next, in figure 8 and figure 9, the flow diagram corresponding to the start of the process and a fragment of the programming used by the Arduino software are presented respectively, to control the time with respect to the duration of the heartbeats. Heart so that these coincide and can be seen on the cell phone or tablet in our case through a graphic application and we can listen through a small buzzer / speaker at the moment of each heartbeat.
Testing
To verify that the project implementation works, you need to perform tests.
1. Check if the programming allows all the system complies with the required action. That is, tests will be carried out with each of the filters, one by one and together, in such a way that we make sure that the function is indicated.
2. Verify that the design and structure of our system are stable and withstand the physical conditions to which they are subjected.
3. To check if the ECG medical signal was successfully, a series of tests were carried out where the output signal of each filter was verified this in order to obtain a signal without noise.
Results
In this section we are going to show the general results of the system, as can be seen in (Figure 10), the cardiac period that is carried out by means of the derivation of signal 1 is shown to obtain its maximum peak, What happens when the R wave rises, this time where this maximum peak occurs is stored until the next peak occurs, the value stored between peak and peak of the R wave indicates the period of the cardiac signal. The design calculation for the implementation of the arming can be seen in (Figure 11), where it is ready to receive the signal and display it.
Conclusions
It can be concluded that what caused the wave not to be plotted was that in the inventor app application it did not take advantage of the equipment's processing capacity correctly, and the bluetooth grapichs could not show numbers, it was decided to do it in the inventor 2 app. Android. Also perform a processing for the elimination of noise through filtering, for which fourth order Butterworth IRR type digital filters were used. It can be concluded that the development of an application in the inventor 2 app is capable of displaying the variables correctly with a delay in the Arduino software of 5 seconds, allowing to show a greater sampling and a very good view of the sample, the test Initially, it was done by connecting the Arduino to the mobile or the PC (Table 2). The tests conclude that the RAM capacity of the PC or mobile influences the performance when displaying the variables, a PC with 4 GB of RAM only processed half of the data of a 16 GB before starting to have a delay.
Observations
This project was carried out as a research and based on a prototype, for a possible industrial mass production. The exact dimensions of all the components to be used were taken into account, as well as those of the cell phone that would be inside the case or box, and the height of the plate once all the components that it would carry had been soldered. In addition to the fact that the box itself has ventilation slots due to the use of the voltage boosters. Finally, the use of more grooves at the ends of the pieces was lacking so that the coupling is more precise and it is not required to use some type of glue in the project itself.
Recommendations
Since in the present work the ECG signals were studied and noise was reduced with a specific filter, it is recommended to use different types of filtering to the one already implemented to be able to visualize with which high-pass or low-pass filter we can reduce the noise of the ECG signal. at a lower or higher peak of the signal with the maximum frequencies.
Biographs
Juan José Encinas C. He was born in Lima, Peru. He is a Mechatronic Engineer. Session Chair and participant of the 4th North American Industrial Engineering and Operations Management Conference-IEOM 2019 in Toronto, Canada. He received a certificate for attendance and presentation at the 2nd International Conference on Automation Engineering and Intelligent Manufacturing-ICIMA 2018 in Penang, Malaysia. He participated in the X International Symposium on Innovation and Technology-ISIT 2019 in Cusco, Peru. Member of the steering and technical committee of the ISIT. He participated as part of the Peru Section of the IEEE in the XXVI International Congress of Electronics, Electricity, Engineering and Computing- INTERCON 2019 in Lima, Peru. He with experience in research, development and innovation in the fields of mechatronics, medical robotics, telemedicine, aerospace engineering and bioengineering. Researcher in programming by IPCEM agents. Lecturer and Consultant in Mechatronic, Spatial and Biomedical Technologies. He is also a consultant in information and communication technologies in the Peruvian government sector.
References
- Robledo Juan, Jiménez Manuel, Robledo Luis, Electrocardiogram, cardiology service of the Virgen de la victoria hospital, Málaga.
- Electrocardiogram.
- Adrián Gomez, Marcela Martínez von Scheidt, Daniel Luna, et al. (2004) Intelligent system for the acquisition of biomedical signals and its link with an electronic medical record.
- Carlos A Ramírez R, Miguel A Hernández S, Processing in real time of physiological variables. National Experimental University of Táchira.
- Ochoa L Mario, Electrocardiographic presence of sinus bradycardia at rest attributable to the requirement of long- term work (background) compared to short-duration and high-intensity exercises. Pontificia Universidad Católica del Ecuador.
- Dubin Interpretation from ECG.
- Richmond University (2016). In: Medical Assisting Technology.
- Design and construction of a low cost electrocardiograph.
- Oppemheim AV, Schafer RW, Butterworth Low Pass Filter Demonstration Plot.
- Correa Parodi, Gino G, Design of a graphical interface for loading and pre-processing of ECG signals from the Physionet base.
- Low cost portable electrocardiograph.
Corresponding Author
Juan José Encinas, Professional School of Mechatronics Engineering, Faculty of Engineering, Ricardo Palma University, Lima 1801, Peru.
Copyright
© 2022 José EJC. This is an open-access article distributed under the terms of the Creative Commons Attribution License, which permits unrestricted use, distribution, and reproduction in any medium, provided the original author and source are credited.