Role of Chemical Steps in the Electrochemical Reduction of Metal Complexes
Abstract
The role of chemical steps in electrochemical processes involving metal complexes is considered invoking the model of mass transport of chemically interacting particles. The quantitative description is based on the second Fick's law equations supplemented with the respective kinetic terms. Simple differential equations containing no kinetic terms are obtained for total concentrations of metal, ligand, proton donors and acceptors. Their surface concentrations can be determined ignoring the kinetics of chemical steps and using experimental voltammetric data transformed according to the analytical expressions obtained. In the case of labile systems, linear Tafel plots normalized with respect to the surface concentration of the electrochemically active complex can be constructed. The application of the suggested algorithm is illustrated by the analysis of experimental data obtained for Cu(II) reduction in glycolic acid solutions and hydrogen evaluation in the acetate system.
Keywords
Metal complexes, Electroreduction, Chemical steps, Lability
Introduction
Metal complexes still attract extensive attention, since they are widely distributed in both nature and in practical applications. The electrochemical processes used in such important areas as electroanalysis, electroplating, etc., are of particular note. When solving various problems of theoretical and applied research, one is faced with the specifics of these systems, namely, with the variety of chemical interactions (often rather numerous), attending the electrochemical charge transfer step. The simplest example of the process proceeding through the so-called CE mechanism (chemical step + electrochemical step) could be the reaction X → O + n e → R, wherein the electrochemically active substance O is formed from the electrochemically inert substance X during the preceding chemical reaction. By far the most rigorous quantitative characteristics of this mechanism were obtained when the single preceding chemical step is of the first (or pseudo-first) order. When increasing this parameter or the number of chemical steps, analytical relations are no longer available.
Nevertheless, most real electrochemical systems are significantly richer in various interactions [1]. Consideration of these phenomena in general, is a rather complex task that requires involvement of non-linear differential equations and the use of the kinetic characteristics which are not always available. In this connection, there is a need for the acceptable simplifications of the problem and finding the most favorable ways to analyze the experimental data.
In this paper, we analyze the ways of taking into account the kinetics of chemical interactions, the applicability of which would not be limited in the number of system components and chemical steps. To solve the certain problems, such feature as the system lability is involved. Application of the results of theoretical analysis is illustrated by the data obtained in the experimental study of some systems.
Theoretical Notes
Analysis of experimental voltammetric data usually assumes the use of kinetic equations that contain not only the kinetic parameters of the charge transfer step, but also the surface concentrations of species taking part in the electrochemical reaction. To determine these quantities, it is necessary to apply an adequate model in which the regularities of mass transfer of chemically interacting particles would be taken into account. As we will see from the following, it becomes necessary to discuss in more detail some concepts that are involved in this theoretical model.
Mass-Transport of chemically interacting species
Let us suppose that the reduction of the Electrochemically Active Complex (EAC)
proceeds in the system under linear diffusion conditions. Concentrations of the components, as time, t, and coordinate, x, functions, can be determined by solving differential equations, representing the second Fick's law and supplemented with terms that take into account the kinetics of chemical interactions. Detailed formulation of this problem is given below in the Appendix.
We focus on the interesting, in our view, conclusion that follows from the analysis. It is noteworthy that a very simple differential equation
containing no kinetic terms, is valid for the total concentration, of metal, cM, ligand, cL, or proton donors and acceptors, cH. Its usage is very tempting, since solutions of such equations supplemented with corresponding initial and boundary conditions have been well-expounded in literature. The initial condition (at t = 0) is commonly treated as an equilibrium state with constant (bulk) concentrations of species over the whole area of the system. The same is valid for the respective boundary conditions at x ≥ ẟ (outside the ẟ-thick diffusion layer). Another boundary condition follows from the first Fick's law and correlates the flux of the EAC with the current density. When Eq. (2) deals with the total metal concentration (c = cM), there is no necessity to preset which species is electrochemically active. In any case, the current density
where n is a number of electrons involved in the reaction (1) and F is a Faraday constant.
Since the ligand is supposed to be electrochemically inert,
The problem formulated in such a way has the known analytical solution:
where the variable t in the time-dependent current density i(t) is replaced by the auxiliary variable (t - u). The function
takes into account the existence of ẟ-thick diffusion layer. We want to point out the importance of the equation (5): since it contains no kinetic characteristics of chemical steps, this relationship is suitable for determining the total surface concentration both in labile and inert systems. However, no information concerning individual components of the system follows from above equations. Therefore, it is necessary to formulate extra interrelations between their concentrations.
Lability of electrochemical systems
When chemical steps are sufficiently fast, concen¬trations might be treated as close to equilibrium ones. Then these quantities might be defined by the respective equilibrium constants. To determine whether such an approach is justified, it is necessary to consider the system lability. Formulation of lability criteria is based on comparing limiting fluxes controlled by finite rates of dissociation of complex species to their limiting diffusional fluxes [2]. As a result, this criterion depends on many parameters including diffusion coefficients, the rate constants of chemical steps, the thickness of diffusion and reaction layers, the size of micro-electrodes, etc. [2-11]. Again, strict analytical expressions have been derived mainly for the first-order chemical step. This obstacle can be circumvented to a certain extent by using Eq. (5).
From the standpoint of lability, we can distinguish two limiting cases concerning the limiting currents (id) that occur in the region where the surface concentration of the EAC approaches zero. If the system is highly labile, the loss in the surface concentration of the EAC, caused by the process (1), is easily compensated by fast EAC formation during the corresponding chemical stages. Then, the concentrations of all particles containing metal ions tend to zero in the id region, that is, cM,s (t) → 0. In this case, the maximum value of ΔcM, determined by equation (5), can reach the total metal concentration in the bulk of solution:
Hence, the fulfillment of condition (7) is an indispensable sign indicating a labile character of the system. In this case, the relations between surface concentrations might be determined on the basis of step-wise, Kj, or cumulative, βj, stability constants of complexes defined as
where kj and k-j are the respective rate constants (see Appendix).
A completely different situation arises when the system is highly inert. In this case, extremely slow chemical stages are not able to restore the loss of the EAC at the electrode surface. As a result, only the EAC surface concentration varies and drops to zero in the region of the limiting current. Then, the condition (7) changes to
Though chemical reactions are supposed to be very slow, their kinetics should be taken into account in the certain cases, e.g., when the equilibration time of the electrochemical system is estimated. However, in this limiting case of lability, the charge transfer step can be analyzed taking no account for preceding chemical steps.
Concept of the diffusion layer thickness
To obtain the surface cM from experimental i(t) data transformed according to the Eq. (8), it is necessary to estimate the values of two parameters: the average diffusion coefficient and the thickness of the Nernst-type diffusion layer. According to this model, diffusion takes place in a layer of stagnant solution close to the electrode solution interface. It has been established by means of different methods that similar structures actually form under the natural convection conditions. Their thickness makes up 0.02-0.05 cm; however, it is rather difficult to define strictly the value of ẟbecause it depends on various factors.
This quantity can be eliminated under the steady-state conditions, when ∂c/∂t = 0. Then the equation
can be used that follows from the well-known relation between the limiting current density, id, and ẟ
In the case of labile systems, the quantity c in Eq. (11) assumes the value of the total concentration cM. Differently, c = cEAC, when the system is highly inert.
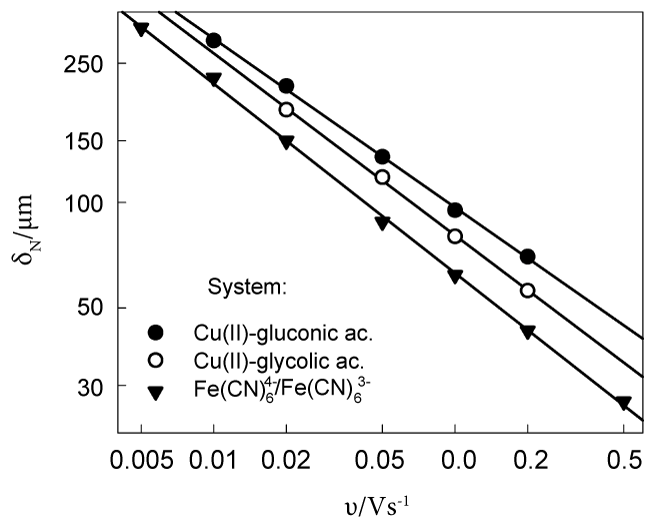
Certain complications arise in the case of time-dependent (non-steady-state) electrolysis. In particular, it was established that the δ varies with the potential sweep rate v in the Linear Potential Sweep (LPS) voltammetry. The empiric regularity of = const was previously determined for the system [12] and was found to be also valid for Cu(II) solutions containing glycolic and gluconic acids [13,14]. The attempts have been made to substantiate this regularity theoretically [15-18]. Though the models used support a linear dependence between δ and , nevertheless the δ values following from these theoretical models are one order of magnitude lower than experimental quantities. More realistic data follow from another approach [19] based on Levich's view of microscopic chaotic motion that takes place in the viscous sub-layer adjacent to any wall or electrode surface. The δ = 230 μm was found from analysis of chronoamperometric transients obtained for one-electron reversible oxidation of; this result is in line with the respective data given in Figure 1. Slopes of lines, which approximate δ- v dependences in logarithmic coordinates, range from 0.48 to 0.54.
Concept of the effective diffusion coefficient
It was accepted in differential equations given in the Appendix that diffusion coefficients of all the particles are equal. If the size of complexes or ligands is similar, such an assumption is justified. However, it is known that H+ and OH- ions distinguish themselves from other by their greater mobility, which is determined by the so-called structural diffusion (Grotthuss mechanism) involving a shift of structural units as a result of rearrangement of the protons without a considerable shift of water molecules themselves.
Theories of various electrochemical analysis methods (polarography, chronopoten¬tiometry, RDE, etc.) state that the thickness of the diffusion layer depends on D. Hence, if diffusion coefficients of certain particles differ, thickness of their diffusion layers must be different. When applying such images to the systems of metal complexes, contradictions arise, which are especially obvious in the case of labile complexes. Then, individual ẟj with its own Dj should exist for each particle. Let us imagine that the certain species has an increased mobility. Then, with diffusion mass transport going on, their excess will appear in a certain region of the solution, causing the respective shifts of chemical equilibria. As a result, some part of more mobile particles will have to react with other components of the solution. Formally the same result can be obtained by assigning a lesser Dj to these particles. If we investigate the particles of the reduced mobility, on the contrary, their Dj should be increased. Thus, the mechanism, which allows one and the same effective D to be assigned to all the particles, appears in the labile systems. This mechanism was studied in more detail in [20]; similar conclusions were also drawn in investigating combined H+ and diffusion [21,22].
The effective D depends on the individual diffusion coefficients of complex species and their molar fractions in the solution [6,8,23]. To estimate its value, the following relation is usually used:
where xj is a molar fraction of the certain complex species. The index m depends on the experimental conditions; it is equal to 1 (steady-state electrolysis), ½ (polarography), ⅔ (RDE voltammetry), etc. Other comparable expressions are also available. For instance, when complexes prevail in the system, the equation
is obtained [23]. Note that the analysis of D dependence on [L] was used to determine βN.
The above concept seems to be acceptable in the case of labile systems. The most convenient is to obtain this effective D from the experimental data (limiting currents, transition times, etc.), which are determined by the diffusion characteristics. However, the use of this approach in the case of inert systems remains questionable.
Determination of kinetic parameters
Thermodynamics allows us to treat any metal-containing species as a possible EAC. However, there is a lot of experimental data (see, e.g. [1]) testifying that the EAC is liable to contain less ligand particles than the more stable complex predominating in the solution. The removal of ligands from its inner coordination sphere promotes adsorption and a decline in the potential barrier of electron transfer. Thus, kinetic factors, and the activation energy first of all, should be responsible for the electrochemical activity of complexes. Special methods have been suggested and successfully applied for establishing the EAC composition [1,24].
Often a single EAC is found in a certain potential region. Then the kinetic equation of the process (1) takes the form
where i0 is an exchange current density, αa and αc are anodic and cathodic charge transfer coefficients respectively (αa + αc = 1). At sufficiently high cathodic overvoltages (γc ≡ -γ), i.e. when γc >> RT / nF,
Kinetic parameters are usually obtained from experimental data, transformed according to the Tafel-type equation. However, it is necessary to point out that the dependence of ln |i| vs. ηc, given by Eq. (16), is not linear, as is usually the case, since the EAC surface concentration is not constant and depends on i or η. This relation can be linearized through the replacement of the quantity i with the normalized current density, viz.
Again, we have 2 cases when the EAC surface concentration (the value of ) is obtained relatively easy. For labile systems, we use the cM,s quantity established with Eq. (5), and material balance equations together with expressions (9) for respective stability constants. Remember that cL,s = cL,b, when the ligand is electrochemically inactive. If the system is highly inert, the cEAC,s is obtained immediately with Eq. (5), considering that this relationship reflects only changes in EAC surface concentration. Further analysis of Normalized Tafel Plots (NTP) is usual.
Experimental examples
Electrochemical experiments were carried out using the usual electrochemical equipment: a potentio-stat/galvanostat and a conventional three-electrode cell. Linear Potential Sweep (LPS) voltammograms were recorded at a po¬tential sweep rate ranging from 0.01 to 0.2 V s-1. In all cases, cathodic scans were applied, starting with the open-circuit potential.
To prepare the working electrodes, a 1 cm2 platinum disc was coated with 5-7 μm thick copper in the solution containing (g dm-3): CuSO4․5 H2O - 250, H2SO4 - 50. A polycrystalline layer with well-exhibited crystallographic edges and faces was formed. Detailed characteristics of surface morphology are given [25]. The electrode potential was measured in reference to the Ag | AgCl | KCl (sat) electrode and was converted to the standard hydrogen scale. Solutions were prepared using deionized water, pure copper sulfate or sodium acetate. K2SO4 or NaClO4 were used as supporting electrolytes. Solutions were deaerated before experiments with an argon stream for over 0.5 h. All experiments were performed at 20 ℃.
System Cu|Cu(II), glycolic acid
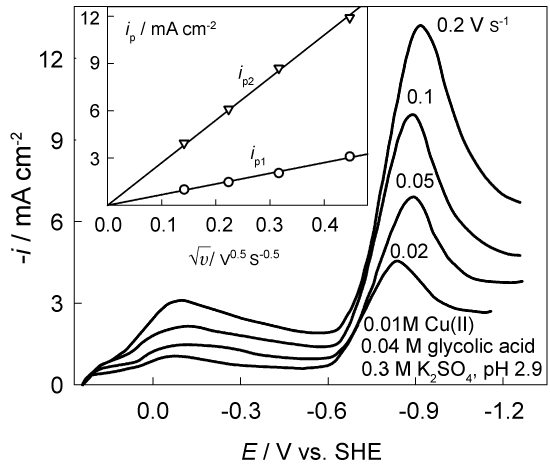
Two relatively stable complexes CuL+ and CuL2 (L- is an anion of glycolic acid) are formed in the Cu(II)-glycolic acid system [26]. Cathodic LPS voltammograms (Figure 2) contain two well-defined current peaks. The first of them, ip1, observed at relatively low cathodic polarization results from Cu(II) reduction; the second peak, ip2, observed at ca -0.9 V emerges from hydrogen evolution. Linear variations of both peaks with (v is a potential sweep rate) and a clear dependence of peak potentials on v shows that both processes are controlled by the charge transfer and diffusive mass transport simultaneously [1].
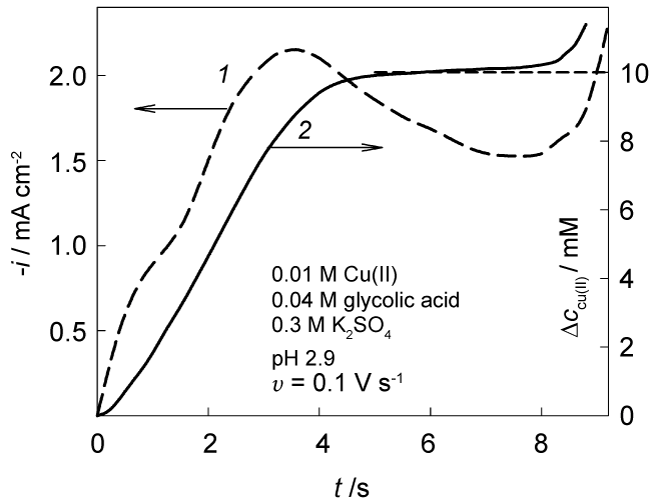
An example of the data obtained with the effective diffusion coefficient D = 5 × 10⁻⁶ cm2 s-1 and Eq. (5) is shown in Figure 3. The change in surface concentration reaches a limit of 0.01 M that is equal to Cu(II) bulk concentration. This result provides a support for the assumption on a sufficient lability of Cu(II)-glycolate complexes.
Experiments carried out at different pH showed [26], that the rate-determining step might be the transfer of the first electron on the Cu(II) aqua-complex. Then the kinetics of Cu(II) reduction is given by the equation [1]
and the expression for NTP becomes as follows:
where
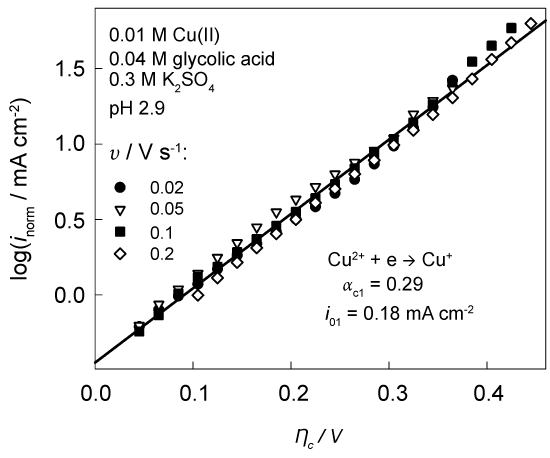
Experimental data, obtained at different v and transformed into NTP, fall on one general line (Figure 4). The values of kinetic parameters match the similar data reported in [27] for 0.1 M Cu(ClO4)2 solutions.
Acetic acid system-an extension of the theoretical model
The approach considered in the present paper is also applicable to the hydrogen evolution that often attends the electrodeposition of metals. When the plating solutions contain such ligands as hydroxy acids, these substances can generate hydrated protons (H3O+ ions) establishing the conditions for the CE mechanism discussed above. Then, hydronium ions are formed additionally in chemical reactions, which precede the electron transfer step.
Considerable amount of data, accumulated in this area, created the preconditions to use the simplest solutions of weak acids for experimental verification of certain regularities following from theoretical models. For this purpose, we chose acetic acid solutions due to the relative simplicity of homogeneous processes in them and availability of sufficiently reliable kinetic data.
Investigations of hydrogen evolution in acetate solutions were carried out at 3 < pH < 5 by the LPS voltammetry using copper and platinum electrodes [28,29]. It was found that voltammograms display current peaks, which take a shape characteristic of other electrochemical processes including the reduction of metal complexes. It was also established that LPS current peaks vary linearly with and with the total concentration of proton donors and acceptors that is in line with the theoretical predictions given above.
For interpretation of the experimental data, we appealed to the model of CE mechanism involving two consecutive steps: the preceding chemical reaction HA&⇄ H+ + A- and the charge transfer H+ + e → ½ H2. Procedures, described above, were successfully used in the analysis of experimental data, provided that the behavior of hydronium ions is similar to that of Mn+ and acetate-anions play role of ligand.
Surface concentrations of individual species (acetic acid molecules HA, hydronium ions H+ and acetate anions A-) were obtained using material balance equations and the expression of the equilibrium constant:
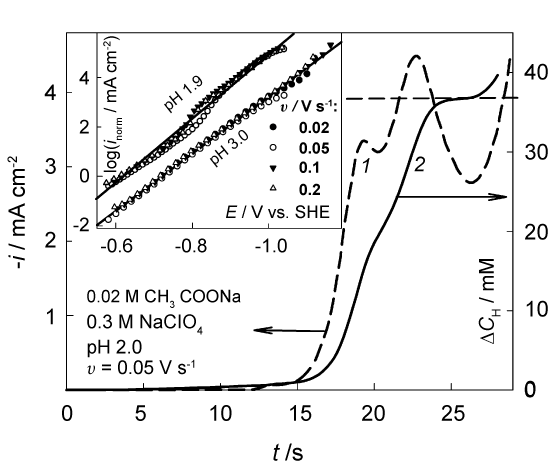
To obtain the bulk concentration of hydronium ions from pH, the activity coefficient γH+ = 0.7 was used. These simulations and other computations that follow were performed with Ka = 2.7 * 10-5, k1 = 3.46 * 106 s-1 and k2 = 1.28 * 1011 dm3mol-1s-1 [30]. As a result, the linear normalized Tafel plots were obtained. An example of such NTP is shown below in the inset of Figure 5 (the data for pH 3). It can be assumed that the data obtained at different v fall on one general line.
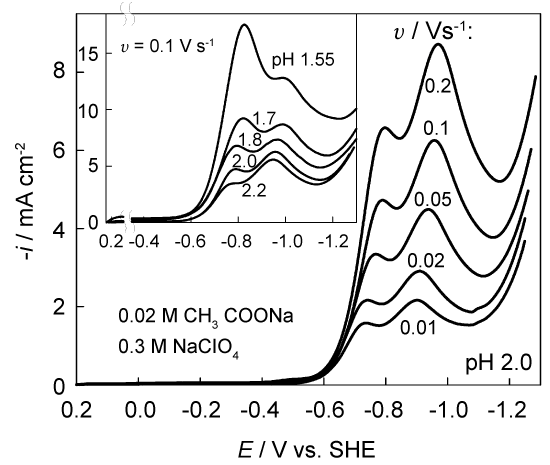
Further investigations have shown that unusual double current peaks are observed at 1.5 < pH < 2.5 (Figure 6). An extra current maximum emerges at -0.8 V and becomes detectable already at pH 2.5. The shape of these maxima is distorted. In appearance they resemble the superposition of two peaks, located quite close to each other.
It was of interest to find out to what extent the approach used is applicable in this more complicated case. We performed the necessary procedures to verify whether the system is labile enough. An example of the experimental voltammogram and its transform by Eq. (5) is shown in Figure 5. The function △cH(t) increases with time approaching a characteristic plateau, which is the limit of △c(t) and should not exceed the volume concentration cH,b = 34.3 mM. Indeed, the plateau of △cH(t) function is located at this value (curve 2 in Figure 5) when the effective D = 1.1 * 10-5 cm2 s-1. This quantity is very close to D = 1.2 * 10-5 cm2s-1 given in [31] for 25 ℃. Further rise in this curve, as well as in the experimental voltammogram (curve 1), is associated with the beginning of a new process, viz. the discharge of water molecules.
An example of normalized Tafel plots obtained at pH 1.9 is shown in the inset of Figure 5. Again, the data, obtained at different v, are close enough. Although the transformed data slightly meander with E, we found it possible to apply a single fitting line that turned out to be almost parallel to the NTP obtained at pH 3.0. Kinetic parameters following from NTP analysis are also close: αc = 0.72 ± 0.04 and the effective i0 ∼ 0.2±0.4 nA cm-2.
Though the literature on hydrogen evolution is very rich, kinetic data relating to the copper electrode are rather slender. The value of αc = 0.7 was detected for perchloric acid solutions over a wide region of temperatures (158-300 K) [32]. For less acidic acetate solutions, we determined that αc = 0.64, and the exchange current density of the order of 1 nA [29]. Similar αc values were also obtained [1] for glycolic, malic, tartaric and gluconic acid solutions containing 0.3-0.5 M Na2SO4 as a supporting electrolyte. Formation of significant amount of ions, which are additional proton donors, could be one of the reasons which led to the higher exchange current densities reaching ∼10 μA cm-2. Analysis of the RDE voltammetric data, obtained for 0.03 M H3BO3 solution (pH 5.7) and performed on the basis of Koutecky-Levich equation [33], produced i0 = 3.46 * 10-7 A cm -2 and αc = 0.5 (the latter value follows from the cathodic Tafel constant equal to 120 mV per decade).
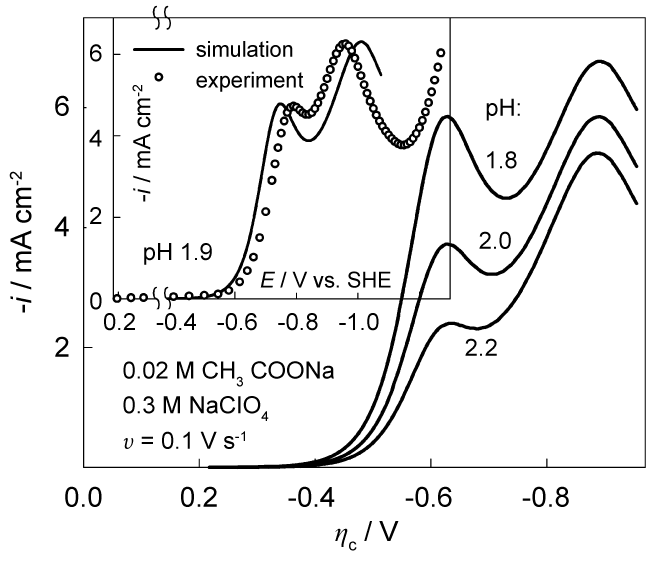
To compare quantitatively experimental and theoretical voltammograms, we performed simulations using the entire set of differential equations. Since the rate constants k1 and k2 were employed, no assumptions on system lability were necessary. An example of results, obtained with standard rate constant ks = 2 * 10-9 cm s-1 and αc = 0.62 is shown in Figure 7 (values of D, Ka, k1 and k2 are given above). A high cathodic overvoltage of irreversible process arises from low ks values. Peak heights and their ratio are also different.
Fitting procedures made it possible to obtain a reasonable agreement between simulated and experimental data, an example of which is shown in the inset of Figure 7. Here, ks = 4 * 10-12 cm s-1 and αc = 0.75. These parameters are in line with kinetic parameters obtained from NTP analysis. It was also found that the results of simulation are highly dependent on the pH: a change of pH by 0.1 leads to changes in the simulated voltammograms exceeding the reproducibility of experimental data. The best agreement between the data in the inset is obtained when the simulation for pH 1.97 is performed. It should be mentioned that quite a large amount of initial data (D, Ka, k1, k2, i0 or ks and αc) was used. Each of them has been identified with a certain error. Besides, experimental errors associated with measurements of current-voltage characteristics and pH should be taken into account. All this bearing in mind it seems possible to conclude that the CE model quite adequately renders the electrochemical behavior of the acetate system at low pH.
Concluding Remarks
To take into account the role of chemical stages in electrochemical processes involving metal complexes, a mass transfer model of chemically interacting particles is needed. This problem is solved using a system of differential equations reflecting Fick's second law and supplemented with terms that take into account the kinetics of the chemical stages. Simple differential equations containing no kinetic terms are obtained for total concentration of metal, ligand, as well as proton donors and acceptors. Their surface concentrations can be determined from experimental voltammetric data transformed according to the analytical expressions obtained. In so doing, the kinetics of chemical steps may be ignored.
To determine the surface concentration of EAC and the products of its transformation, it is necessary to formulate additional relationships between these quantities. In the case of labile systems, the material balance equations are used in conjunction with the expressions for the constants of the corresponding equilibria. The data obtained make it possible to construct the Tafel dependences, normalized by the EAC surface concentration.
The results obtained in the analysis of experimental data obtained for a number of real systems indicate the adequacy of the suggested model.
References
- Arvydas Survila (2015) Electrochemistry of metal complexes. Applications from electroplating to oxide layer formation. Wiley-VCH, Weinheim.
- Van Leeuwen HP, Cleven R, Buffle J (1989) Voltammetric techniques for complexation measurements in natural aquatic media: role of the size of macromolecular ligands and dissociation kinetics of complexes. Pure Appl Chem 61: 255-274.
- Dawison W (1978) Defining the electroanalitically measured species in a natural water sample. J Electroanal Chem 87: 395-404.
- De Jong HG, Van Leeuwen HP, Holub K (1987) Voltammetry of metal complex systems with different diffusion coefficients of the species involved: Part I. Analytical approaches to the limiting current for the general case including association/dissociation kinetics. J Electroanal Chem 234: 1-16.
- De Jong HG, Van Leeuwen HP (1987) Voltammetry of metal complex systems with different diffusion coefficients of the species involved: Part II. Behaviour of the limiting current and its dependence on association/dissociation kinetics and lability. J Electroanal Chem 234: 17-29.
- Carofiglio T, Magno F, Lavagnini I (1994) Microelectrode voltammetry for studying host-guest complexation equilibria. An analysis of the possibilities of the method. J Electroanal Chem 373: 11-17.
- Danielle S, Bragato C, Baldo MA (1997) Steady-state voltammetry for the reduction of labile metal complexes in the absence and presence of different concentrations of supporting electrolyte. Electroanal Chem 439: 153-161.
- Van Leeuwen HP, Pinheiro JP (1999) Lability criteria for metal complexes in micro-electrode voltammetry. J Electroanal Chem 471: 55-61.
- Van Leeuwen HP (2001) Revisited: The conception of lability of metal complexes. Electroanalysis 13: 826-830.
- Galceran J, Puy J, Salvador J, et al. (2001) Voltammetric lability of metal complexes at spherical microelectrodes with various radii. J Electroanal Chem 505: 85-94.
- Pinheiro J, Van Leeuwen HP (2004) Scanned stripping chronopotentiometry of metal complexes: lability diagnosis and stability computation. J Electroanal Chem 570: 69-75.
- Survila A, Stasiukaitis PV, Kanapeckaitė S (1998) Concept of Nernst-type diffusion layer in linear potential sweep voltammetry. Chemija 9: 138-142.
- Survila A, Mockus Z, Kanapeckaitė S, et al. (2012) Kinetics of Sn(II) reduction in acid sulphate solutions containing gluconic acid. J Electroanal Chem 667: 59-65.
- Survila A, Kanapeckaitė S (2012) Kinetics of cathodic processes in Cu(II) gluconate solutions containing an excess of sulphate. Electrochim Acta 78: 359-364.
- González Velasco J (1994) The linear sweep voltametric method: An application to the study of reversible and irreversible processes. Electroanalysis 6: 711-724.
- Arun Prasad M, Sangaranarayanan MV (2004) Analysis of the diffusion layer thickness, equivalent circuit and conductance behaviour for reversible electron transfer processes in linear sweep voltammetry. Electrochim Acta 49: 445-453.
- Arun Prasad M, Sangaranarayanan MV (2004) Formulation of a simple analytical expression for irreversible electron transfer processes in linear sweep voltammetry and its experimental verification. Electrochim Acta 49: 2569-2579.
- González Velasco J (2006) On the dependence of the Nernst diffusion layer thickness on potential and sweep rate for reversible and of the thickness of the charge transfer layer for irreversible processes studied by application of the linear potential sweep method. Electrochim Acta 51: 2971-2976.
- Amatore C, Szunerits S, Thouin L, et al. (2001) The real meaning of Nernst's steady diffusion layer concept under non-forced hydrodynamic conditions. A simple model based on Levich's seminal view of convection. J Electroanal Chem 500: 62-70.
- Kačena V, Matoušek L (1953) Proteins and aminoacids. XVIII. The effect of electrolytes on proteins. Coll Czech Chem Comm 18: 294-301.
- Hilbert F (1969) Die elektrolytische Abscheidung von Eisen und Wasserstoff. Habilitations¬schrift. Universität Graz.
- Miyoshi Y, Lorenz WJ (1970) For proton transport in sulfuric acid solutions. Berichte Phys Chem 74: 412-416.
- Koryta J (1962) Polarography of complex compounds. In: Zumann P, Progress in polarography Interscience. New York, 1: 291-302.
- Vetter KJ (1967) Electrochemical Kinetics. Academic Press, New York.
- Survila A, Kanapeckaitė S (2015) Effect of camphor on Cu(II) reduction kinetics in acid solutions. Electrochim Acta 168: 1-7.
- Būdienė J, Survilienė A, Survila A (2004) Cathodic processes in acidic Cu(II) solutions containing glycolic acid. Russ J Electrochem 40: 394-399.
- Halley JW, Smith BB, Walbran S, et al. (1999) Theory and experiment on the cuprous-cupric electron transfer rate at a copper electrode. J Chem Phys 110: 6538-6552.
- Survila A, Kanapeckaitė S (2016) LPS current peaks arising from hydrogen evolution involving proton donors. Chemija 27: 158-163.
- Survila A, Kanapeckaitė S (2016) Kinetics of hydrogen evolution on copper electrode in acetic and gluconic acid solutions. Chemija 27: 164-169.
- Yasushi Kanzaki, Koichi Tokuda, Stanley Bruckenstein (2014) Dissociation rates of weak acids using sinusoidal hydrodynamic modulated rotating disk electrode employing Koutecky-Levich equation. J Electrochem Soc 161: 770-779.
- DG Leaist, PA Lyons (1984) Diffusion in dilute aqueous acetic acid solutions at 25 ℃. J Solution Chem 13: 77-85.
- U Frese, U Stimming (1986) Hydrogen evolution on copper, silver and gold electrodes in aqueous perchloric acid from 130 to 300 K. J Electroanal Chem 198: 409-416.
- Samin Sharifi-Asla, Digby D Macdonald (2013) Investigation of the kinetics and mechanism of the hydrogen evolution on copper. J Electrochem Soc 160: 382-391.
Corresponding Author
Prof. Arvydas Survila, Institute of Chemistry, Center for Physical Sciences and Technology, Lithuania, Tel: +3705-264-9213, Fax: +3705-260-2317.
Copyright
© 2017 Survila A. This is an open-access article distributed under the terms of the Creative Commons Attribution License, which permits unrestricted use, distribution, and reproduction in any medium, provided the original author and source are credited.

