Early Detect to Protect: Excess Epicardial Fat Volume is a Risk Marker for Cardiovascular Health Assessment
Abstract
Background: Standard modifiable or traditional cardiovascular risk factors, such as diabetes, hypertension, and dyslipidemia, have been implicated in enhancing the development of atherosclerotic cardiovascular disease. Recently, excess epicardial fat volume has been reported to be a cardiovascular risk marker. The objective of this study is to demonstrate that excess EFV is associated with structural and functional cardiac abnormalities, regardless of a subject's coronary artery calcium score, and emphasize the importance of epicardial fat volume quantification.
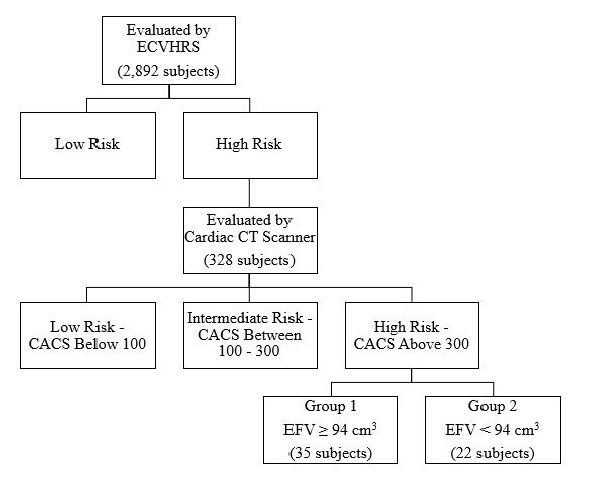
Materials and methods: We screened 2,892 subjects, 18 years and older, for cardiovascular disease risk using the Early Cardiovascular Health Risk Scoring System, which consists of 10 tests. 328 were evaluated for coronary artery calcium score and epicardial fat volume using a cardiac computed tomography scan. A total of 57 subjects were found to have a high-risk coronary artery calcium score, Agatston score ≥ 300, and were then divided into two groups. Group 1, containing 35 subjects, had a high EFV, ≥ 94 cm3, and Group 2 containing 22 subjects who had a low epicardial fat volume.
Results: The subjects in Group 1 with an excess amount of EFV, averaging 144.85 ± 28.70 cm3, were associated with statistically significant structural and functional cardiac abnormalities. In contrast, Group 2 had a normal EFV, averaging 70.77 ± 17.61 cm3 and lacked associated cardiac abnormalities, except for having an elevated coronary artery calcium score.
Conclusion: Based on our current data, and in conjunction with our past data, we reiterate the importance of epicardial fat volume as a cardiovascular disease risk marker and suggest significant influence and correlation with cardiac structural and functional abnormalities. Our goal is to emphasize the importance of evaluating EFV on every cardiac CT.
Keywords
Epicardial fat, Coronary artery calcium score, Cardiovascular disease, Risk factors, Prevention
Background
Epidemiology of cardiovascular disease processes became of great interest daring back to the 1930s [1]. The Framingham Heart Study pioneered the investigation of causes of cardiovascular disease (CVD) as death by CVD was increasing. The study identified high blood cholesterol and elevated blood pressure to be important risk factors for the development of disease. The Framingham Risk Score was later developed to quickly assess the 10-year risk of developed cardiovascular complications, such as heart attack, stroke, and death from coronary artery disease (CAD). The Framingham Risk Score is intended for use by patients aged 30-79 years with no prior history of coronary heart disease [1]. The Framingham Risk Score evaluates the age and sex of the subject, as well as their cigarette usage, status of diabetes mellitus, cholesterol levels, and blood pressure values [1]. Each of which is proven to correlate with heart health. This model was used for years to assist physicians and patients with prevention of CVD by modifying lifestyle and managing comorbid diseases.
As technology has advanced, coronary artery calcium (CAC) score (CACS) is now commonly used to assess 10-year cardiovascular disease risk and quantification of calcium deposition. CAC, a measure of subclinical coronary artery disease (CAD), may help identify asymptomatic persons at risk of CAD events [2]. The presence of high volumes of CAC, may alter the assessment of CAD risk based on traditional risk factors [3]. This process of calcification has some resemblance to bone formation. The formation of calcification in healing plaques has led to speculation that local CAC progression might correlate with the progression of noncalcified plaque to more pathologically stable calcified plaque [4]. The Agatston score remains the most extensively studied and widely accepted technique in both the clinical and research settings when quantifying CAC [5].
Standard modifiable and traditional cardiovascular risk factors (SMuRFs) such as hypertension, dyslipidemia, diabetes mellitus, and smoking, have been implicated in enhancing the development of atherosclerotic CVD (ASCVD). Recently, excess epicardial fat volume (EFV) has been reported to be associated with cardiovascular structural and functional abnormalities [6]. Epicardial adipose tissue (EAT) is the layer of adipose tissue found between the myocardium and the visceral pericardium, directly overlying the heart [7]. Similar to the adipose tissue surrounding the renal arteries, EAT is classified as perivascular adipose tissue. This type of adipose tissue differs from abdominal adipose tissues in its mRNA sequence and structure, and by the individual adipocytes being smaller in size [8,9]. It has been reported that EAT produces balanced anti-inflammatory and anti-atherosclerotic cytokines under normal physiologic conditions [10,11]. Adiponectin is one cytokine secreted by the EAT which functions by regulating the metabolism of lipids and glucose and provides anti-inflammatory effects to the endothelial cells. Adrenomedullin is another cytokine found to be secreted by the EAT, which functions as a vasodilator peptide hormone. These two cytokines provide cardiac protection by increasing free fatty acid oxidation, vasodilation, and nitric oxide synthesis [12,13]. Disrupting the balance of cytokines secreted by the EAT can lead to a decrease in nitric oxide availability, causing vasoconstriction, which plays a significant role in the development of microvascular disease.
The function of the EAT layer is not understood in its entirety, but it has been suggested to provide physiologic protection to the heart, along with other mechanical, functional, metabolic, and thermogenic functions [7,12]. Mechanically, the EAT surrounds the main branches of the coronary arteries, primarily in the atrioventricular and interventricular grooves, preventing compression and distortion during myocardial contraction [7]. EAT penetrates deeply into the interatrial groove, separating the atrial walls. EAT also penetrates into the folding that forms the left lateral ridge, the atrioventricular junction, and the transverse pericardial sinus [13]. Fat depots around the heart in the pericardial-mediastinal region were reported to possess multilocular brown adipocytes [14]. Uncoupling protein-1 is expressed at high levels in EAT as compared to other fat depots; the possibility should be considered that EAT functions like brown fat to defend the myocardium and coronary vessels against hypothermia [2].
Several methods of measuring EFV are feasible, including intrathoracic fat volume, EAT volume, and thoracic fat volume which can be measured directly by non-contrast cardiac CT [15]. Some studies have utilized echocardiography as a way for quantifying EFV, [16] but it is more accurately done using CT. Given the high spatial resolution of CT and that adipose tissue has distinct attenuation values, EFV is readily identified allowing for accurate volumetric measurement [17]. Fat attenuation and volume can also be reliably measured from pre-contrast calcium scans, with volume quantification showing a particularly strong correlation [17]. This is one of the more reliable and reproducible methods for estimating the extent of EFV with high spatial resolution [18].
It has been shown that early detection of excess EFV leads to early detection of cardiovascular structural and functional abnormalities [6]. Excessive left atrioventricular groove EAT is a significant risk marker for obstructive CAD, independent of clinical risk factors and Agatston score [19]. Excess EFV has been seen in comorbid subjects, including type 2 diabetes mellitus, obesity, and metabolic syndrome [20]. When in excess, EAT contributes to the development of CAD. Under these circumstances, the EAT secretes pro-inflammatory cytokines, thus enhancing CAD progression [21]. In obese subjects, it was found that the adipocytes produced pro-inflammatory adipokines, such as resistin and leptin. These adipokines enhance the development of CAD due to the increase in endothelial inflammation. In such subjects, lifestyle modifications, including weight loss and increased physical activity, are highly encouraged and have been proven to decrease the EFV and the severity of the associated CAD [21].
CACS is highly considered to be a novel method to evaluate cardiovascular health. However, CACS can be influenced by outside factors such as the location of calcium (intravascular vs. extra- or peri- vascular) and the presence of a stent, which can lead to abnormal calcium deposition. The use of EFV as an additional tool to evaluate cardiovascular health will be assessed by comparing the cardiovascular structural and functional effects of EFV in subjects considered to be high and low risk for CAD based on CACS. Overall, this study will show that excess EFV directly correlates with structural and functional cardiac abnormalities and other cardiovascular risk factors.
Methods
This study aims to evaluate the correlation of EFV and cardiovascular structural and functional abnormalities. The target population of this cohort study was aimed to reflect the demographics of Sarasota and Manatee County. Therefore, our study includes both males and females, subjects were not discriminated against based on ethnic background nor socioeconomic status, and subjects are primarily seniors. The demographics of Sarasota and Manatee County are dominated by non-Hispanic, white civilians. Inclusion and exclusion criteria are listed in Table 1. The study took place at the Cardiovascular Center of Sarasota, where subjects have their blood drawn, urine samples collected, undergo a stress test, retinography, and echography performed. Subjects were referred to Sarasota Memorial Hospital for the quantification portion of the study, which was performed using a cardiac computed tomography (CT) scan, Siemens Somatom Definition Dual- Source CT scanner 64 x 2. All data was dual recorded in electronic medical records and on hard paper copies. The paper copies were filed alphabetically in the research room at the center.
We screened 2,892 untreated and asymptomatic subjects, adults at least 18 years of age, for CVD risk using the Early Cardiovascular Health Risk Scoring System (ECVHRS). The ECVHRS consists of 10 tests; 7 of which are vascular, and 3 cardiac. The vascular tests are as follows: large (C1) and small (C2) artery stiffness, blood pressure (BP) at rest and post-mild exercise protocol (PME), carotid intima-media thickness (CIMT), abdominal aorta ultrasound, retinal photography, and microalbuminuria. C1 arterial stiffness was measured using pulse wave frequencies and represents the conducting arteries that store blood ejected from the heart during systole and expel blood to the peripheral tissues during diastole. C2 arterial stiffness was also measured using pulse wave frequencies and represents the resistance of muscular arteries, which regulate the velocity of the pressure wave. The mild exercise protocol consists of a 3-minute walk on a treadmill at 7% elevation and a speed of 2.5 miles per hour. The BP was measured at rest, before the exercise started, and immediately after completion of the 3-minute walk. An abnormal rise in systolic BP-PME is defined as a systolic BP rise of ≥ 30 mmHg, a systolic BP ≥ 170 mmHg, or a diastolic BP ≥ 90 mmHg. The 3 cardiac tests are as follows: pro-BNP, electrocardiogram (ECG), and left ventricle ultrasound (LVUS). The ECG and LVUS were individually interpreted and noted any abnormalities, including, but not limited to, atrial fibrillation on ECG and LV hypertrophy on LVUS.
Each of the 10 tests comprising the ECVHRS was scored as normal (score of 0), borderline (score of 1), or abnormal (score of 2), thus allowing a minimum score of 0 and a maximum score of 20. The total score was then classified as low early risk of CVD (score between 0 and 2), intermediate early risk of CVD (score between 3 and 5), and high early risk of CVD (score ≥ 6). Table 2, Table 3, and Table 4, demonstrate the scoring system for the ECVHRS. Additional factors considered and measured are waist circumference, body mass index (BMI), fasting blood sugar, lipid profile, and hs-CRP. Waist circumference was measured at the level of the iliac crest. BMI was calculated using the subjects' height and weight at the time of visit.
Out of these 2,892 subjects, 328 were evaluated for CACS and EFV using a cardiac CT scan, Siemens Somatom Definition Dual- Source CT scanner 64 x 2. Those chosen to undergo cardiac CT scan were determined to be high early risk (score ≥ 6) by ECVHRS, or borderline (5 - < 7.5%), intermediate (7.5 - < 20%), or high (≥ 20%) riskaccording to American College of Cariology/American Heart Association (ACC/AHA) absolute 10-year ASCVD risk scoring system. The CACS has been traditionally, and to this day, quantified, using the Agatston method. The Agatston method uses ultrafast CT scanning which has the advantages of both rapid image acquisition and the high contrast and spatial resolution of CT [18]. The rapid image acquisition allows for the elimination of coronary motion artifacts. The EFV was quantified using the Hounsfield method.
Out of these 328 subjects, a total of 57 were found to have a high risk CACS, with an Agatston score ≥ 300. These 57 subjects were divided into two groups, regardless of gender. Group 1, containing 35 subjects, had a high EFV, ≥ 94 cm3, and high risk CACS. Group 2 consisted of 22 subjects who had a low EFV, below 94 cm3, and a high risk CACS. Our recent data based on our target population determined the average EFV in subjects with a CACS of 0to be 69 ± 20 cm3 in females and 68 ± 15 cm3 in males [22]. In this same study, those of which had a CACS score of 0, but cardiovascular structural and functional abnormalities, as seen on the ECVHRS, averaged an EFV of 106 ± 18 cm3 in females and 114 ± 20 cm3 in males [22]. We chose to use 94 cm3 as our cut-off for low and high EFV because 94 cm3 is one standard deviation below the mean of men with cardiac structural and functional abnormalities, according to our previous study. Given that CAD is more common in men, and men were the most prominent group in our study, we chose to use the cut-off values that correlate with cardiovascular changes due to epicardial fat in men [23]. The grouping of the subjects is illustrated in Figure 1. Additionally, the subjects also completed a Cardiovascular Health Questionnaire to determine activity and exercise levels. Subjects were asked to state their level of daily activity, with 30 minutes per day, 3 to 4 times per week being classified as "active."
Statistical significance was determined using T-Test and Chi-squared analysis. A p-value of ≤ 0.05 was considered to be statistically significant. This study was approved by the Sarasota Memorial Hospital Institutional Review Board (IRB) and individual patient written consent was obtained and also approved by the IRB. Committee reference numbers: 08-CARD-16 and 10-CARD-26. The datasets analyzed during the current study are available from the corresponding author on reasonable request. All participants agreed to the consent to publish.
Results
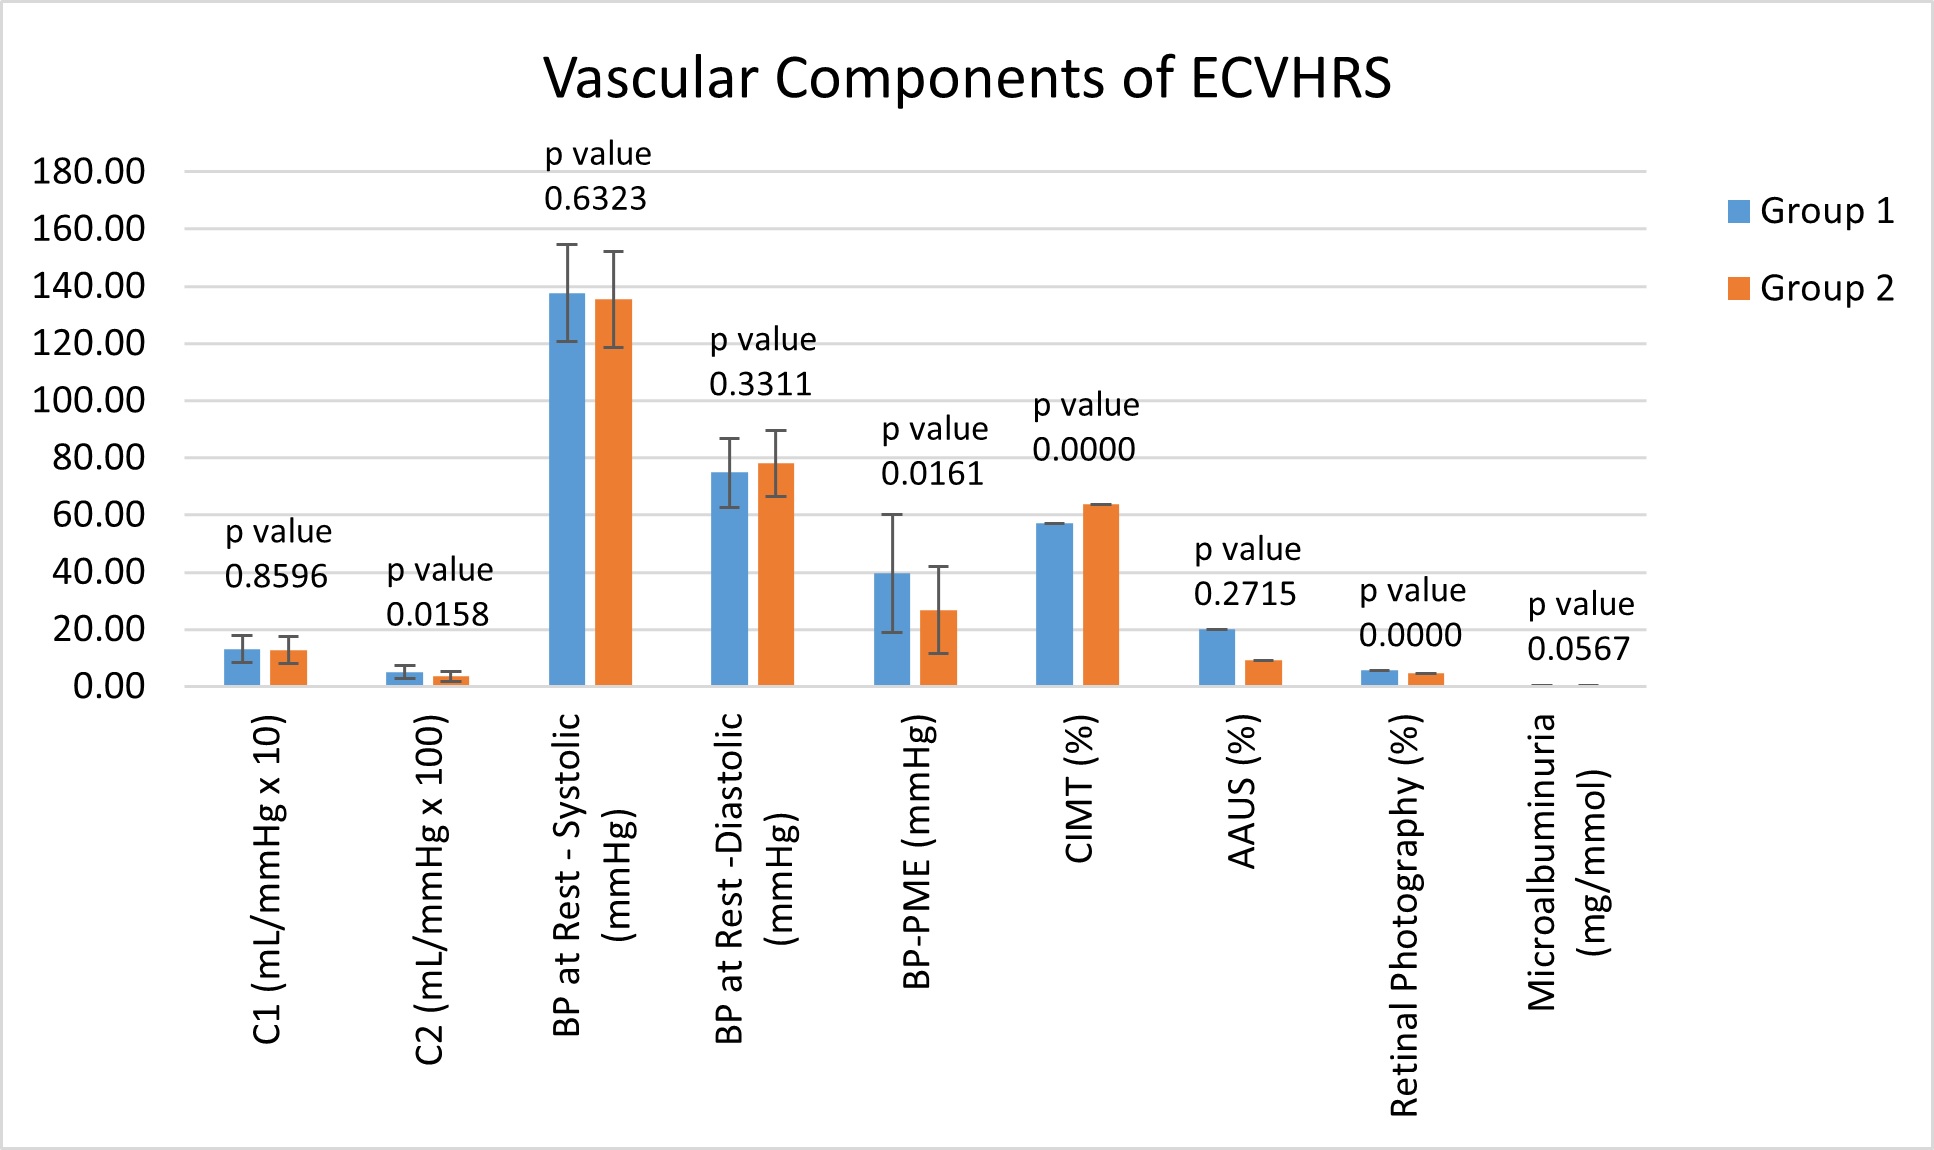
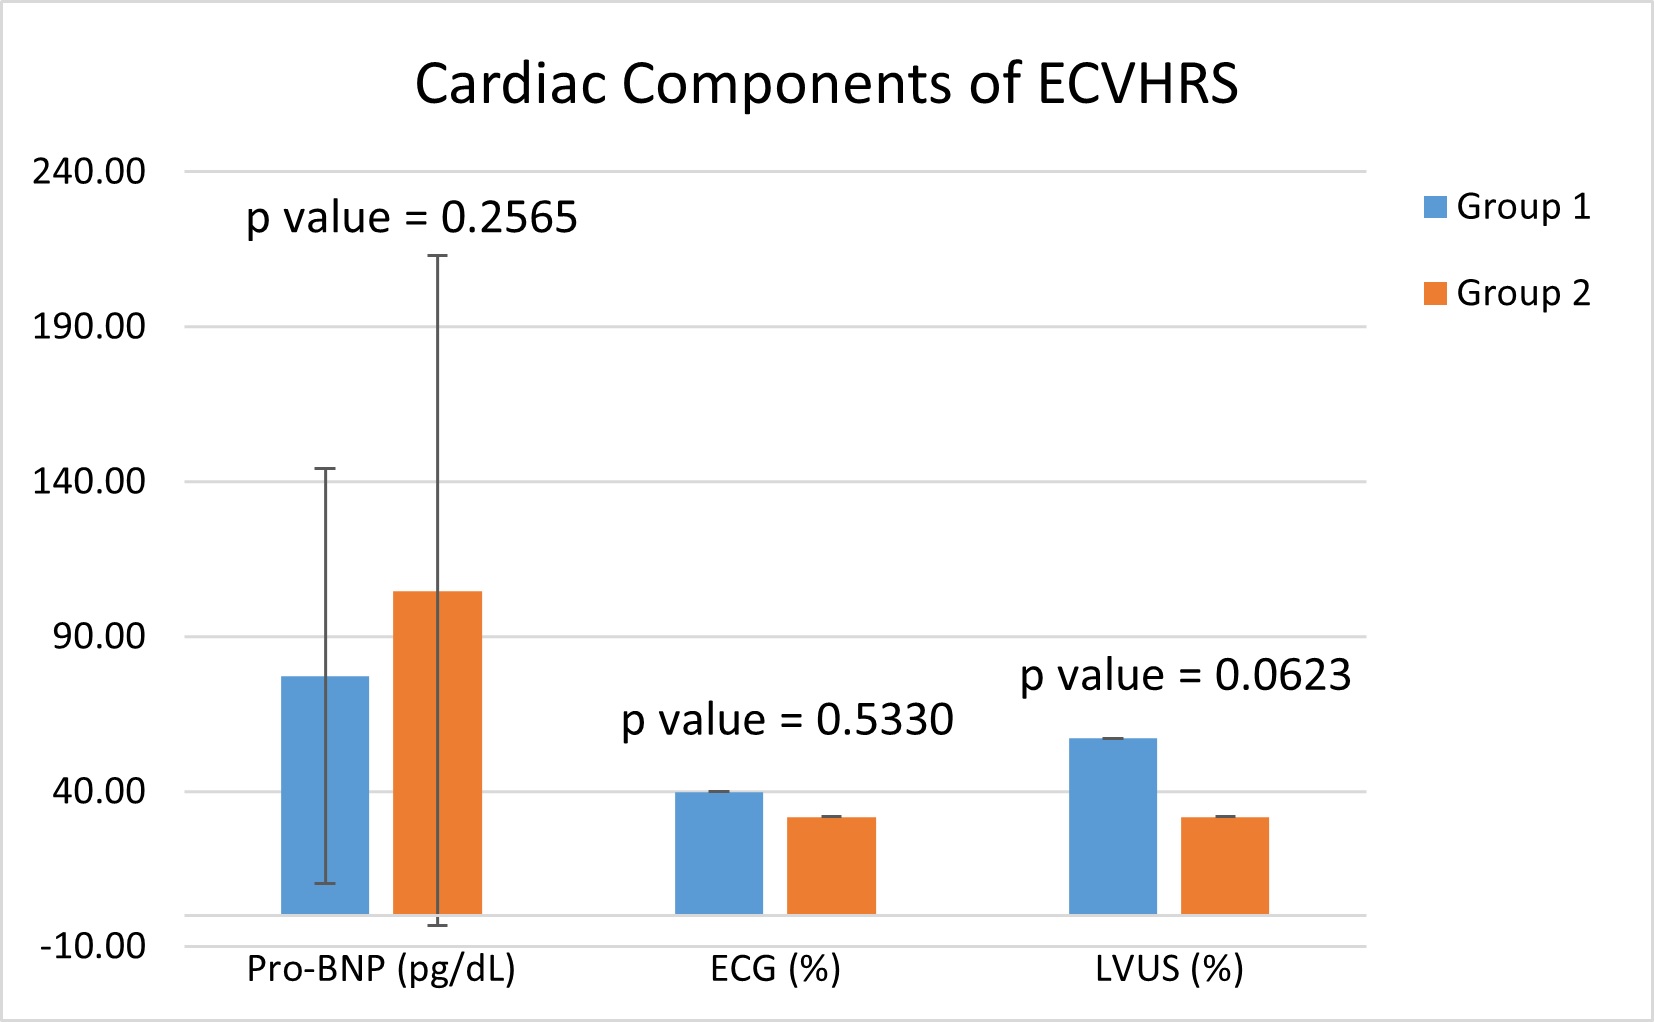
As shown in Table 5, the subjects in Group 1, with an excess amount of epicardial fat (EFV ≥ 94 cm3), were associated with statistically significant structural and functional cardiac abnormalities. Group 2 subjects with a low EFV (< 94 cm3) were associated with minimal cardiac structural and functional abnormalities, regardless of having a high risk CACS (MESA ≥ 300). These findings were particularly demonstrated with multiple vascular and cardiac components including C2 (p-value = 0.015832), BP rise PME (p-value = 0.016073), CIMT (p value = 0.000000074), AAUS (p value = 0.27169), retinal photography (p value = 0.000001) and LVUS (p value = 0.000375). The complete data set for each component of the ECVHRS can be found in Table 5 and demonstrated visually in Figure 2, illustrating the 7 vascular components, and Figure 3, illustrating the 3 cardiac components.
It has been reported previously that an abnormal rise in systolic BP-PME was associated with significant cardiovascular abnormalities, and this was consistent throughout the research [6]. The PME rise in systolic BP was statistically significant with the rise in Group 1 being elevated at 39.59 ± 20.64 mmHg, while Group 2 was much lower at 26.62 ± 15.25 mmHg.
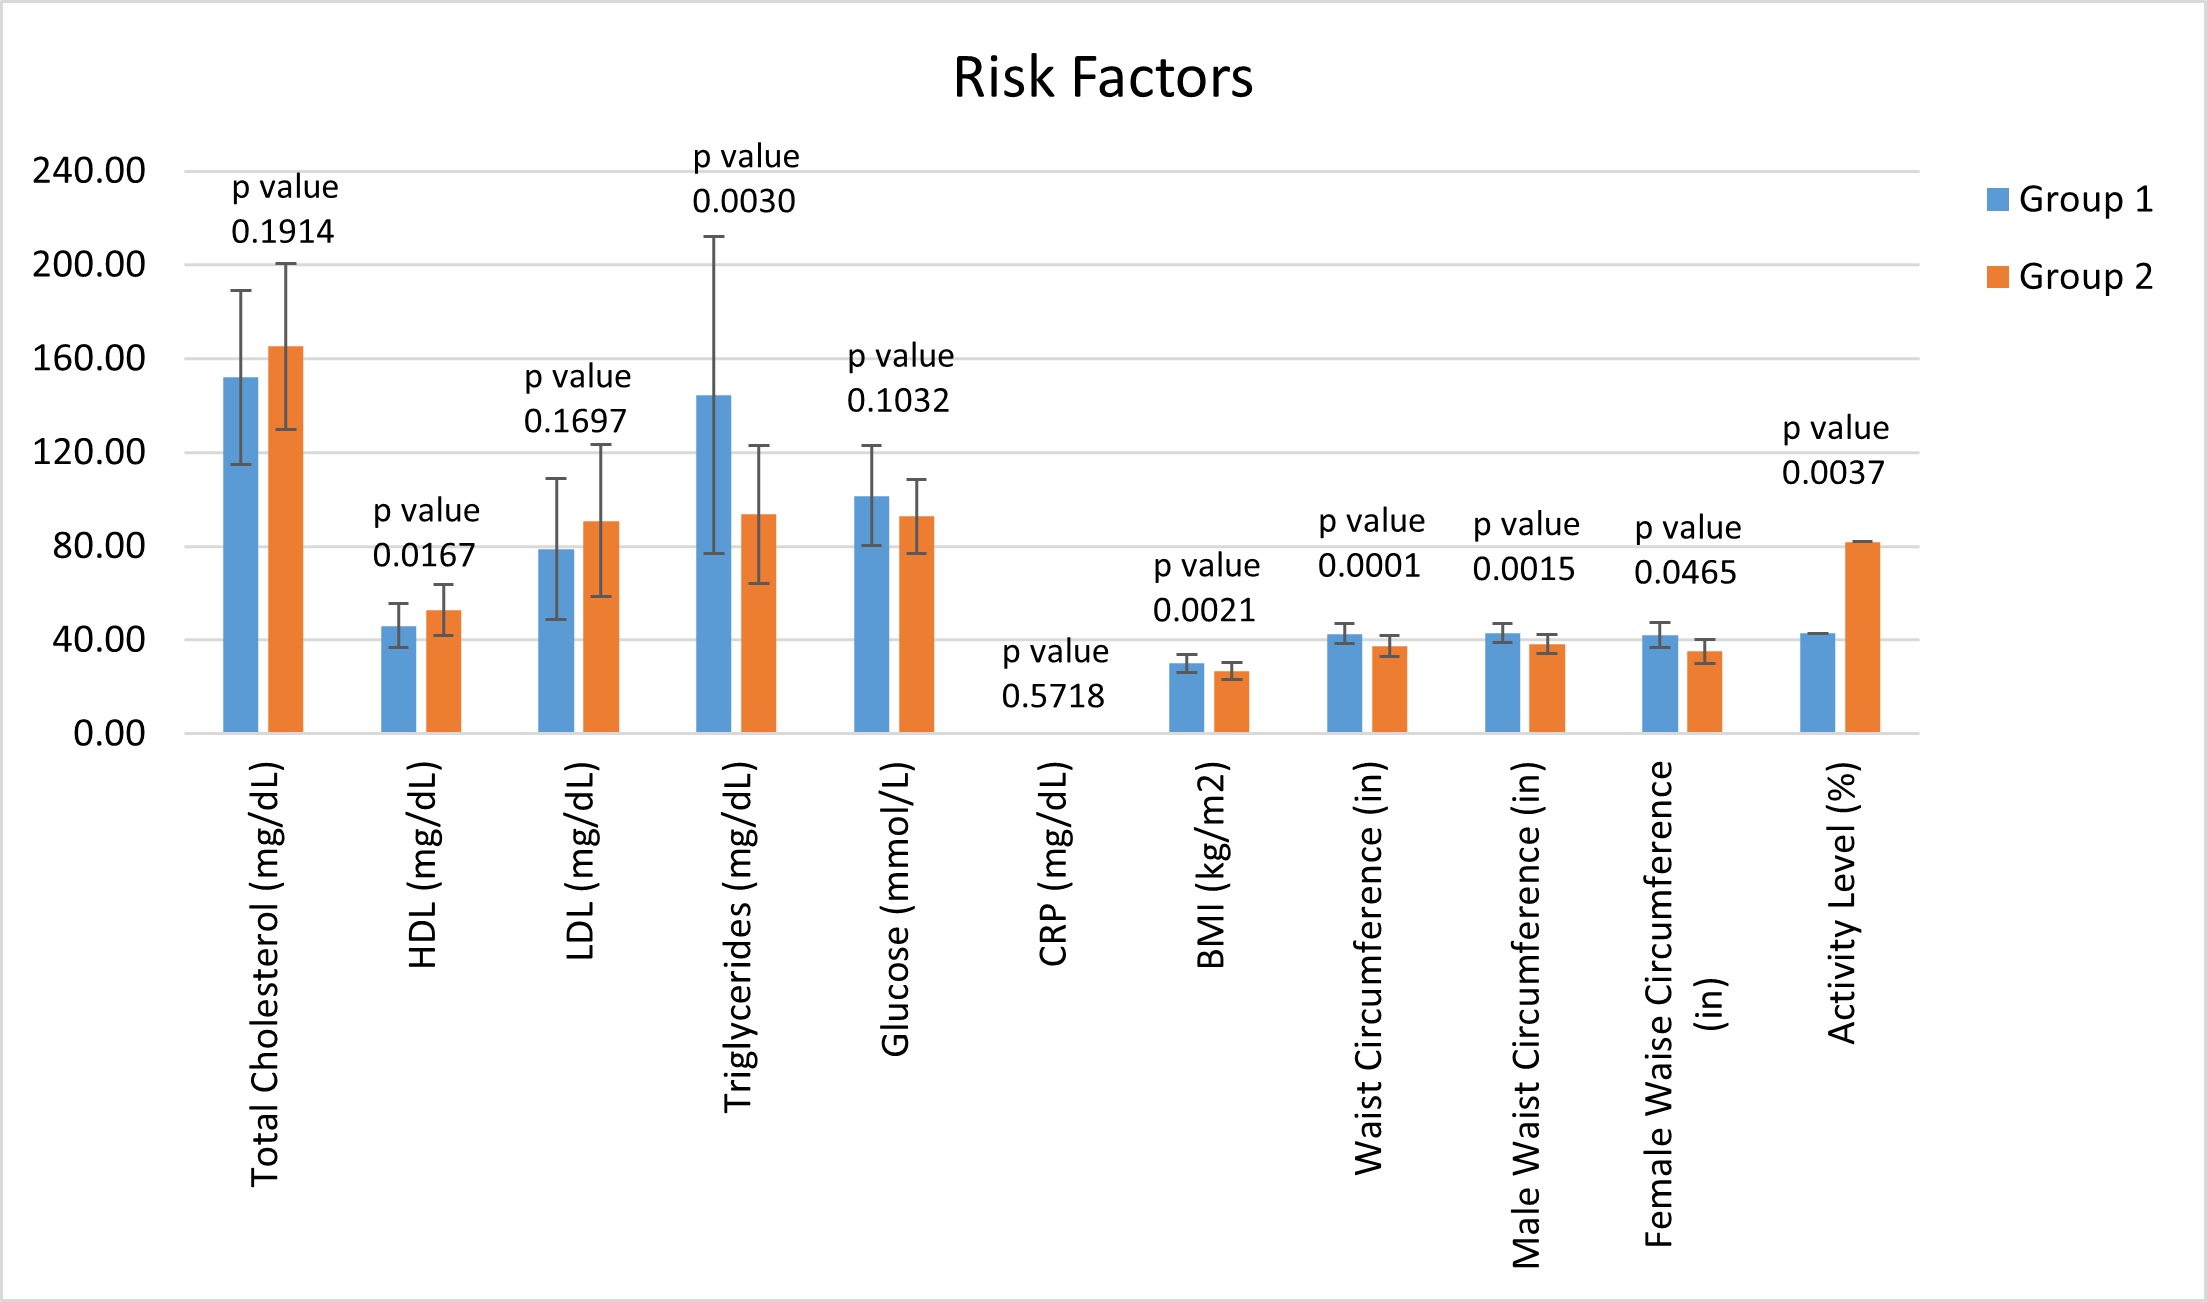
It was noted that the group with high EFV, Group 1, had an average waist circumference and BMI categorized as obese. Our data found the average waist circumference and BMI in Group 1 to be 42.71 ± 4.30 inches and 30.04 ± 3.92 kg/m2, respectively, both representing obesity. In contrast, the average waist circumference in Group 2was 37.40 ± 4.55 inches and the average BMI was 26.65 ± 3.61 kg/m2. We then divided each group into males and females and averaged the waist circumference measurements. Still, the data showed waist circumferences being considered obese in Group 1 and not obese in Group 2. These values were found to be statistically significant and can be found in Table 5 and demonstrated in Figure 4, along with the complete list of averages for common cardiovascular risk factors.
Finally, the overall difference in CACS and EFV between the two groups was striking. Though each group only contained subjects considered to be high risk by MESA, with a score ≥ 300, the average CACS was still much higher in Group 1. The average CACS in Group 1 was 951.48 ± 516.48 and was 580.26 ± 226.90 for Group 2. Continually, of utmost importance, and statistical significance, the average EFV in Group 1 was elevated ataveraging 144.85 ± 28.70 cm3 and normal in Group 2 at 70.77 ± 17.61 cm3. The significance of the difference in EFV has a p-value of < 0.0000000000000052, all shown in Table 5.
Discussion
Statistics from the Centers for Disease Control and Prevention (CDC) in 2020 show that heart disease is the leading cause of death in men, women, and people of most racial and ethnic groups in the United States [24]. CAD is the most common type of heart disease and CDC reports that around 18.2 million adults (6.7%) have CAD, and around 2 in 10 deaths from CAD occur in adults less than 65 years old [24]. The CDC also reports that on average, a United States citizen suffers a heart attack every 40 seconds. This totals to approximately 805,000 Americans each year. Per CDC, of these myocardial infarctions, 75% are the person's first heart attack [24].
Recent ACC/AHA guidelines recommend CACS for further optimal cardiovascular risk stratification [21]. Based on the results within our patient population, EFV appears to be another excellent tool for cardiovascular health risk assessment. In light of recent evidence, there is a rise in the number of STEMI patients who are young and are SMuRF-less. This data, when combined with the staggering statistics offered by the CDC, emphasizes the importance for more precise and earlier detection methods for cardiovascular disease risk to assess, stratify, and treat asymptomatic individuals for occult CAD.
We believe that the EAT could be a significant risk factor in the induction of numerous structural and functional abnormalities in the microvasculature and macro vasculature of the cardiovascular system. This may be due to an imbalance in the secretion of pro-inflammatory cytokines, such as leptin and adiponectin [25,26]. This imbalance could in turn cause the degradation of the endothelial glycocalyx. The glycocalyx is a gel-like layer covering the luminal surface of vascular endothelial cells [26]. The glycocalyx maintains homeostasis of the vasculature, including controlling vascular permeability and microvascular tone, preventing microvascular thrombosis, and regulating leukocyte adhesion [26]. The degradation of glycocalyx is also thought to contribute to microcirculatory dysfunction due to enzymatic degradation and mishandling of nitric oxide [26].
According to the present study, Group 1 (high EFV and high CACS) is associated with more structural and functional cardiovascular abnormalities than Group 2 (low EFV and high CACS) as evidenced by Table 5. The common cardiac microvascular risk marker and biomarkers, such as C2, were found to be significantly decreased in subjects with lower EFV. The lack of cardiovascular disease progression in subjects with a high-risk CACS and a low EFV could possibly be due to the location of calcium deposition, which might be heavily influenced by EAT.
Although not the purpose of our present study, we did note that some of our subjects with low EFV who had an elevated CACS, and were sent for a cardiac catheterization, often had no significant obstructive coronary lesions. Of interest, this was the group of patients who tended to be highly active. Interestingly, when assessing the activity level of the subjects, less than half of the subjects in Group 1 reported being active. Of those who claimed to be active, it was noted that the main form of exercise was passive, including walking and daily household chores. For comparison, the majority of the subjects in Group 2 were very active, meaning they exercised for more than 30 minutes per day, 3 to four times per week. The type of exercise reported by these subjects in Group 2 included more intense cardiovascular activity such as running, biking, swimming, tennis, and so on. Of note, many of the very active subjects in Group 2 claimed to participate in more than one form of exercise. This further emphasizes the correlation between exercise and the volume of EAT. It can be inferred that lack of exercise, i.e. a sedentary lifestyle, is a major contributing factor to excessive EFV. As a result, the excess EFV can lead to plaque formation and may correlate with a higher risk of cardiovascular events.
The running hypothesis and scientific theory is that the cytokines released by the EAT play a role in the localization of calcium, such that, when in excess, there is intravascular calcium deposition, leading to major CAD-related issues. Group 2 subjects were observed to be significantly more physically active in comparison to Group 1 subjects, which could have been a contributing factor to the reduction in EFV and in turn, a reduction of endothelial dysfunction through the mechanism of a more preserved endothelial glycocalyx [26].
Many studies have correlated the regression of EAT with weight loss and weight management, as well as routine exercise [27]. Given the significant relationship between waist circumference and EFV, regardless of gender, we posit that waist circumference be included in the overall assessment of subclinical CAD. Waist circumference can easily be utilized as a feasible, cost-effective, and quick screening method to determine which subjects are of high risk and should undergo further evaluation via cardiac CT scan. Many studies also consider using statin to reduce LDL levels below 70 mg/dL and utilizing a GLP-1 receptor agonist for the reduction of EFV [28]. Weekly administration of GLP-1 receptor agonists causes a rapid, substantial, and dose-dependent reduction in EAT thickness [28]. Hopefully, these findings will be a stimulus to other investigators to better understand the role of excess EFV in the genesis of cardiovascular disease and stimulate therapeutic interventions to prevent future cardiovascular complications.
Conclusion
Based on our current data, excess EFV is a novel CV risk marker beyond Agatston CACS. Time to focus on EFV determination on CT scans. As demonstrated within our target population, EFV quantification may be a more sensitive risk factor for CVD than the traditional CACS. More evidence is required to determine which quantification method is more accurate, but for the time-being, we propose that all cardiac CT scans should have both the CACS and the EFV [29].
Due to the limitations of our study, primarily based on the demographics of our target population, the validity of our study will need to be confirmed with larger and more diverse populations. In our study, most of the subjects were of the Caucasian race, meaning that this study will need to be expanded upon with a cohort with more racial diversity to further the impact of EFV on cardiovascular health. Additionally, there were more male subjects in both Group 1 (28 Males; 7 Females) and Group 2 (16 Males; 6 Females). Hopefully, studies soon will have a greater number of subjects that are both diverse in gender and race and will be able to duplicate and confirm our findings.
Nonetheless, our results may be interpreted as follows: the coronary artery calcium distribution, in the presence of a low EFV, is extravascular or less obstructive based on the lack of structural and functional abnormalities. Excess EFV, with excessive production of atherogenic cytokines and adipokines, such as leptin, resistin, IL-1, IL-6, and TNF-α, leads to endothelial dysfunction with subsequent intravascular plaque formation due to poor nitric oxide utilization and calcification, which might be obstructive, and might not be the case with normal EFV. In turn, excess EFV may lead to more future cardiovascular events.
Early detection of EFV will offer clinicians an opportunity to initiate early, aggressive lifestyle and therapeutic changes. Early detect to protect.
Acknowledgments
Thanks to Sarasota Memorial Health Care Foundation, Cardiovascular Center of Sarasota Foundation for Research and Education, and El Shahawy Family Foundation for supporting this research. Thanks also to all subjects who participated in this study and to many of our colleagues for referring their patients for CV screening. Thanks also go particularly to cardiac surgeon Dr. Thomas Kelly, who founded the Heart Surgery Program many decades ago at our institution, who commented to us that many of his patients that came in for Coronary Artery Bypass Graft (CABG) had excess EAT. Last but not least, thanks to our staff who have been doing an excellent job and follow up, particularly Ramona Stevens, HendSawaf, and Sharon Wetzler NP. Funding was provided by the Cardiovascular Center of Sarasota Foundation for Education and Research, El Shahawy Family Foundation, Sarasota Memorial Healthcare Foundation.
References
- O'Donnell CJ, Elosua, R (2008) Cardiovascular risk factors. Insights from framingham heart study. Rev Esp Cardiol 61: 299-310.
- Sacks HS, Fain JN, Holman B, et al. (2009) Uncoupling protein-1 and related messenger ribonucleic acids in human epicardial and other adipose tissues: Epicardial fat functioning as brown fat. J Clin Endocrinol Metab 94: 3611-3615.
- LaMonte MJ, FitzGerald SJ, Church TS, et al. (2005) Coronary artery calcium score and coronary heart disease events in a large cohort of asymptomatic men and women. Am J Epidemiol 164: 421-429.
- McEvoy JW, Blaha MJ, Defilippis AP, et al. (2010) Coronary artery calcium progression: An important clinical measurement? A review of published reports. J Am Coll Cardiol 56: 1613-1622.
- Alluri K, Joshi PH, Henry TS, et al. (2015) Scoring of coronary artery calcium scans: History, assumptions, current limitations, and future directions. Atherosclerosis 239: 109-117.
- El Shahawy M, Tucker S, Izadi L, et al. (2021) Excess epicardial fat volume in women is a novel risk marker for microvascular dysfunction, which may be a contributing factor in the atypical chest pain syndrome. Egypt Heart J 73: 37.
- Wu Y, Zhang A, Hamilton DJ, et al. (2017) Epicardial fat in the maintenance of cardiovascular health. Methodist Debakey Cardiovasc J 13: 20-24.
- Parsaei MS, Nabati M, Yazdani J, et al. (2014) Relationship between epicardial fat and coronary microvascular dysfunction. Kardiol Pol 72: 417-424.
- Talman AH, Psaltis PJ, Cameron JD, et al. (2014) Epicardial adipose tissue: Far more than a fat depot. Cardiovasc Diagn Ther 4: 416-429.
- Turer AT, Scherer PE (2012) Adiponectin: Mechanistic insights and clinical implications. Diabetologia 55: 2319-2326.
- Wong HK, Cheung TT, Cheung BM (2012) Adrenomedullin and cardiovascular diseases. JRSM Cardiovasc Dis.
- González N, Moreno-Villegas Z, González-Bris A, et al. (2017) Regulation of visceral and epicardial adipose tissue for preventing cardiovascular injuries associated with obesity and diabetes. Cardiovascular Diabetology 16: 44.
- Leo LA, Paiocchi VL, Schlossbauer SA, et al. (2019) The intrusive nature of epicardial adipose tissue as revealed by cardiac magnetic resonance. J Cardiovasc Echogr 29: 45-51.
- Chechi K, Richard D (2015) Thermogenic potential and physiological relevance of human epicardial adipose tissue. Int J Obes Suppl 5: S28-S34.
- Forouzandeh F, Chang SM, Muhyieddeen K, et al. (2013) Does quantifying epicardial and intrathoracic fat with noncontrast computed tomography improve risk stratification beyond calcium scoring alone? Circ Cardiovasc Imaging 6: 58-66.
- Cabrera-Rego JO, Navarro-Despaigne D, Staroushik-Morel L, et al. (2018) Association between endothelial dysfunction, epicardial fat and subclinical atherosclerosis during menopause. Clin Investig Arteriosclerosis 30: 21-27.
- Almeida S, Pelter M, Shaikh K, et al. (2020) Feasibility of measuring pericoronary fat from precontrast scans: Effect of iodinated contrast on pericoronary fat attenuation. J Cardiovasc Comput Tomogr 14: 490-494.
- Gorter PM, Van Lindert AS, De Vos AM, et al. (2008) Quantification of epicardial and peri-coronary fat using cardiac computed tomography; reproducibility and relation with obesity and metabolic syndrome in patients suspected of coronary artery disease. Atherosclerosis 197: 896-903.
- Wu F, Huang Y, Wang Y, et al. (2013) Impact of location of epicardial adipose tissue, measured by coronary artery calcium-scoring computed tomography on obstructive coronary artery disease. Am J Cardiol 112: 943-949.
- Christensen RH, von Scholten BJ, Lehrskov LL, et al. (2020) Epicardial adipose tissue: an emerging biomarker of cardiovascular complications in type 2 diabetes? Ther Adv Endocrinol Metab 11: 2042018820928824.
- Toczyłowski K, Gruca M, Baranowski M (2013) Epicardial adipose tissue and its role in cardiac physiology and disease. Postepy Hig Med Dosw 20: 584-593.
- El Shahawy M, Izadi L, Sabatini A, et al. (2020) Quantification of epicardial fat volume as a novel cardiovascular risk marker in astmptomatic subjects for early detection of cardiovascular disease. medRxiv.
- Maas AHEM, Appelman YEA (2010) Gender differences in coronary heart disease. Neth Heart Journal 18: 598-602.
- Heart disease facts. CDC Online Database (2020) Centers for Disease Control and Prevention, Atlanta, GA, USA.
- Rabkin SW (2007) Epicardial fat: Properties, function and relationship to obesity. Obes Rev 8: 253-261.
- Uchimido R, Schmidt EP, Shapiro NI (2019) The glycocalyx: A novel diagnostic and therapeutic target in sepsis. Crit Care 23: 16.
- Iacobellis G, Ribaudo MC, Zappaterreno A, et al. (2004) Relation between epicardial adipose tissue and left ventricular mass. Am J Cardiol 94: 1084-1087.
- Iacobellis G, Villasante Fricke AC (2020) Effects of semaglutide versus dulaglutide on epicardial fat thickness in subjects with type 2 diabetes and obesity. J Endocr Soc 4: bvz042.
- Cohn JN, Duprez DA (2008) Time to foster a rational approach to preventing cardiovascular morbid events. J Am Coll Cardiol 52: 327-329.
Corresponding Author
Mahfouz El Shahawy, MD, MS, FACP, FSCCT, FASH, FESC, FAHA, FACC, FASPC, 1950 Arlington Street, Suite 300, Sarasota, Florida 34239, USA, Tel: (941)-366-9800
Copyright
© 2021 Shahawy ME. This is an open-access article distributed under the terms of the Creative Commons Attribution License, which permits unrestricted use, distribution, and reproduction in any medium, provided the original author and source are credited.