Assessment of the QT Interval in WPW: A New Approach to Calculating the QT Interval in Pre-excitation
Abstract
Background
The initial slurring of the QRS complex, in WPW increases the QT interval rendering it a less accurate assessment of repolarization.
Objective
The objective was to develop a method to calculate the underlying QT interval in WPW from the 12 lead ECG.
Methods
Patients with a diagnosis of intermittent WPW on a single ECG had measurements of QT interval, delta wave duration, QRS duration and JT interval. Seven different equations were evaluated in pre-excited compared to non-pre excited conduction with the latter considered the 'true' or underlying (intrinsic) QT interval. The best formulae were tested in a separate group of 100 patients with WPW.
Results
The QT interval of 'pre excited' QRS complexes (QTwpw) were significantly longer than the non-pre excited QT interval (QTi), in each of four different heart rate correction formulae. Three equations showed highly significant (p < 0.0001) correlations with QTi (r = 0.918 to 0.977) using either parametric or non-parametric testing and were better than subtracting delta wave duration from QTwpw an equations with the strongest correlation, highest F value, was selected. In a separate sample of 100 persons with pre excitation, QT heart rate dependency was not completely corrected by the Bazett formula and this formula produced unacceptably high estimates for QT prolongation. Three other heart rate correlation formulae showed a consistent and low prevalence of QT prolongation.
Conclusion
An accurate assessment of the underlying QT interval in pre-excitation is attained from the formula QTwpw - 0.462 (QRSwpw) + 18.26 followed by a heart rate correction formula other than the Bazett approach.
Keywords
QT interval, Delta wave, Repolarization, JT interval, Pre excitation, Wolff-Parkinson-white WPW, Intermittent WPW
Introduction
The initial slurring of the QRS complex, labelled the delta wave (∆), is an essential part of the criteria that define the ventricular preexcitation (Wolff-Parkinson-White) syndrome as well as aiding in the identification of the sites of epicardial preexcitation [1,2]. Because the delta wave is the initial slurring of the upstroke of the QRS complex, it produces a widening of the QRS complex. Thus, the delta wave impacts the measurement of the QT interval, which is measured from the onset of the QRS complex to the end of the T wave. The QT interval is an important indicator of the toxicity of various medications as well as being an indicator of the predisposition to arrhythmias that have the potential to be fatal [3,4]. The question arises how to best measure the QT interval in the presence of pre-excitation or Wolff-Parkinson-White (WPW) conduction.
Accurate measurement of repolarization in patients with preexcitation has seldom been studied. Ducceschi, et al. noted that the JT interval in WPW patients was more similar, than the QT interval, to the JT interval of individuals without WPW [5]. Salim, et al. studied patients with WPW before and after pathway ablation and found that the JT interval did not change post-ablation as compared to the QT interval which did change post ablation [6]. The JT interval can be helpful, but there is not a large body of literature on its normal distribution in the population to define abnormal limits and the correlation with potentially fatal arrhythmias. Furthermore, the JT interval has a strong correlation with heart rate that has been demonstrated with pacing-induced changes in heart rate [7]. Population-based data in persons with increased QT interval associated with ventricular conduction defects concluded that the JT adjustment "retained a strong residual correlation with ventricular rate making its use ill-advised" [8]. Thus, an approach to modify the QT interval to adjust for the delta wave is an attractive approach to deal with the measurement of the QT interval in WPW.
The objective of this study was to determine the best method from evaluation of the 12 lead ECG to assess the QT interval. The delta wave can be transient [9,10]. Thus, we sought to examine the ECGs of patients who had intermittent WPW identified on the same ECG. This approach would allow an assessment of the QT interval in the presence and the absence of pre-excitation. The aim of this study was two-fold. First, the best method (s) to calculate the QT interval in the presence of preexcitation was to be developed utilizing cases of intermittent preexcitation considering that the QT interval in the absence of pre-excitation represented the 'true' underlying QT interval. The second objective was to define the distribution of QT interval, in separate population with WPW, using the best approaches to adjust for the delta wave in pre-excitation.
Methods
Patient Selection
Patients with a diagnosis of "intermittent Wolff-Parkinson-White," were selected via an electronic search of a MUSETM version 9.0 SP6 (General Electric, Milwaukee, WI, USA) database. Inclusion criteria consisted of 12-lead ECGs with both narrow QRS complexes (< 120 m sec) as well as QRS complexes with WPW morphology. Exclusion criteria consisted of ECGs with artifacts rendering QT measurement unreliable, T-wave changes that rendered QT measurements unreliable, only one non-pre excited complex with normal QRS duration, electronic pacemaker complexes. ECG diagnoses were confirmed by a reading cardiologist at the Vancouver General Hospital between January 1, 2004 and January 9, 2020.
We next sought to implement and examine the QT interval in a larger population of patients with WPW that was not intermittent. These patients were not part of the original patient data set to provide a separate 'validation' group, by applying our equations to data that was not used to generate the original equations. Patients with a diagnosis of WPW were identified from a 12-lead electrocardiogram, in the Muse™ version 9.0 SP6 (General Electric, Milwaukee, WI, USA) data base at our institution All ECGs were confirmed by a reading cardiologist. Exclusion criteria consisted of ECGs with the diagnosis of possible or probable WPW (only cases with definite WPW were included), rhythms other than sinus rhythm, artifacts rendering QT measurement unreliable, T-wave changes that rendered QT measurements unreliable, or electronic pacemaker complexes. The sample size was set at 100 and a consecutive series of patient ECGs were assessed with each patient contributing one ECG. The equations to be evaluated was decided to be the ones that best fit the data derived from the intermittent WPW analysis.
Patient age, gender, heart rate, cardiac rhythm, PR interval, QRS duration, QT interval, and delta wave axis were assessed. The study was approved by the Institution's Committee of Research.
ECG Measurements
12-lead ECGs were recorded at 25mm/s on a 10-second strip. Digital calipers (MUSETM version 9.0 SP6; General Electric, Boston) were used to measure the PR interval, QRS duration, QT interval and modified QT interval (mQT). Leads for measurements were chosen based on the best WPW representation (i.e. most clear delta wave). Non-preexcited complexes were measured on the same leads as measured WPW complexes. Using the magnification function, measurements were performed by one observer (JWK) and verified by another observer (SWR). PR interval was measured from the beginning of the P-wave to the beginning of the QRS deflection. QRS duration was measured from the beginning of the QRS deflection to the J-point. QT interval was measured from the initial QRS deflection to the end of the T-wave. The end of the T-wave was determined by extrapolating the slope of the end of the T-wave to the isoelectric line. The JT interval was measured as the QRS duration subtracted by the QT interval.
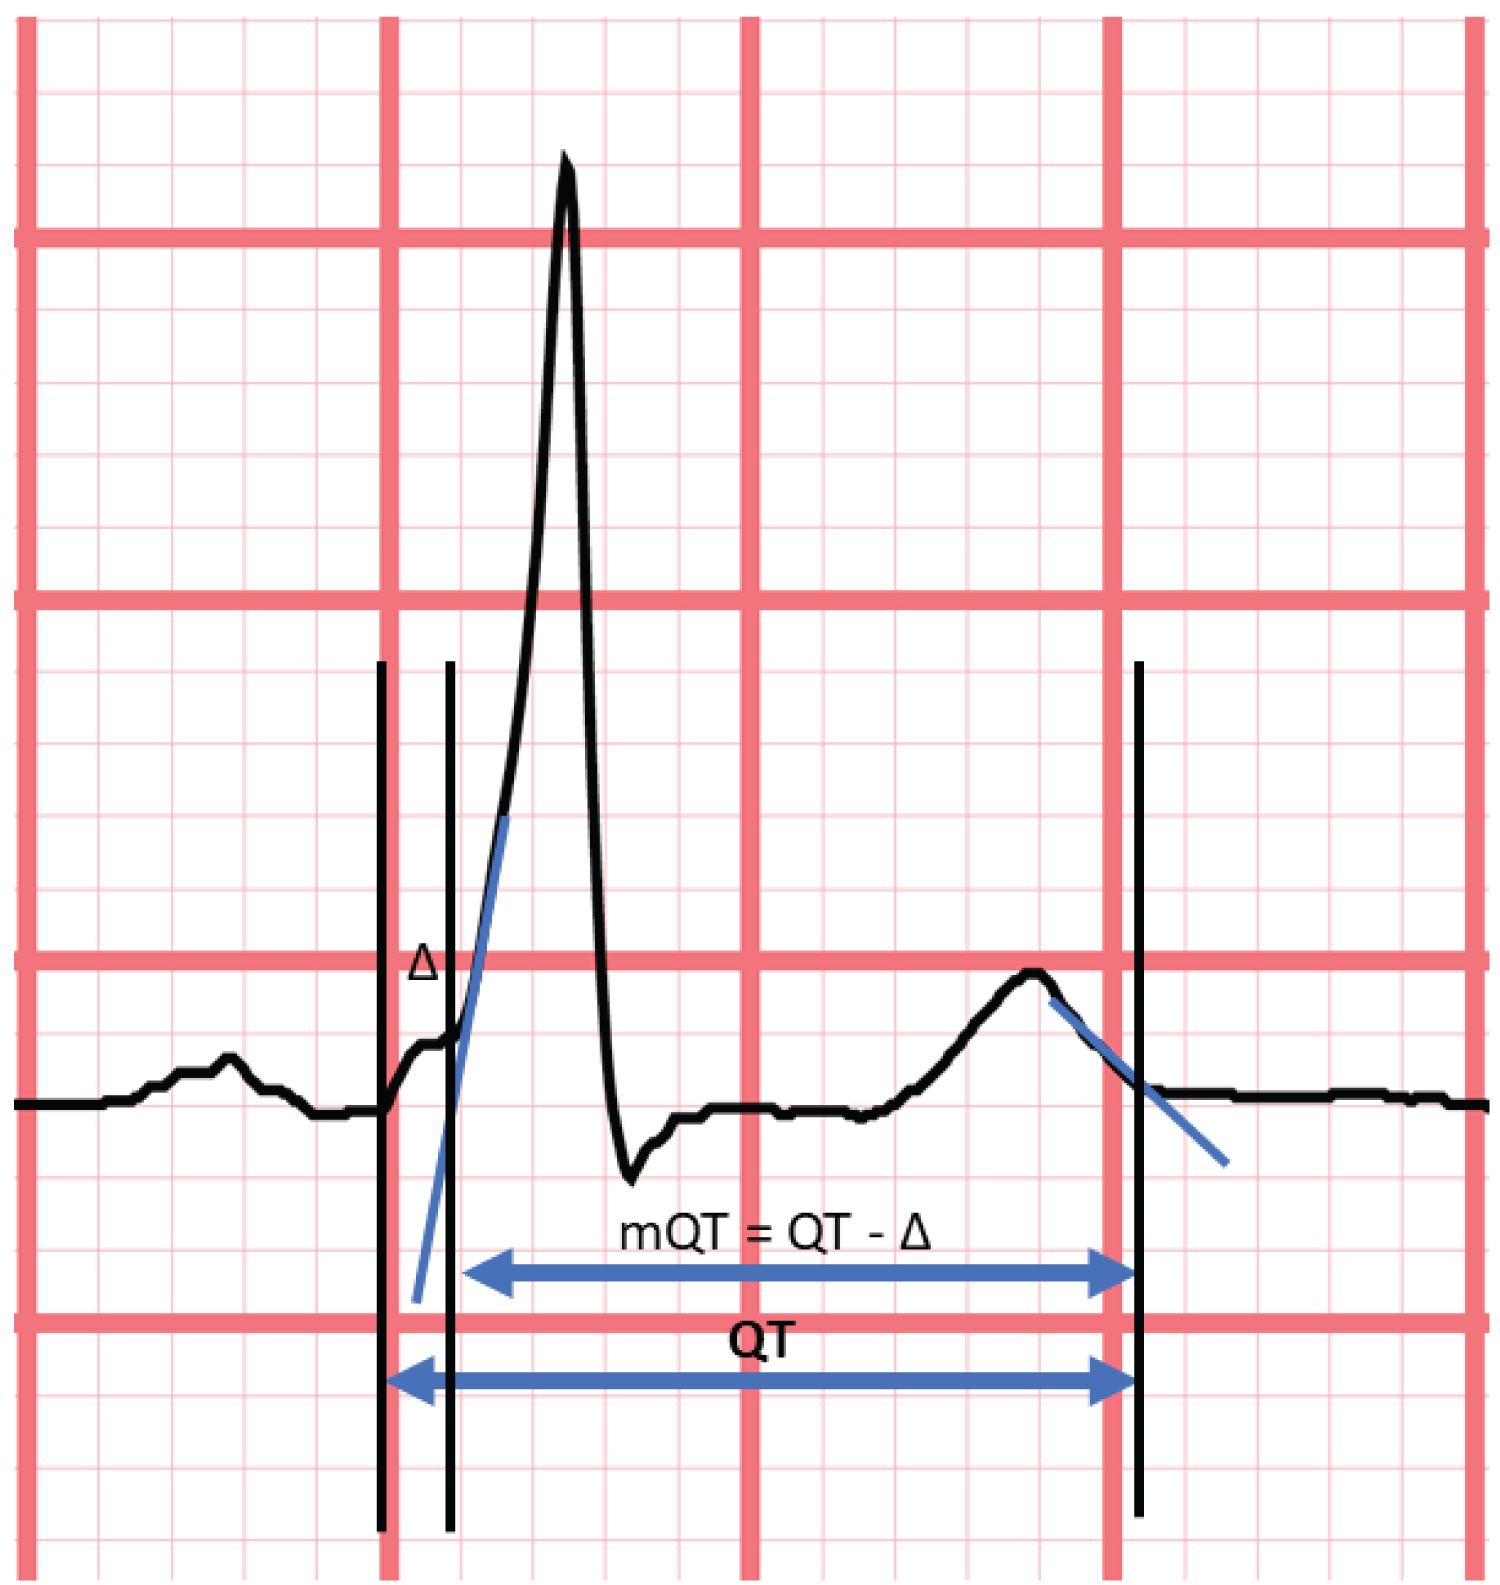
To determine whether a modification of the QT interval (mQT), can be useful, the duration of the delta wave was measured by extrapolating the R-wave slope after the delta wave (∆), to baseline at the point where the QRS deflection begins (Figure 1). The contribution made by the delta wave to the QRS duration was calculated by subtracting the delta wave from QRS duration.
At least one to three complexes with WPW morphology and two to three complexes with non-preexcited morphology were measured in each patient, depending on the number of QRS complexes available on the ECG tracing. The mean was then calculated for each measurement.
Data analysis
Different approaches to adjust the QT interval were evaluated by correlating the QT-interval with pre-excitation (QTwpw) and the QT interval in the absence of pre-excitation or the non-preexcited QT (QTi). These approaches or equations were:
1) QT = QTwpw - ∆ wave, or mQT, represents the mean QT resulting from the subtraction of the delta wave duration (∆ wave) from the total QT duration.
2) QT = QTwpw x (mQT/QTwpw) represents the product of the QT interval in pre-excitation multiplied by a constant derived from the data resulting from subtraction of the delta wave duration from the total QT duration divided by the mean QT in pre-excitation (QTwpw).
3) QT = (mQRS/QRSwpw) + (QTi – QTwpw x(mQRS/QRSwpw))
4) QT = QTwpw-((QTwpw-QTi)/QRSwpw) x QRSwpw. This equation is similar to the one proposed by Bogossian, et al. [11] and previously assessed to correct for the contribution by the increased QRS duration of left bundle branch block (LBBB) to the QT interval [12].
5) QT = QTwpw - (∆/QRSwpw) × QRSwpw
6) QT = QTw - m1(QRSwpw) + b1, where m1 and b1 are coefficients determined by comparing the relationship between ∆ and QRSwpw. This equation was based on the approach suggested by Wang, et al. [13] and previously assessed to correct for the contribution by LBBB to the QT interval [12]. This equation approximates the delta wave by comparing it with QRSwpw, thereby creating a linear equation.
7) QT = m2 (QTwpw) + b2, where m2 and b2 are coefficients determined by comparing the relationship between QTi and QTwpw, thereby creating a linear equation.
These modifications of QT intervals were adjusted for the heart rate dependency of the QT interval using four different correction formulae (QTc).The QT intervals were corrected for heart rate with the Bazett approach (QTcBZT) as well as the Fridericia approach (QTcFRD) because both formulae are in widespread usage [14,15]. The Framingham formula (QTcFRM) was selected [16], as well as the new spline formula (QTcRBK) that was developed based on the ECGs from about 13,600 individuals in the NHANES US population study and was shown to be relatively independent of heart rate and superior to other QTc formulae [17]. We used the nomenclature for QTc abbreviations which specified the first three consonants of the first authors name with the exception of the Framingham formula [18].
In addition, the JT interval was measured and JT in WPW was compared it to the JT interval in non-preexcited conduction (JTi).
Statistical analysis
The data are presented as the mean ± SD. The t test for unpaired, non-parametric data, was used to test differences between the non-preexcited QT interval (QTi) and QTwpw. Comparison of different heart rate correction formulae used ANOVA testing. Linear regression analysis was used to evaluate heart rate dependency. Regression analyses were also performed to examine the relationship between the modified QT intervals and the QTi as compared to the relationship between QTwpw and QTi, using both parametric (Pearson's r) and non -parametric (Spearman r) testing. We quantified the strength of the relationship between non-preexcited QT interval (QTi) and pre-excited QT (QTwpw) using the F statistic. A 5% probability level (p < 0.05) was considered as statistically significant.
Results
Population
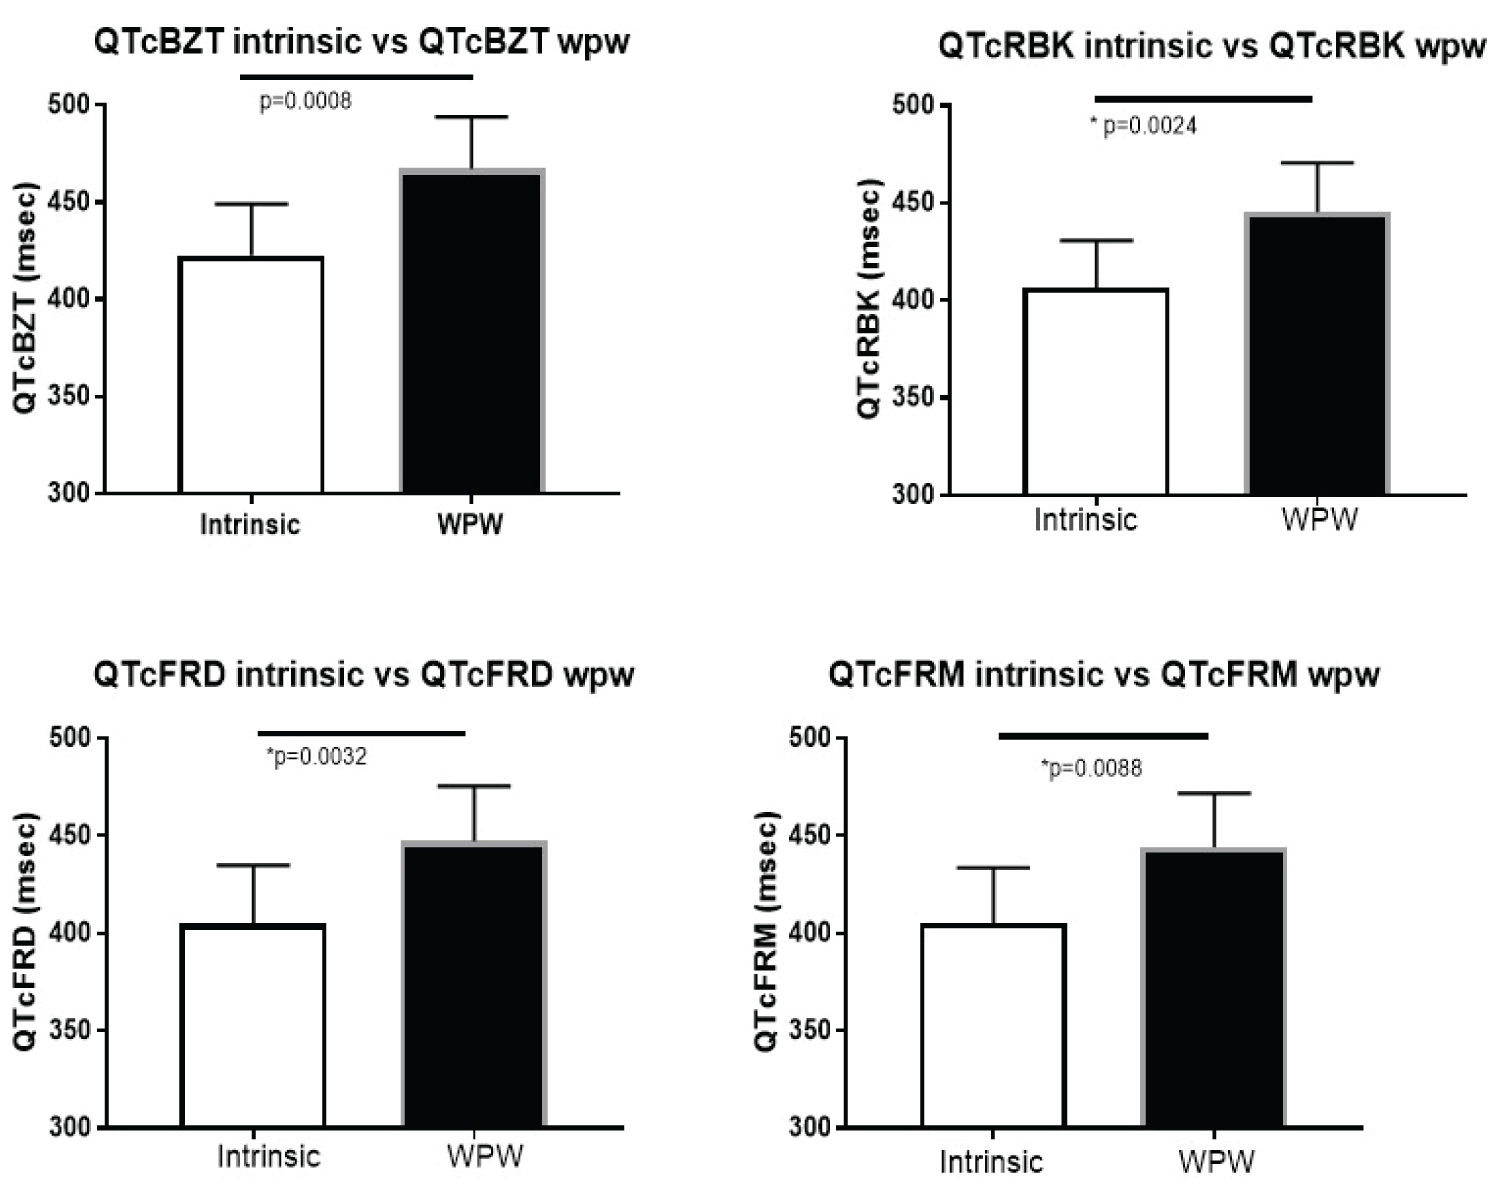
Characteristics of the sample population are summarized in (Table 1). The intermittent pre-excitation population consisted of 11 patients (mean age 52 ± 23.4 years; 55% male) who met the entry criteria. The QT interval of QRS complexes with pre-excitation (QTwpw) were significantly longer than the non-preexcited QT interval (QTi) for each of the different correction factors (Figure 2).
Comparing QT intervals estimates in the presence of pre-excitation and non-preexcited QT interval (QTi)
The highest correlations amongst the 7 different formulae to estimate non-preexcited QT interval (QTi) in the presence of WPW was equation 6 which had the highest F values across all heart rate adjustment approaches in parametric statistical testing and the highest overall correlations in non-parametric testing (Table 2). This was followed by equation 5 and next equation 4. Each of these formulae were better that subtracting the measured duration of the delta wave from the total QT duration in pre-excitation (formula 1). Interestingly formula 1 was better than three other approaches to estimate the QT interval.
Within each formula, heart rate correction using the Bazett approach produced the lowest correlation between preexcitation and non pre-excited QTc.
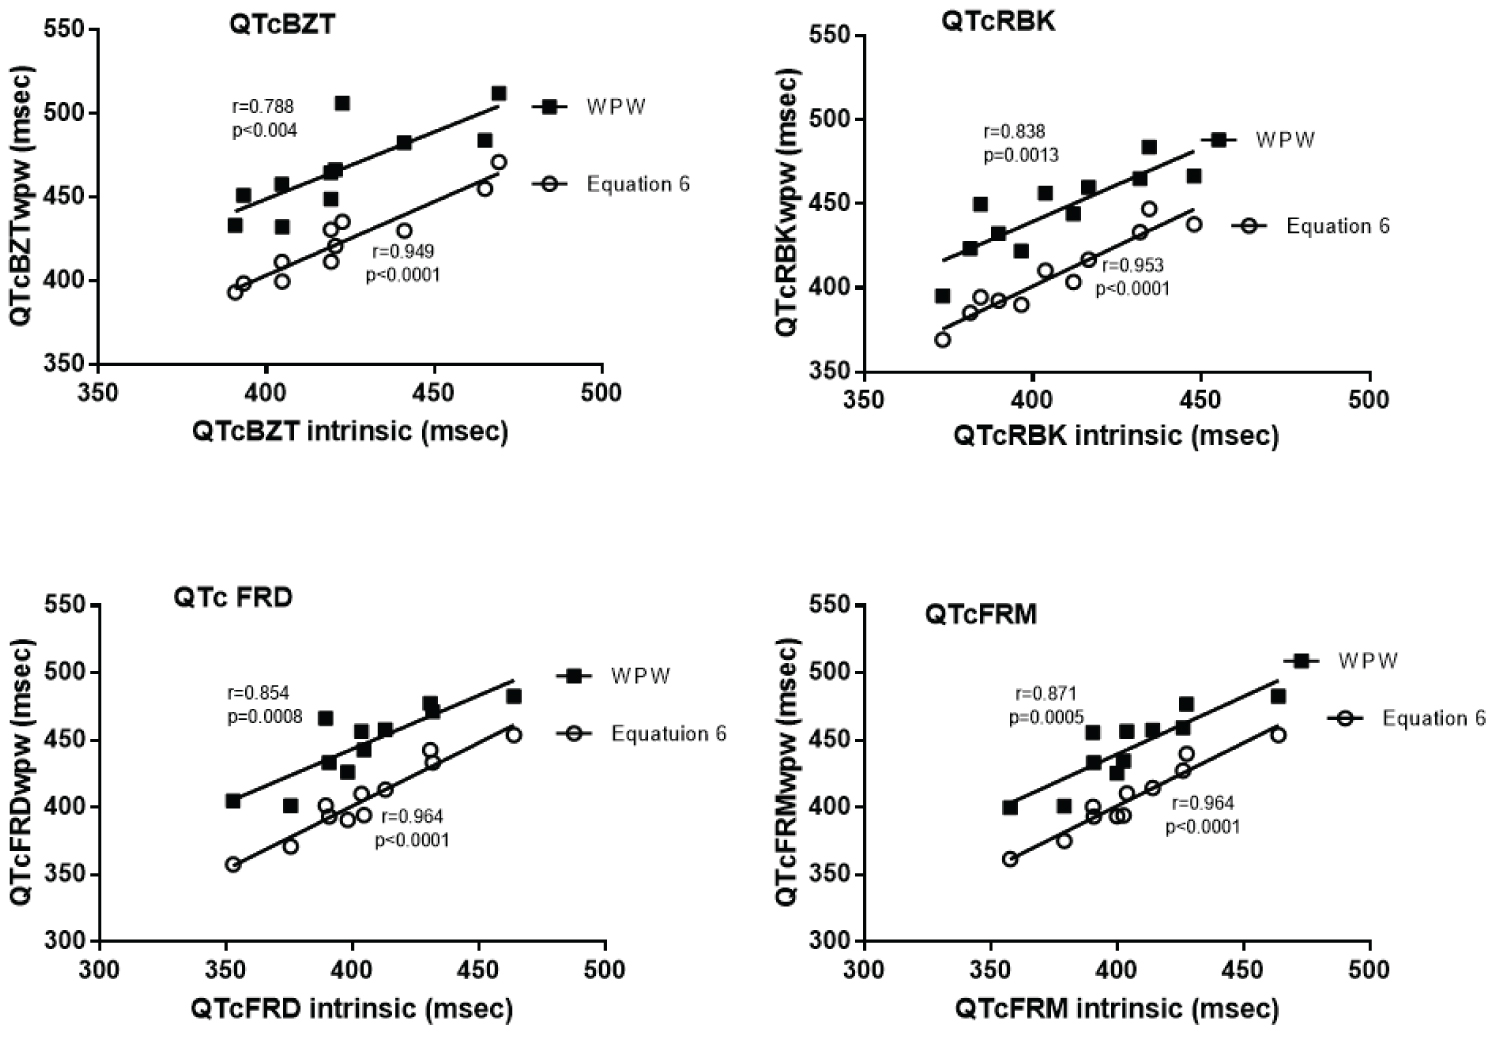
The ability of the formulae to correct for the delta wave was illustrated using equation 6 for each of the four heart rate correction formulae (Figure 3). Use of equation 6 reduced the magnitude of the QT interval across the range of QT intervals. Furthermore, the correlation between the QT interval utilizing Equation 6 was higher than the correlation between pre-excited QTc and the non-pre-excited QTc. The data is similar if Equation 5 was used. The data displayed (Figure 3) provide justification for the use of the linear correlation analysis using Pearson's correlation, as the data are not clustered around certain areas that might artifactually produce a linear relationship rather as illustrated by equation 6 the data appear to fit a very well a linear correlation methodology.
Examining the JT interval data showed that JTwpw was significantly correlated with the pre-excited JT for all heart rate correction formulae (Table 2).
QTc in a WPW population
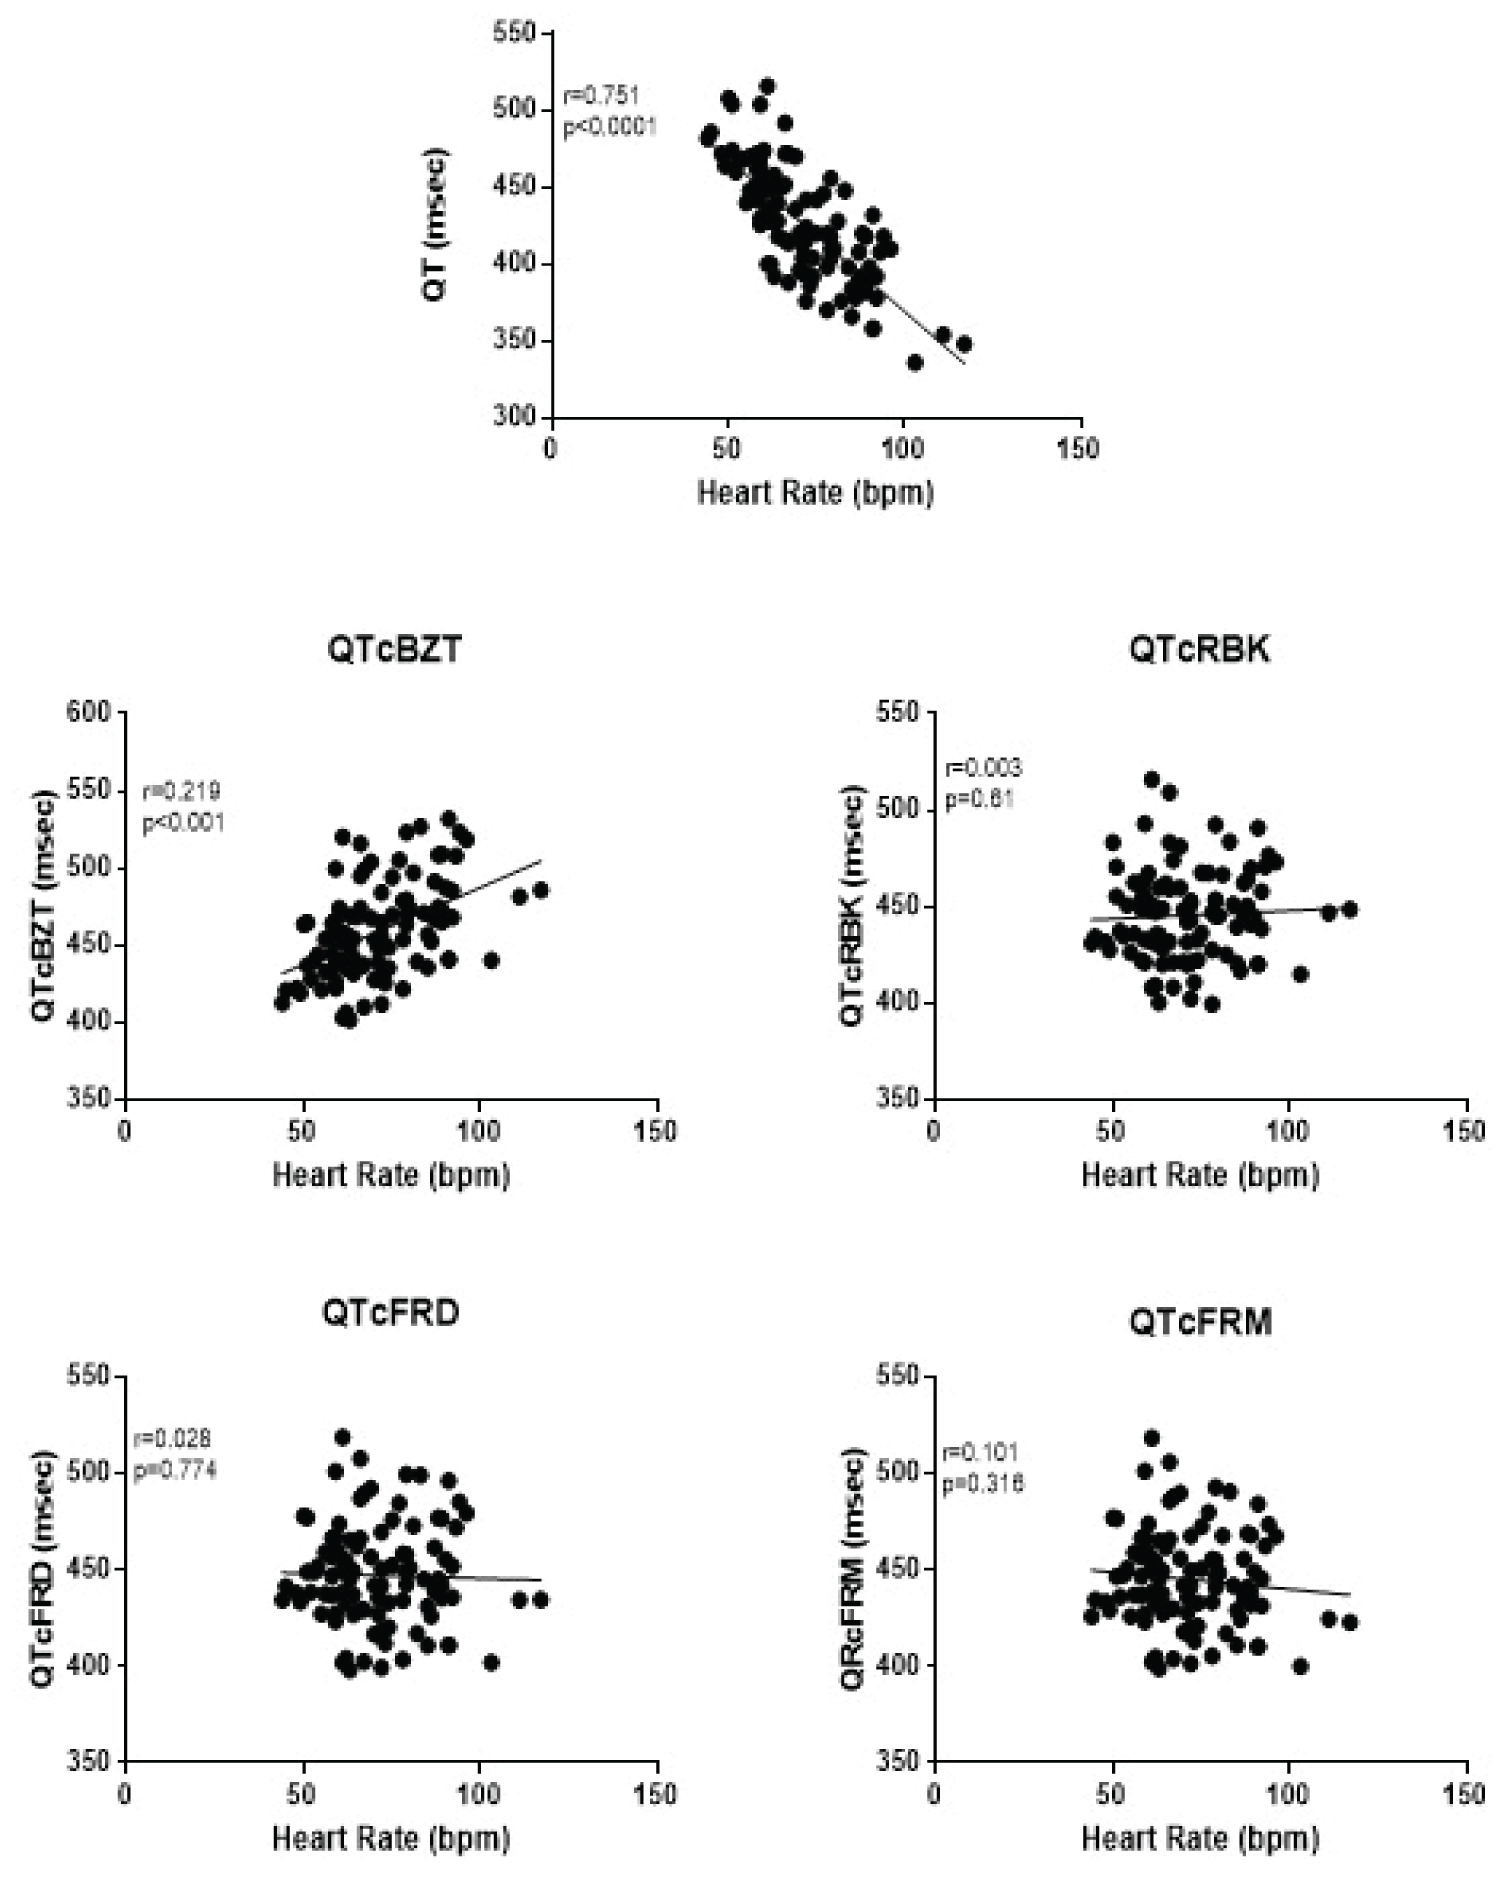
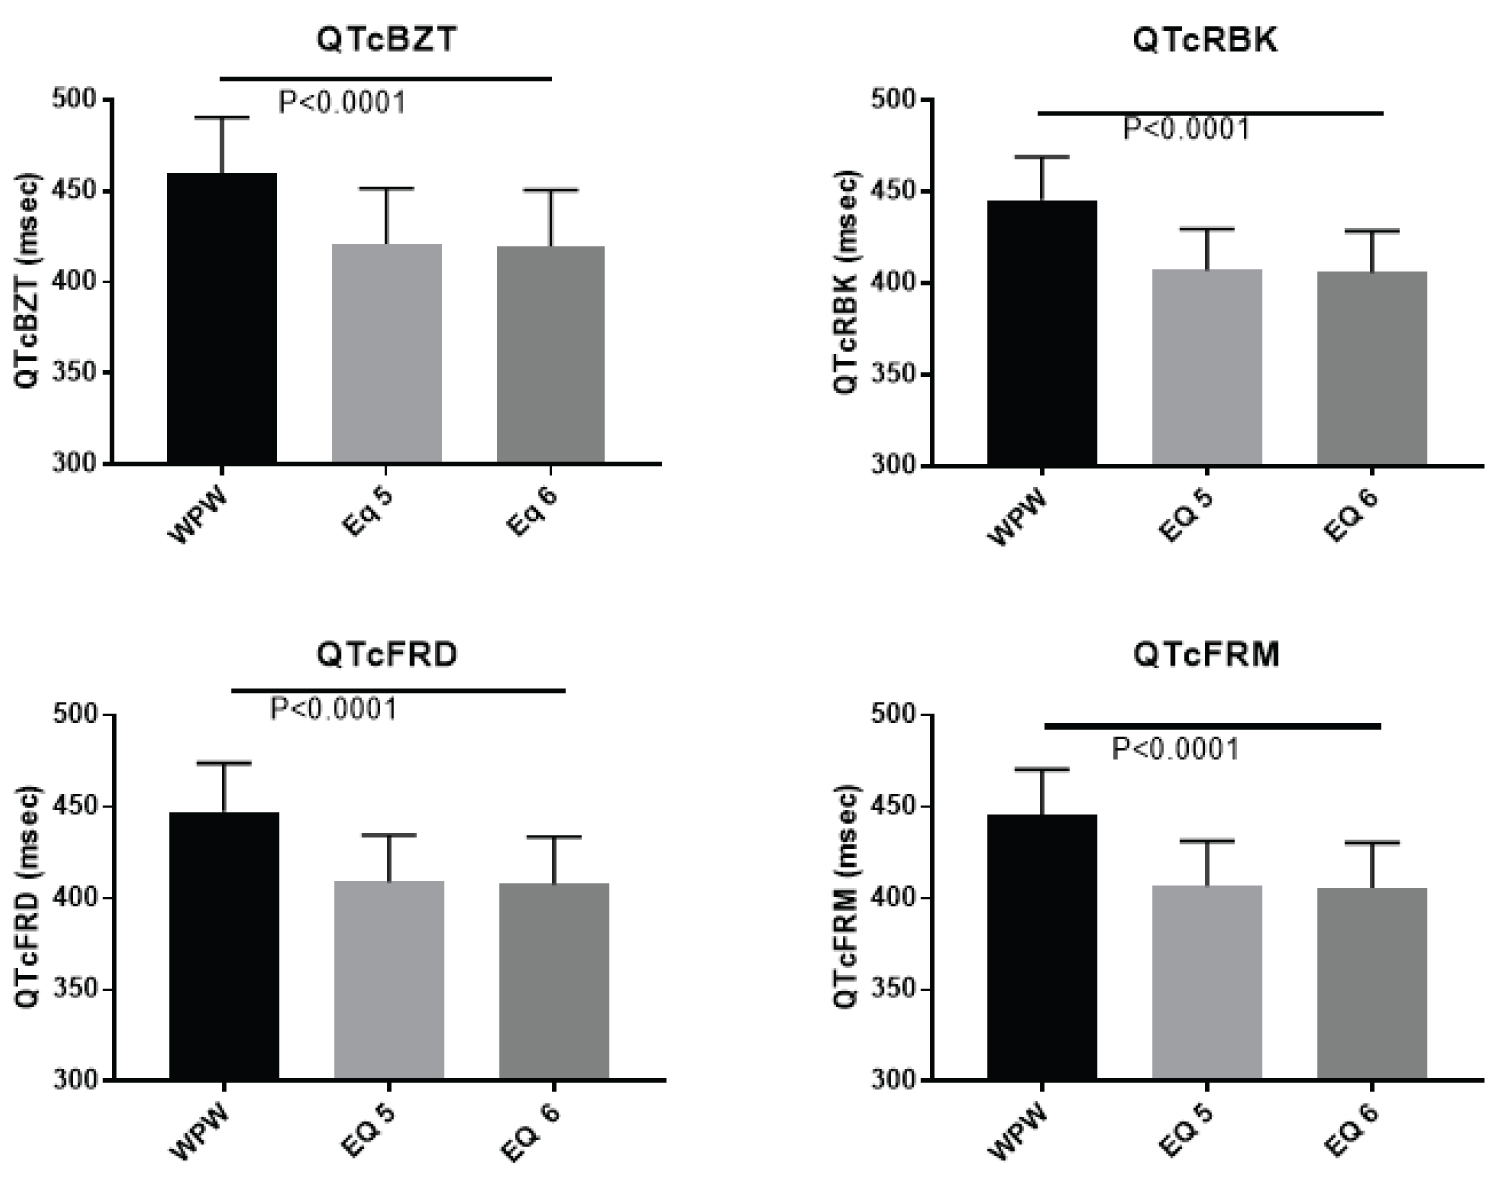
A larger patient data set with 100 individuals with WPW was examined that served in part to cross-validated the formulae by applying it to data that was not used to fit the original equations. The mean age was 44.0 ± 18.2 years with the majority (65%) of the population being men (Table 1). The known heart rate dependency of the QT interval was evident in pre-excitation (Figure 4). The heart rate correction formulae produced different degrees of heart rate adjustment depending on the formula. QTc BZT was still associated with a significant (p < 0.001) relationship to heart rate. The other three formulae corrected the effect of heart rate as there was no significant association between each of the corrected QT interval and heart rate. The two-best formula for adjusting for the prolongation of the QT interval from the delta wave in WPW produced a significant (p < 0.0001) reduction in the magnitude of the QT interval for each of the QT correction formulae (Figure 5). Specifically, there were highly significant differences between the measured QT in pre-excitation and QT interval calculated using QTc BZT (F = 53.46) QTc FRD (F = 74.6) QTc FRM (F = 74.6) and QTc RBK (F = 96.2). This analysis demonstrated that both of these equations produced a significantly lower QT interval than the uncorrected QT interval in pre-excitation.
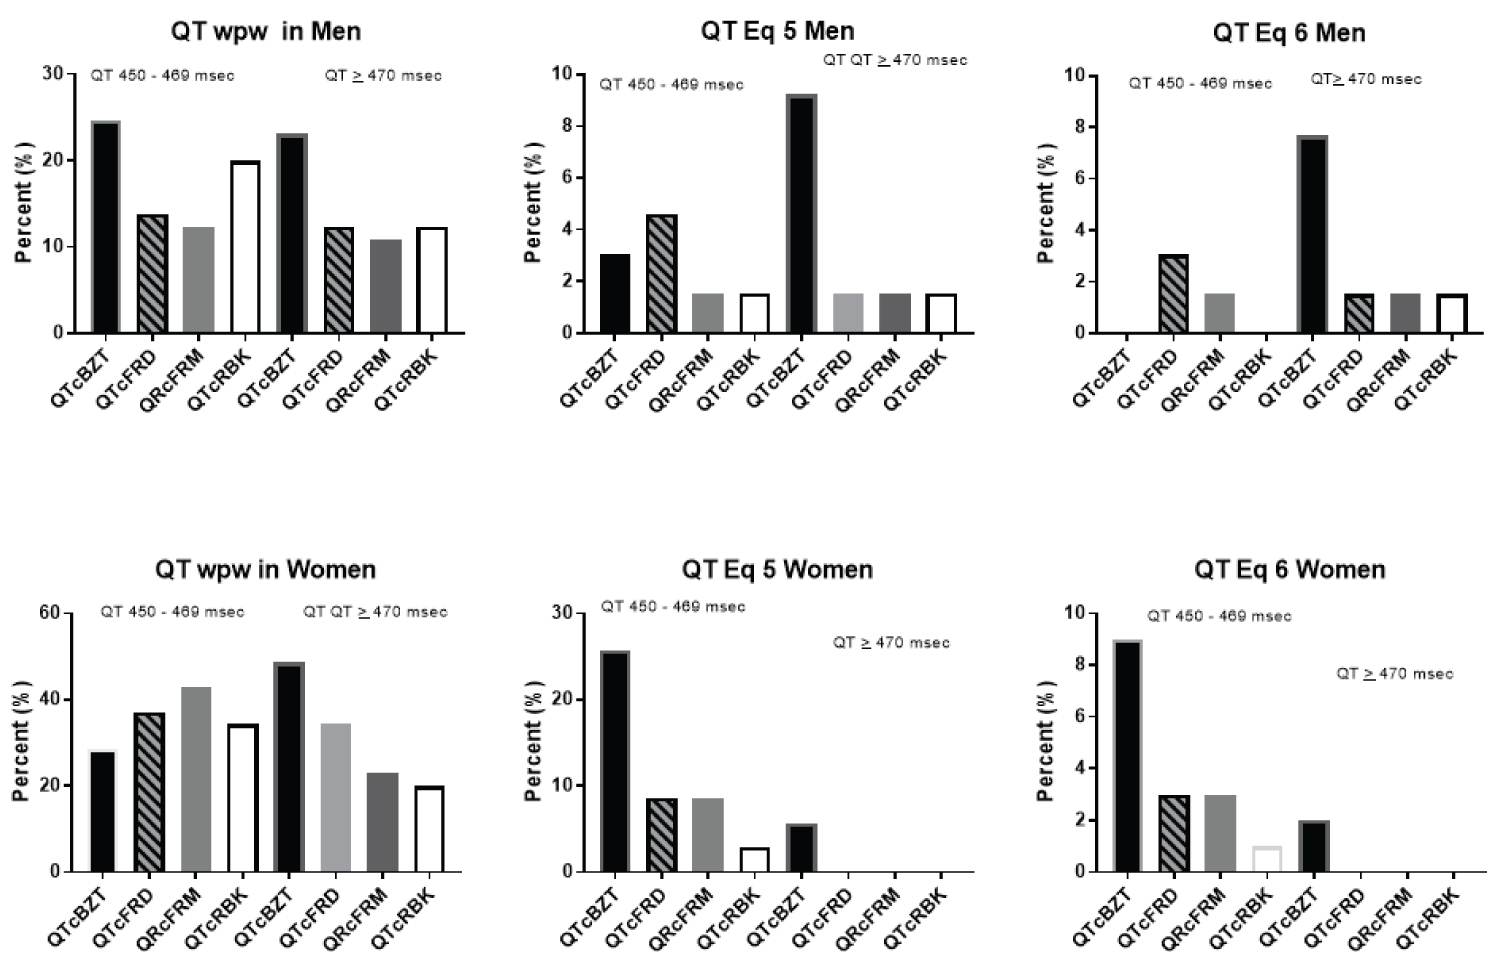
We next sought to evaluate the QT distribution in WPW utilizing the two different equations for adjusting for the delta wave (Figure 6). The relevant part of the distribution i.e. QT prolongation was the focus and was evaluated separately for men and for women. In men there is a meaningful proportion of individuals with QTc prolongation when delta wave is included in QT interval. In contrast the proportion is markedly reduced by either equation 5 or 6. QTc BZT, however, had a disproportionate higher prevalence of QT prolongation. The next highest was QTcFRD while QTc RBK and QTc FRM were similar. For women, the results were similar except QTc BZT was associated with a markedly higher proportion of QT prolongation.
Discussion
This study is the first, to our knowledge, to examine in detail the relationship of the delta wave in patients with pre-excitation with respect to its contribution to QT interval measurement and propose a method to more precisely calculate the QT interval in pre-excitation. We evaluated individuals with intermittent pre-excitation and utilized a number of different approaches to adjust the QT intervals in pre-excitation to identify the 'true' QT interval in the absence of pre-excitation. We developed a new approach to QT assessment and constructed formulae that best approximated the non-preexcited QT interval in the same person in the absence of pre-excitation.
This study highlights the error in QT assessment that would ensue from calculating the QT interval in the presence of pre-excitation. The delta wave contributes meaningfully to the QT interval as the QT interval was significantly longer in pre-excitation compared to complexes with a normal QRS, in cases of intermittent pre-excitation on the same ECG within seconds of normal and pre-excitation.
In general, one formula (Equation 6) had the highest correlations between QTwpw and the non-preexcited QT interval. It required the use of two constants derived from the liner relationship between QRS duration of the WPW complex and the delta wave. It is of a similar form which was found to be successful in adjusting for the increased QRS duration in LBBB [13]. A second formula, (Equation 4) was analogous to a formulation by Bogossian, et al. to correct the QT interval in LBBB [1], also showed a significant, stronger correlation with QT interval in the absence of pre-excitation. A third formula (Equation 5) was similar to Equation 4, but used the delta wave instead of the difference between QTwpw and QTi. This modification was also significantly correlated with QT in the absence compared to the presence of pre-excitation. However, between these two corrections, there was significant difference that was dependent on which heart rate correction factor used. With QTc RBK and QTcFRM, Equation 4 was more significantly correlated with QTi than Equation 5 and vice versa with QTcBZT and QTcFRD. Despite the inconsistent differences among Equation 4 and 5, neither of them was significantly different from Equation 6. From our analysis, it is clear that three formulae best approximated QT in the absence of pre-excitation when measuring the QT in the presence of pre-excitation. However, in real-world application, QT in the absence of pre-excitation is infrequently present. Furthermore, in that circumstance, there would be no need for the calculation of the QT interval from the pre-excitation complex. For this reason, an equation which requires a QT in the absence of pre-excitation in its calculation is not practical. Although one could theoretically use the equation, calculation of its QT value also varies depending on which heart rate correction factor used. Thus, either of two formulae (Equations 5 and 6) are better suited for approximating the 'true' QT interval in patients with pre-excitation. Importantly, the average QT values calculated in these formulae do not depend on which heart rate correction factor is chosen, making for easier use. Thus, we propose the use of either of the two formulae: QT = QTwpw - 0.307 × QRSwpw or QT = QTwpw - 0.462(QRSwpw) + 18.26.
Other approaches (Equations 1, 2, 3, and 7) all proved to be no more effective than QT in the presence of pre-excitation at approximating the QT interval in the absence of pre-excitation. The latter three equations had identical relationships as QT in pre-excitation compared to no pre-excitation, which is not unexpected as each of these modifications multiply and/or add the QT interval in pre-excitation by a coefficient.
We tested the proposed formulae in a separate large population of patients with pre-excitation which served in part as a separate validation group. Considering a group of 100 individuals with pre-excitation and stratifying then according to sex, which influences the QT interval [17], we found that QT interval prolongation is uncommon in pre-excitation. This finding reinforces the concept that an error in QT assessment would ensue from simple measurement of the QT interval in the presence of pre-excitation. Heart rate correction formulae are essential in QT interval assessment. We found that the Bazett heart rate correction formula results in an unrealistically high prevalence of prolonged QT in both men and women with pre-excitation. This study reaffirms previous studies but now in patients with pre-excitation, that the Bazett heart rate correction factor does not completely adjust for the impact of heart rate on the QT interval [17,19,20]. Even after the adjustment for the contribution of the delta wave to QT interval, the Bazett heart rate adjustment formula leads to an inaccurate assessment of the QT interval. The prevalence of prolonged QT interval with the Bazett formula is inconsistent with other formulae and would lead to conclusions of an unreasonably high prevalence of QT prolongation in pre-excitation.
This inconsistency found with using the Bazett formula was not found in the same magnitude as the other correction factors. However, the Fridericia formula also showed a disproportionately higher prevalence of QT prolongation. This was not found when using either the Spline or Framingham correction factor, which is likely due to the fact that these formulae have less of a dependence on heart rate.
Previous studies have suggested that the JT interval maybe useful in assessing the QT interval phase of the ECG in WPW because it is independent of the influence of pre-excitation [5,6]. Although our results show that there is a significant correlation between JTin pre-excitation compared to no pre-excitation, the relationship was not significantly different than that of QTwpw vs. QTi. Additionally, there is not a large body of literature on normal distribution of the JT interval in WPW to define abnormal limits and the correlation with potentially fatal arrhythmias. Furthermore, the JT interval has a strong correlation with heart rate that has been demonstrated with pacing-induced changes in heart rate [7]. Using the analogy to LBBB which also artifactually increases the QT interval, JT adjustments are strongly correlated to heart rate [8].
Limitations
There are several limitations of the study that warrant discussion. First, our study of intermittent pre-excitation within seconds has a small sample size, which is understandable given the rarity of individuals with intermittent pre-excitation as the records of over 15-years were required to find this group of spontaneous intermittent pre-excitation cases on a single ECG. Second, the developed formulae were applied to the sample from which they were derived. Ideally, these formulae would be applied to other patient populations that have a larger sample size with intermittent WPW, but we did not identify a large enough population to meaningfully divide into two groups. Third it is possible that patients with intermittent pre-excitation are not necessarily reflective of the total population of patients with pre-excitation. There should be caution about the generalization of our data. Fourth, we made the assumption that the patient's non-preexcited QT was the "gold standard" to which we compared our formulae. Fifth, although the widened QRS complex clearly contributes to the extending the QT interval, there could be inherent repolarization changes that are affected by pre-excitation. However, measurement to other aspects of repolarization such as the peak of the T wave to the end of the T wave are problematic in pre-excitation as the condition may be associated with T wave changes. Lastly, while some investigators might argue that it is more important to study the electrophysiology in each patient with pre-excitation, rather than calculating the QTc, such an opinion does not consider that most patients with pre-excitation do not undergo electrophysiologic study with ablation of the pathway and these individuals may require medications that could prolong their QT interval so that assessment of their QTc is vitally important.
Conclusion
Evaluating the QT interval in patients with pre-excitation can pose challenges because of the widened QRS complex produced by the delta wave. We formulated new approaches that are good estimates of the non-preexcited QT interval in patients with intermittent pre-excitation and propose two relatively convenient correction formulae (QT = QTwpw - 0.307 × QRSwpw and QT = QTwpw - 0.462(QRSwpw) + 18.26). In contrast, the JT interval was found to be no more effective than the using the QT interval of patients with pre-excitation. Both equations demonstrated less QT prolongation in a large group of individuals with pre-excitation with all heart rate correction formulae excluding the Bazett correction formula, likely due to its dependency on heart rate.
Acknowledgements
There are no conflicts of interest in this work. This research did not receive any specific grant from funding agencies in the public, commercial, or not-for-profit sectors.
References
- Arruda MS, McClelland JH, Wang X, et al. (1998) Development and validation of an ECG algorithm for identifying accessory pathway ablation site in Wolff-Parkinson-White syndrome. J Cardiovasc Electrophysiol 9: 2-12.
- Gallagher JJ, Svenson RH, Sealy WC, et al. (1976). The Wolff-Parkinson-White syndrome and the preexcitation dysrhythmias. Medical and surgical management. Med Clin North 60: 101-123.
- Zhang Y, Post WS, Blasco-Colmenares E, et al. (2011) Electrocardiographic QT interval and mortality: A meta-analysis. Epidemiology 22: 660-670.
- Poluzzi E, Raschi E, Koci A, et al. (2013) Antipsychotics and torsadogenic risk: Signals emerging from the US FDA Adverse Event Reporting System database. Drug Saf 36: 467-479.
- Ducceschi V, Sarubbi B, Briglia N, et al. (1996) Increased dispersion of ventricular recovery time as a new repolarization abnormality in the Wolff-Parkinson-White syndrome. International Journal of Cardiology 56: 269-273.
- Salim MA, Case CL, Gillette PC (1995) The JT interval as a depolarization independent measurement of repolarization: Lessons from catheter ablation of the Wolff-Parkinson-White syndrome. Pacing Clin Electrophysiol 18: 2158-2162.
- Nouraei H, Bennett MT, Rabkin SW (2018) Value of the new spline QTc formula in adjusting for pacing-induced changes in heart rate. Cardiol Res Pract.
- Rautaharju PM, Zhang Z-M, Prineas R, et al. (2004) Assessment of prolonged QT and JT intervals in ventricular conduction defects. Am J Cardiol 93: 1017-1021.
- Klein GJ, Gulamhusein SS (1983) Intermittent preexcitation in the Wolff-Parkinson-white syndrome. Am J Cardiol 52: 292-296.
- Krahn AD, Manfreda J, Tate RB, et al. (1992) The natural history of electrocardiographic preexcitation in men. The Manitoba Follow-up Study. Ann Intern Med 116: 456-460.
- Bogossian H, Frommeyer G, Ninios I, et al. (2014) New formula for evaluation of the QT interval in patients with left bundle branch block. Hear Rhythm 11: 2273-2277.
- Tang JKK, Rabkin SW (2019) Determination of the QT interval in left bundle branch block: Development of a novel formula. Can J Cardiol 7: 855-865.
- Wang B, Zhang LI, Cong P, et al. (2017) A new formula for estimating the true QT interval in left bundle branch block. J Cardiovasc Electrophysiol 28: 684-689.
- Bazett HC (1920) An analysis of the time-relations of electrocardiograms. Heart 7: 353-570.
- Fridericia L (1920) Die sytolendauer in elektrokardiogramm bei normalen menschen und bei herzkranken. Acta Med Scand 53: 469-486.
- Sagie A, Larson MG, Goldberg RJ, et al. (1992) An improved method for adjusting the QT interval for heart rate (the Framingham Heart Study). Am J Cardiol 70: 797-7801.
- Rabkin SW, Szefer E, Thompson DJS (2017) A new QT interval correction formulae to adjust for increases in heart rate. J Am Coll Cardiol Clin EP 3: 756-766.
- Rabkin SW, Cheng XB (2015) Nomenclature, categorization and usage of Formulae to Adjust QT interval for Heart Rate. World J Cardiol 7: 315-325.
- Vandenberk B, Vandael E, Robyns T, et al. (2016) Which QT correction formulae to use for QT monitoring? J Am Heart Assoc 5: e003264.
- Karjalainen J, Viitasalo M, Manttari M, et al. (1994) Relation between QT intervals and heart rates from 40 to 120 beats/min in rest electrocardiograms of men and a simple method to adjust QT interval values. J Am Coll Cardiol 23: 1547-1553.
Corresponding Author
Simon W Rabkin, MD, FRCPC, FCCS, FESC, FACC, Division of Cardiology, University of British Columbia, 9th Floor 2775 Laurel St.Vancouver, B.C., V5Z 1M9, Canada, Tel: 604-875-5847, Fax: 604-875-5849.
Copyright
© 2021 Kandiah JW, et al. This is an open-access article distributed under the terms of the Creative Commons Attribution License, which permits unrestricted use, distribution, and reproduction in any medium, provided the original author and source are credited.