Critical Weather Ranges Supporting COVID-19 Infections
Abstract
Purpose
Cold and temperate weather is known to support the COVID-19 outbreak. Study of the weather ranges in European countries, where the infection has a history of spreading rapidly, can be immensely beneficial for projecting the trends of the pandemic in the upcoming months in different countries which will experience similar weather conditions.
Methods
We collected weather data of all European countries on a daily basis during Jan 01, 2020 and Apr 19, 2020, and the corresponding data on infected and recovered cases. The distribution of cases was analyzed across the different ranges of absolute humidity (AH), which is a cumulative measure of temperature and relative humidity, and was found to be a good weather parameter for prediction of the spread in earlier studies.
Results
The spread of COVID-19 in Europe was significant during the study duration before the sharp decline in end of Apr, 2020. During this time, as the cases increased beyond 10,000, a majority of them were in countries experiencing AH of 3-9 g/m3, similar to worldwide observations. The cases which were in the AH range of 4-5 g/m3 were also observed to have high recovery rates in Apr, 2020. Both the spread and recovery trends were independent of the study duration.
Conclusion
The study helped confirm risky weather ranges of 3-9 g/m3 observed worldwide, in European countries. The results agree with the rise and fall trends of the spread in Europe until Apr, 2020. Also, some weather ranges with high recoveries were observed. This information cumulatively will help classify vulnerable regions around the world, where weather may possibly support the COVID-19 spread.
Keywords
COVID-19, Weather, Coronavirus, Infection, Spread
Introduction
The devastating coronavirus pandemic has led to 5.5 million cases of infections and 345,000 deaths worldwide, as of May 25, 2020 [1]. With its advent in Wuhan, China, the disease has spread massively in Europe and the UK, affecting over 1.9 million people in this region. Besides a steady rise in the number of cases, the recoveries have also been high in several of these countries [1]. In the meantime, the spread has been confirmed widely in other non-European countries such as the US, Russia, Brazil, and India. Among these countries, the US is the worst affected, with over 1.6 million cases and 99,000 deaths reported to date. In all other countries, more than 100,000 cases have been reported already, with a minimum rate of increase of over 7000 cases/day. This critical situation warrants the study of trends about the outbreak to minimize the spread and maximize the recovery in the near future.
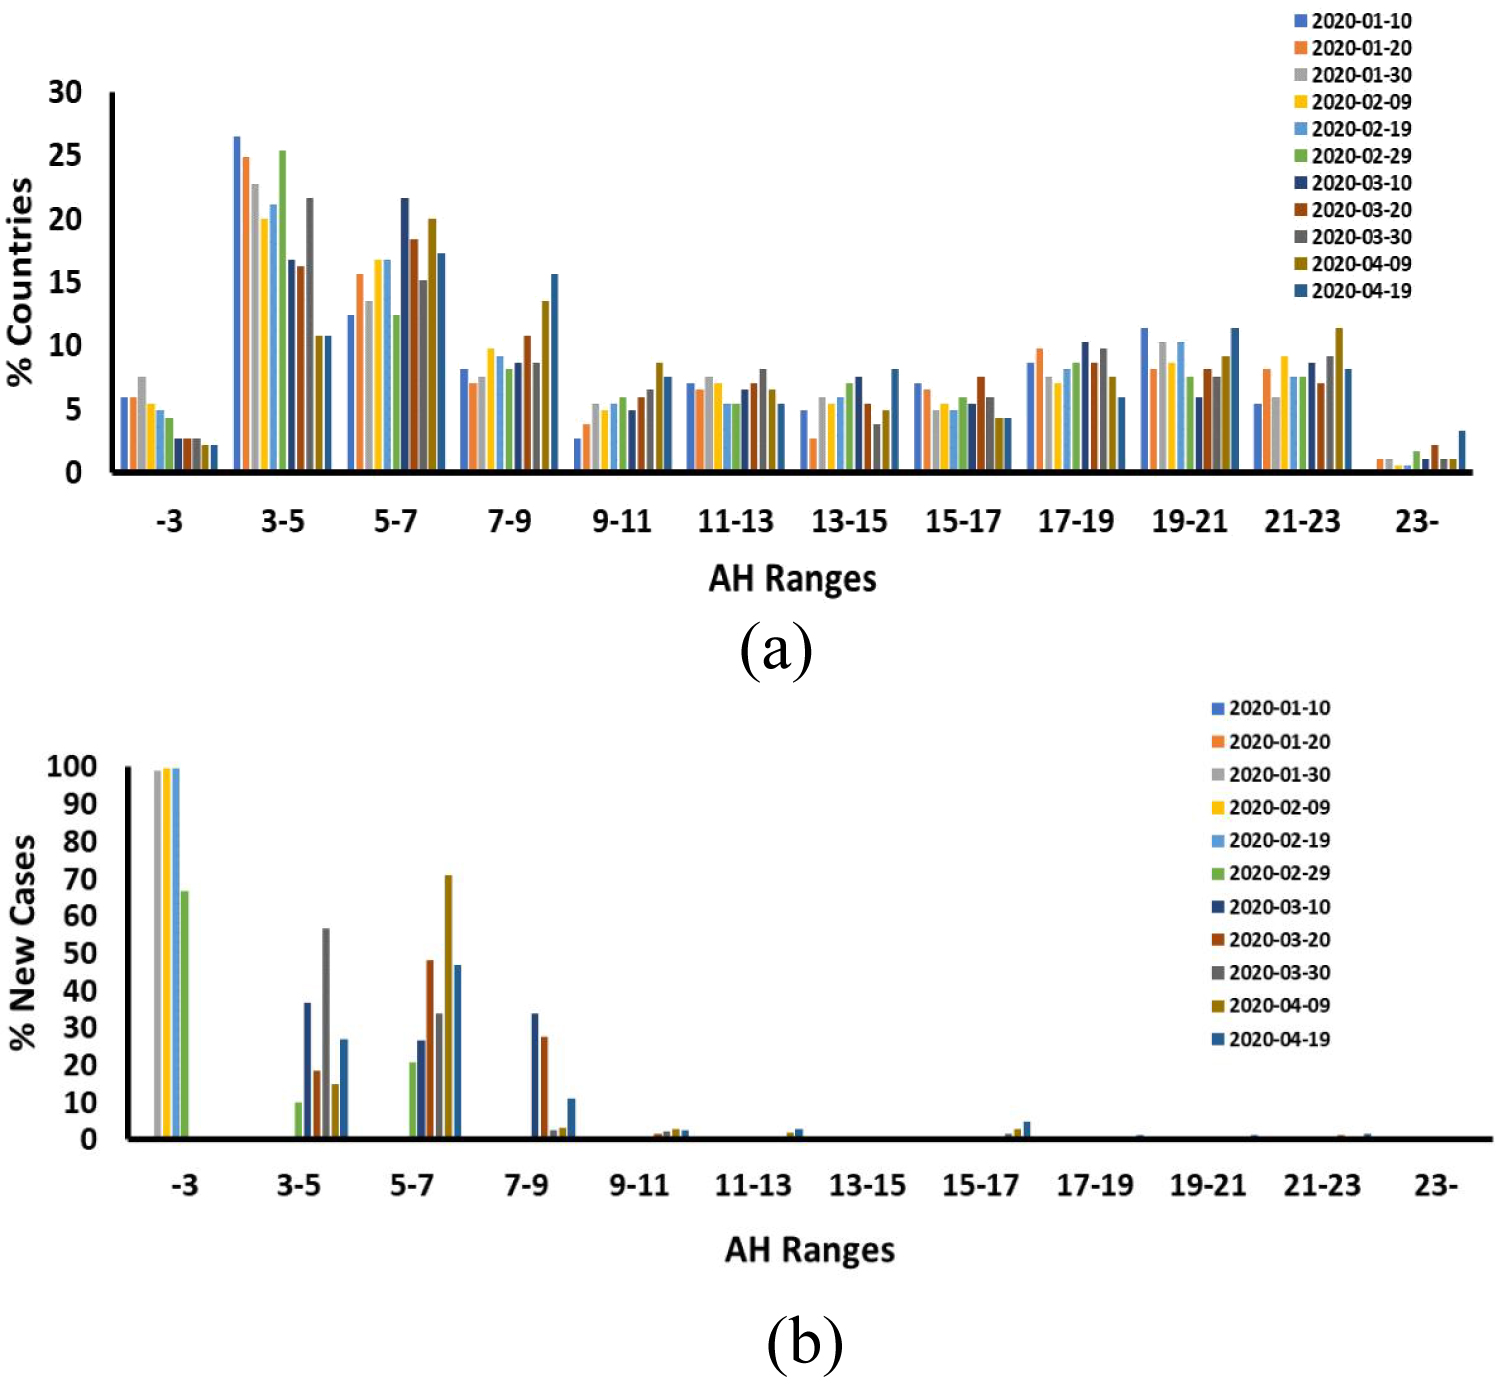
Recently, the influence of weather on the spread of coronavirus has been investigated in several affected countries. It has been claimed that the spread is supported more by cold and temperate weather, similar to MERS, SARS, and seasonal flu [2]. In one of the first global studies, the spread was found to be high in all countries lying in between specific latitudes (i.e.,30-50° N), and with temperature and relative humidity of 8 ± 3 °C and 63 ± 16% respectively [3]. In another study of worldwide trends, absolute humidity (AH) was found to be better correlated with the spread, over temperature [4]. A significant number of cases were found to be reported in countries with AH lying in between 3 g/m3 and 9 g/m3. Figure 1A shows the percentage distribution of 188 countries across the different AH ranges in the 10 day blocks during Jan 01-Apr 19, 2020. Figure 1B shows the percentage distribution of new cases of all these 188 countries across the different AH ranges in the 10 day blocks during the study duration. A majority of new cases were reported in countries experiencing AH in the range of 3-9 g/m3. Studies in Jakarta, Indonesia [5], China [6], Iran [7], and New York, USA [8], were consistent with the finding of the low correlation (i.e., R2 < 0.5) between temperature and the spread. A detailed study on all US states confirmed the worldwide findings and reported that the states which experienced AH between 4 g/m3 and 9 g/m3 had over 50% of the reported cases [9]. It was mentioned though that for very low number of cases, the observed AH range did not correlate at all with the spread.
A limited number of studies have looked at the effect of weather on European countries. A recent study on Turkey found moderate correlation of wind speed and population with the spread [10]. AH was not considered as a part of the analysis. Another study on Spain [11], investigated the effect of temperature across all provinces. From the spatio-temporal analysis, no correlation was found between temperature and the disease spread. To date, no study has specifically looked at the correlation of AH and the disease spread in Europe, which in light of the findings from non-European countries [5-9], may suggest valuable trends and potentially similar vulnerable ranges of weather parameters.
In this work, we studied the weather based distribution of coronavirus infection cases in Europe. Specific weather ranges were identified in which majority of the infected cases developed. Also, recoveries were studied in such weather ranges. Our findings will be valuable for policymakers in countries with rapidly increasing spread and minimal recovery, such as the US.
Methods
Data on weather parameters
Weather parameters such as Relative Humidity in % and Temperature in °C were collected from Jan 01, 2020 to Apr 19, 2020, on a daily basis, for 188 countries including all European countries, using the database of [12]. Clausius Clapeyron equation described in [4,9,13] was used to estimate absolute humidity or AH (g/m3) from temperature and relative humidity data. Mean and standard deviation of AH were quantified for all countries for every consecutive 10 day blocks starting Jan 01, 2020 until Apr 19, 2020, for analysis.
New and recovered cases of COVID-19
The data on number of new and recovered cases were collected daily from the Centre for Systems Science and Engineering (CSSE) repository, John Hopkins University [14] from Jan 01, 2020 to Apr 19, 2020. The country specific total new and recovered cases were extracted for consecutive 10 day blocks in this time period.
Data analysis
The new and recovered cases in each country were statistically distributed across the different single point ranges of absolute humidity (i.e., starting at < 3 g/m3 up to > 9 g/m3) for all consecutive 10 day blocks. Such ranges were chosen specifically based on similar studies on modeling worldwide weather based spread [4,9]. To further understand country wise trends, mean and standard deviation of AH were reported and compared with reported new cases and percentage recovery.
Results
Distribution of new cases across absolute humidity (AH) ranges
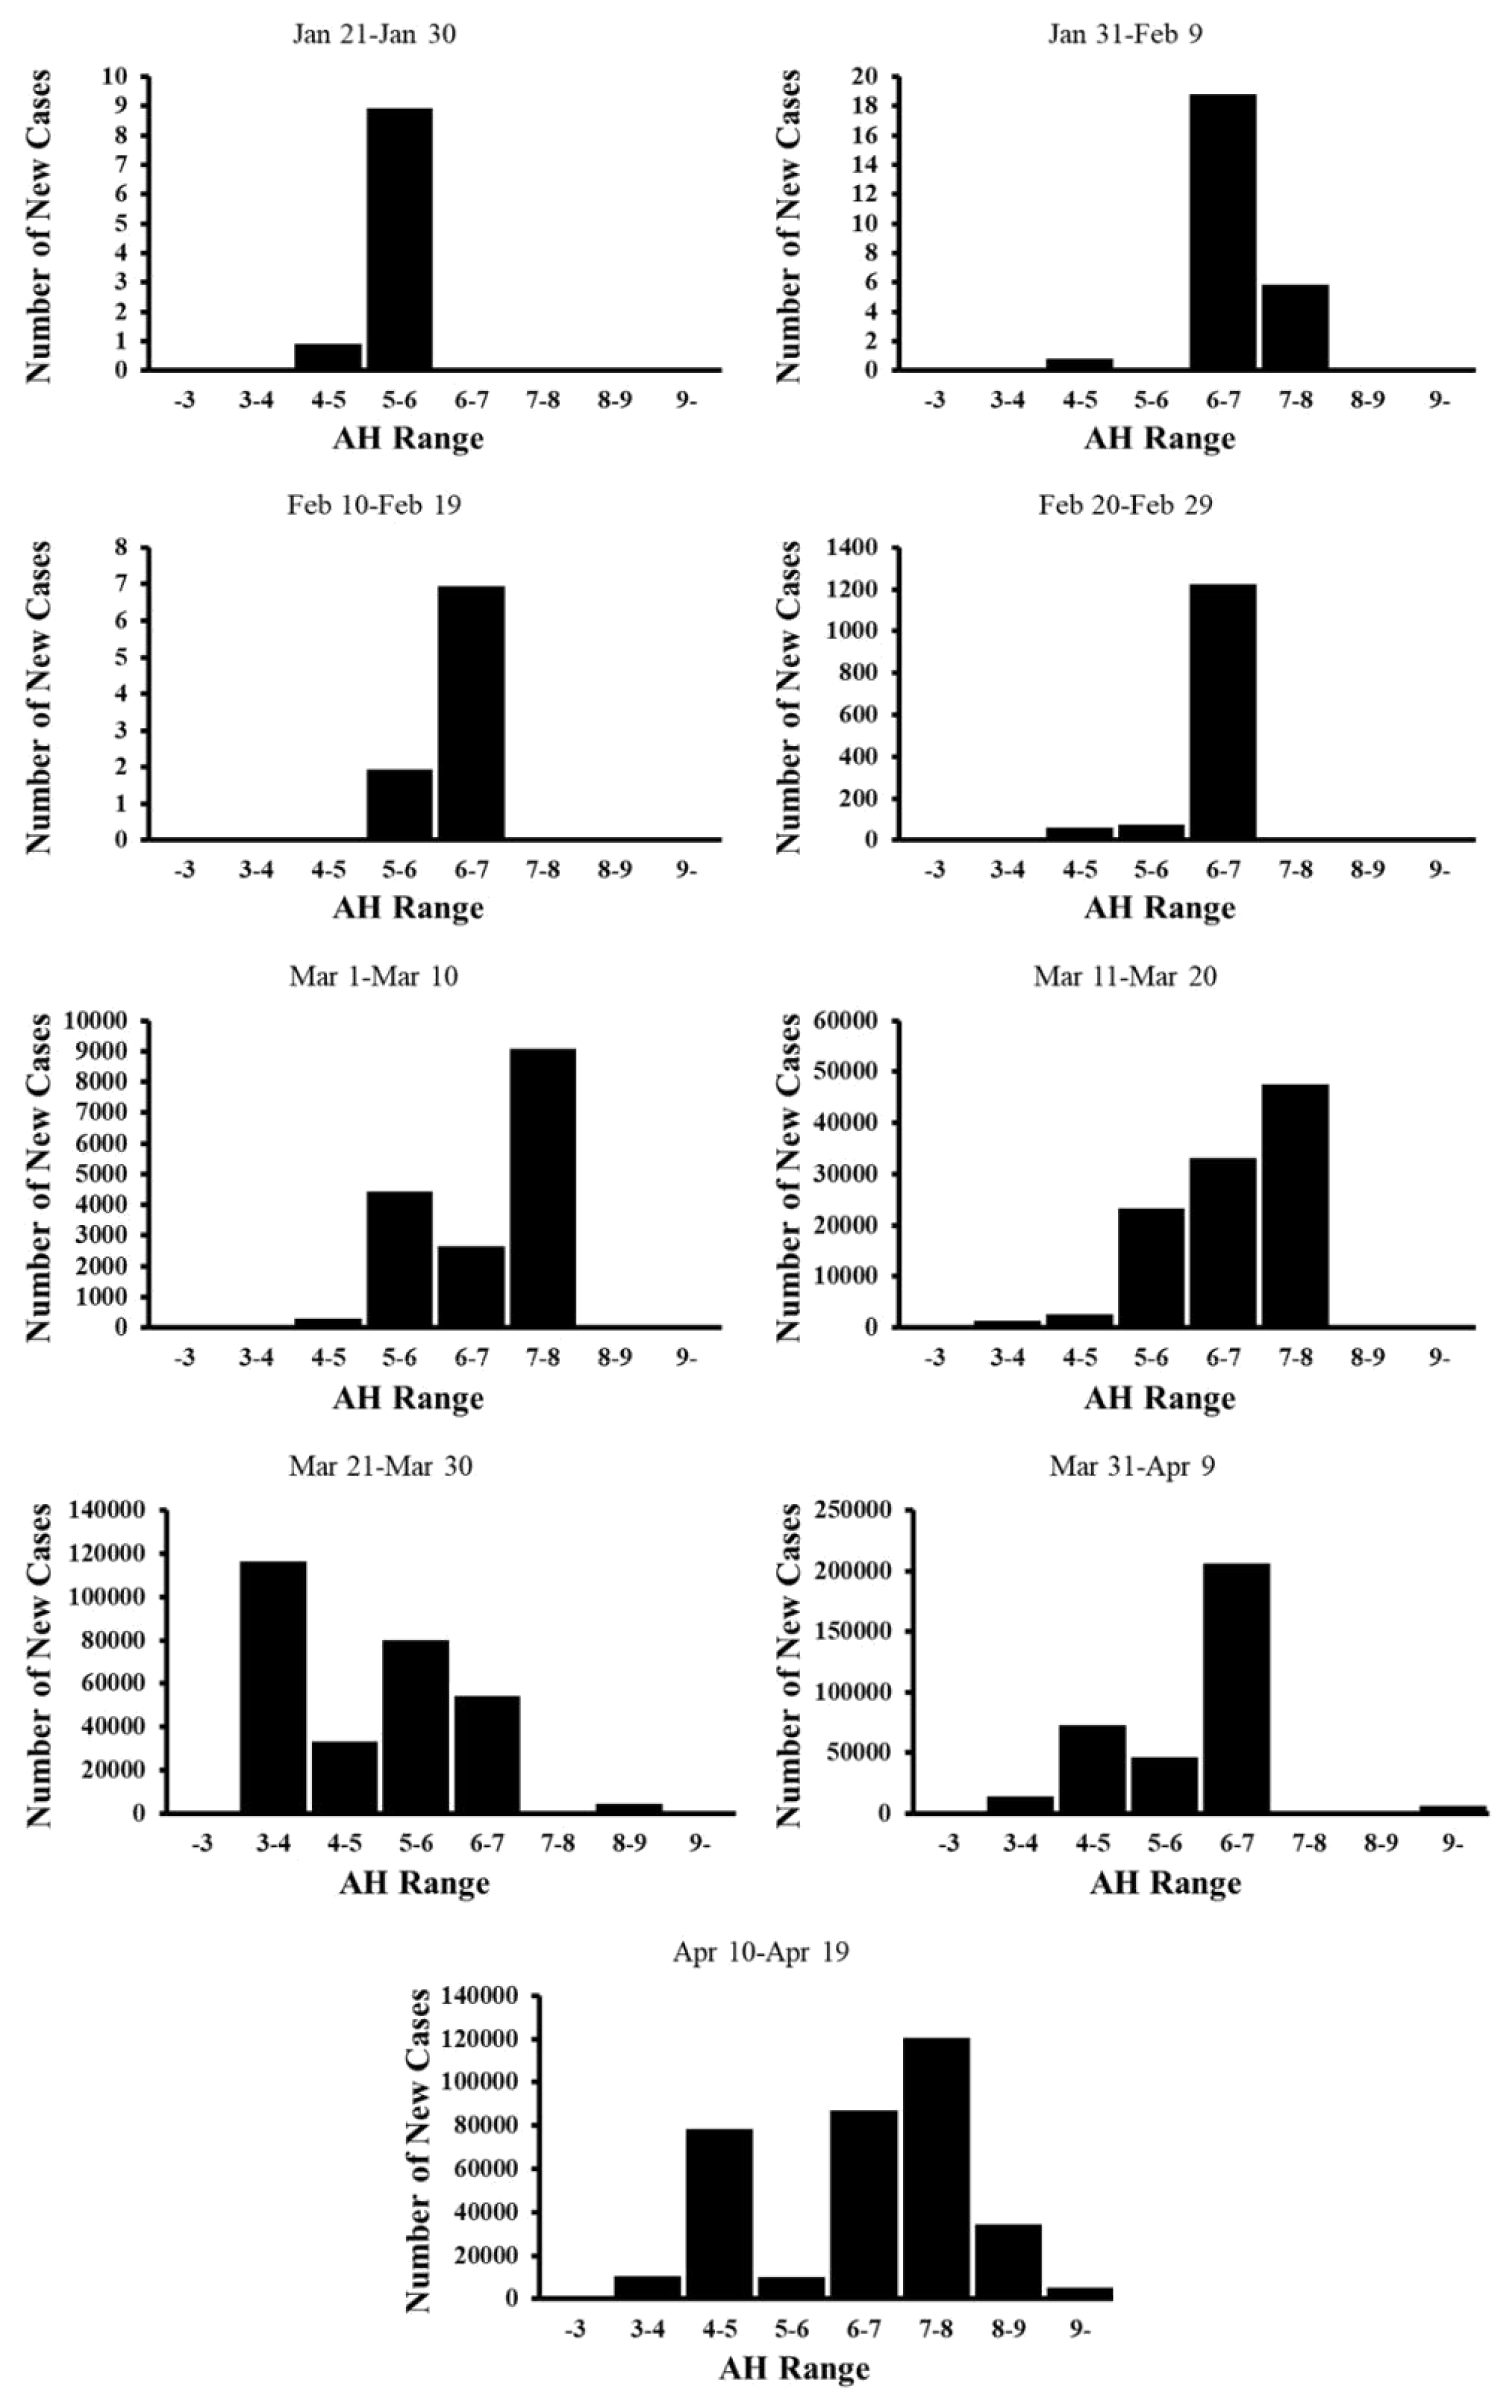
No cases were reported across any of the European countries until Jan 20, 2020. During Jan 21-Jan 30, 2020, only 10 cases were reported in total, 9 out of which were in the countries lying in AH range of 5-6 g/m3 (Figure 2). 26 new cases were reported during Jan 31-Feb 09, 2020, out of which 19 cases were in countries experiencing AH in the range of 6-7 g/m3, 6 in AH range of 7-8 g/m3, and 1 was in AH range of 4-5 g/m3. Feb 10-Feb 19, 2020 was a 10 day block with just 9 cases in countries lying in 5-7 g/m3 range of AH. The new cases started rising rapidly during Feb 20-Feb 29, 2020, majorly in the countries lying in AH range of 5-6 g/m3 (representing 87% of the total new cases). The total new cases went up to 16,936 between Mar 1, 2020 and Mar 10, 2020 with 99% occurrences lying in 3-9 g/m3 range of AH. During Mar 11-Mar 20, 2020, the total new cases increased exponentially from 16,936 in the last 10 day block to 111,360 (i.e., approximately 6 times). Out of so many cases, over 99% lied in countries experiencing 3-9 g/m3 range of AH again. Cases reported more than doubled during Mar 21-Mar 30, 2020. A high number of these cases (i.e., 40%) were reported in countries with 3-4 g/m3 range of AH. Including this skew, 99% cases were in countries lying in 3-9 g/m3 range of AH. It should be mentioned that in this week, most of the countries were observed to move to a lower AH range by approximately 1 point due to regional cold weather, which might account for the skew. In between Mar 31, 2020 and Apr 9, 2020, 356,932 cases were reported, out of which, approximately 98% cases were in countries experiencing 3-9 g/m3 range of AH. In most recent 10 day block, Apr 10-Apr 19, 2020, total new cases were similar in number to that in the previous 10 day block. Out of these, over 98% of the cases were in countries with 3-9 g/m3 range of AH again. The percentage spread in countries with AH ranges of < 3 g/m3and > 9 g/m3were less than 2% for all 10 day blocks. Also, it was observed that the majority of new cases consistently lied in countries with 3-9 g/m3 AH and with over 10,000 cases per 10 day block.
Distribution of recovered cases across absolute humidity (AH) ranges
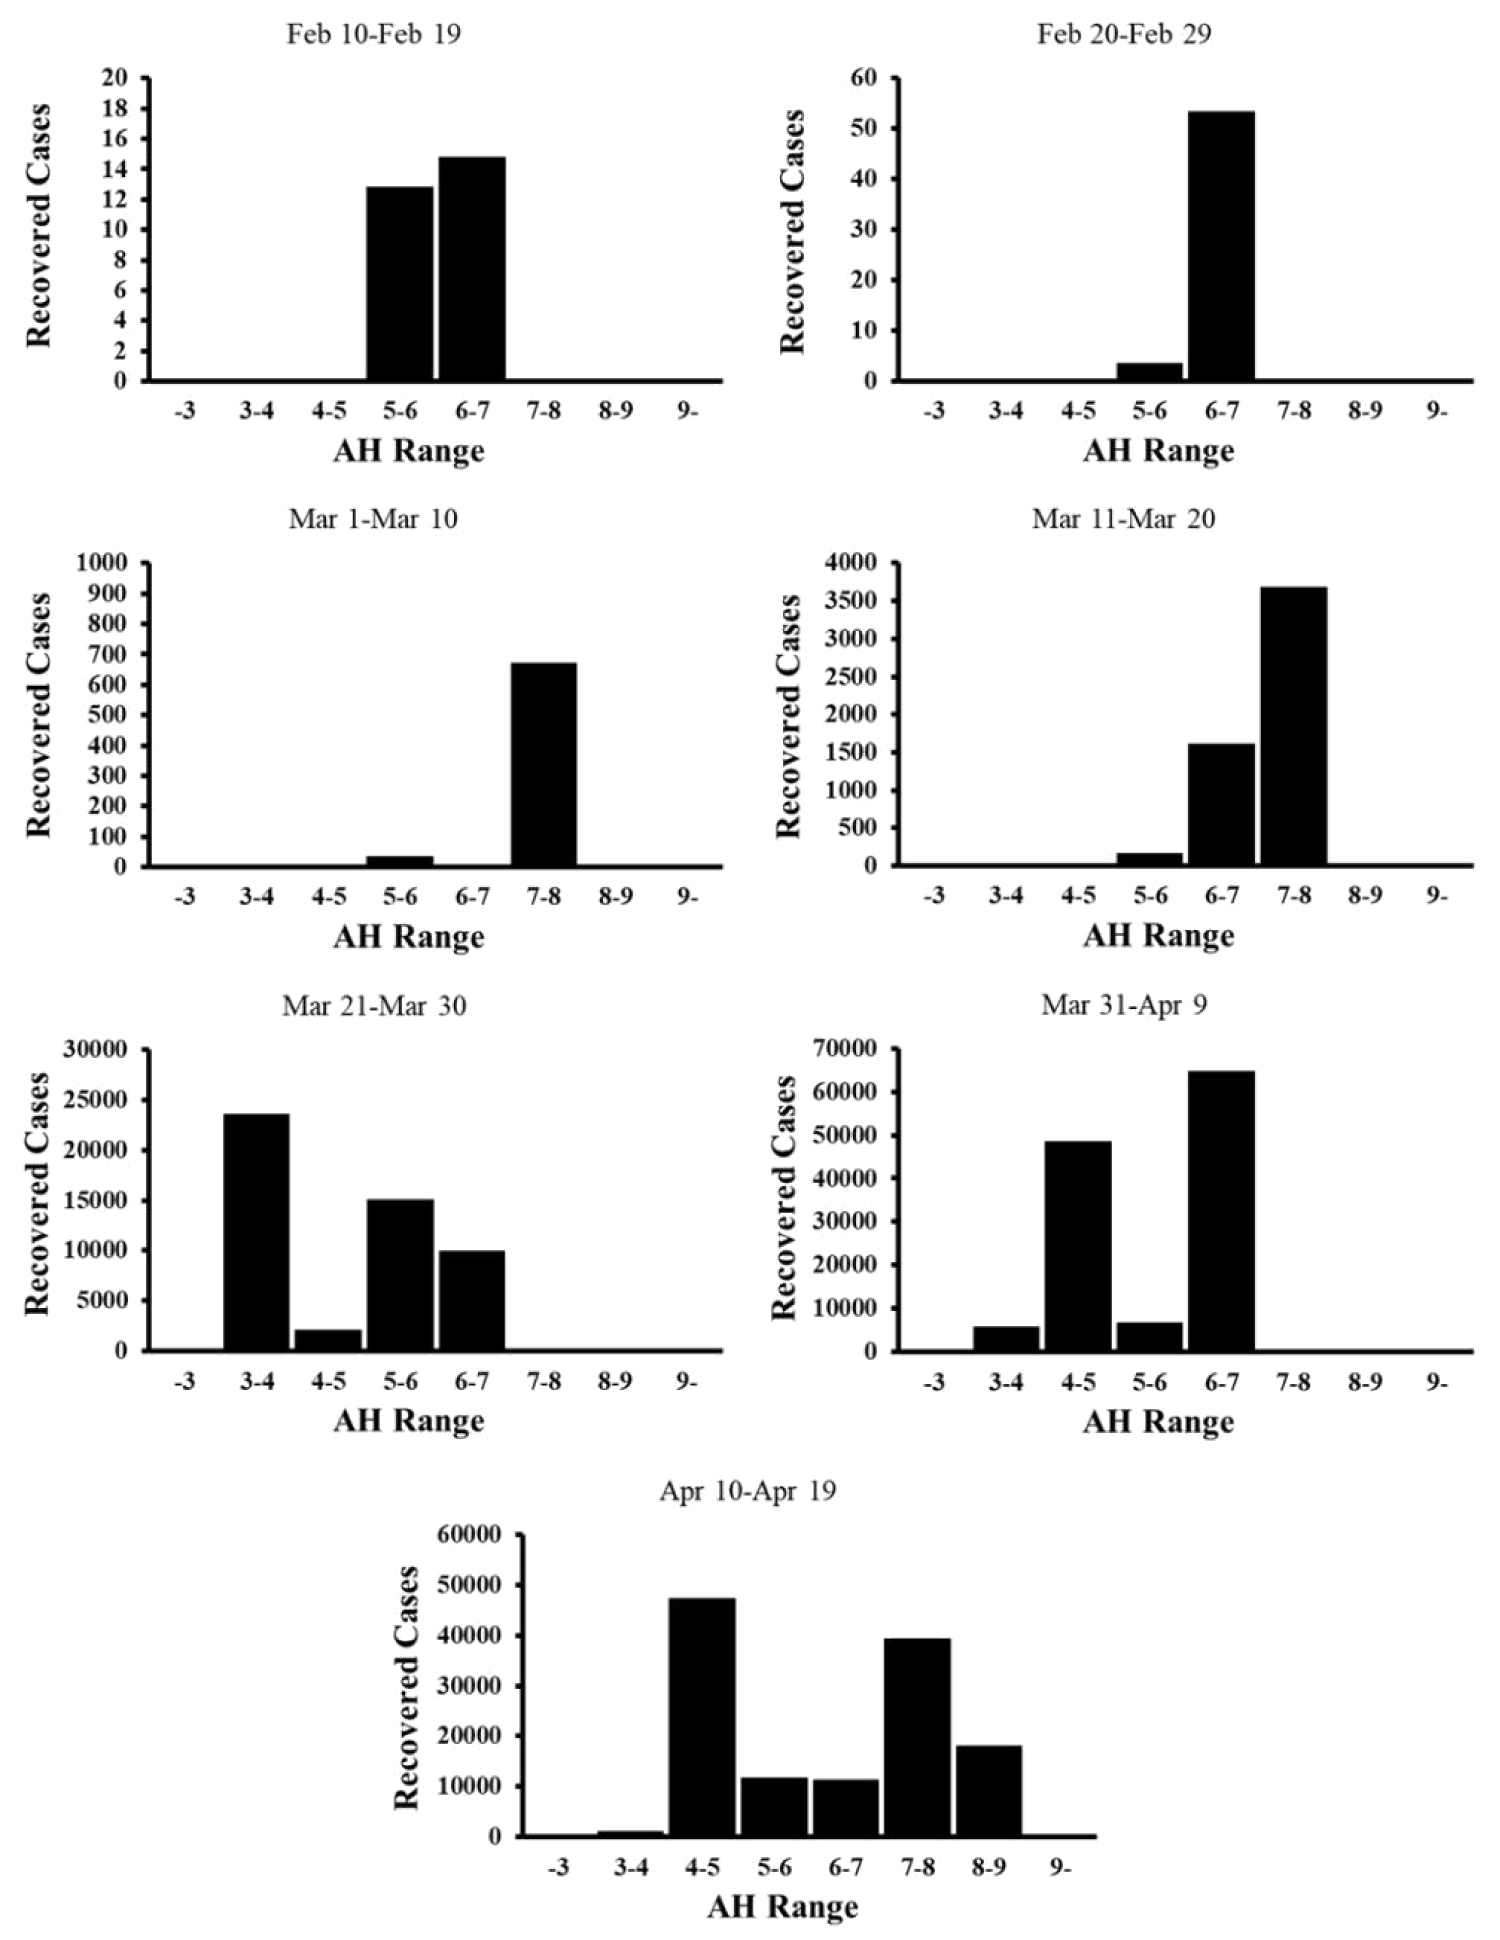
Recovery across European countries started during Feb 10-Feb 19, 2020 (Figure 3). 28 recoveries were reported during this time in countries lying in AH range of 5-7 g/m3. During Feb 20-Feb 29, 2020, 58 recoveries were observed, with all of them still in countries experiencing AH in the range of 5-7 g/m3. The recoveries increased to 5616 from 739 during Mar 11-Mar 20, 2020 with over 99% of them in the countries with AH of 4-8 g/m3. The recoveries increased by approximately 9 times in between Mar 21, 2020 and Mar 30, 2020. 45% recoveries were in countries with 3-4 g/m3 AH and 54% in countries with 4-8 g/m3 AH. The skew towards a large number of cases for AH of 3-4 g/m3 can be explained by the regional cold wave during this 10 day block which lowered the AH of most countries by more than 1 point. During Mar 31-Apr 9, 128794 recoveries were reported, out of which 95% were in countries lying in AH range of 4-8 g/m3. Finally, in the recent 10 day block of Apr 10-Apr 19, 2020, 132801 recoveries were observed, with 84% of them lying again in countries with AH in the range of 4-8 g/m3.
Country wise weather based spread
The influence of weather on country wise spread was characterized during Apr 10-Apr 19, 2020 (Figure 4). Total of 354451 new cases were reported during this time. None of countries were in AH range of below 3 g/m3. Norway, Lithuania, Poland, Belarus, and Ukraine were in 3-4 g/m3 range of AH, which had about 3% of the total cases. The countries in 4-5 g/m3 range of AH were Sweden, Finland, Estonia, Latvia, Germany, Kosovo, and Moldova, together representing 22% cases. Countries in 5-6 g/m3 range of AH (i.e., Iceland, Czechia, Austria, Slovakia, Slovenia, Hungary, Croatia, Romania, Bulgaria, Bosnia and Herzegovina, Denmark, Liechtenstein, Armenia, Georgia) together represented only 3% cases. 25% cases were found to be in countries with 6-7 g/m3 AH, including the UK, Belgium, Netherlands, Switzerland, Luxembourg, Serbia, Montenegro, and North Macedonia, and San Marino. The highest 34% new cases were in Spain, France, Ireland, Greece, Azerbaijan, Albania, and Andorra, lying in AH range of 7-8 g/m3. 10% cases were observed to be in countries with 8-9 g/m3 AH, including Italy, Monaco, and Cyprus. Malta and Portugal lying in AH greater than 9 g/m3, shared 2% cases. There were no cases in the smallest country, Vatican City, with 8-9 g/m3 AH. Also, comparing findings for Apr 10-Apr 19, 2020 with that during Jan 01-Apr 19, 2020 (Table 1), 97% cases consistently lied in countries with 3-9 g/m3 AH.
Country wise weather based recovery
The total % recovered out of all cases during Jan 01, 2020 and Apr 19, 2020, were estimated across countries (Table 1). Also, the AH ranges experienced by these countries during this entire duration were analyzed to understand possible trends. Iceland and Austria with 16,651 total cases were found to be have 79.70% and 73.76% recovery. The mean AH range for these countries was very similar (i.e., 4-5 g/m3). The countries with over 50% recovery were Switzerland, Liechtenstein, Germany, Denmark, Azerbaijan, and Ireland, lying in AH range of 4-7 g/m3. The countries with lowest recovery (< 10%) were Ukraine, Portugal, Sweden, UK, Norway, and Netherlands, with no correlation with the AH ranges.
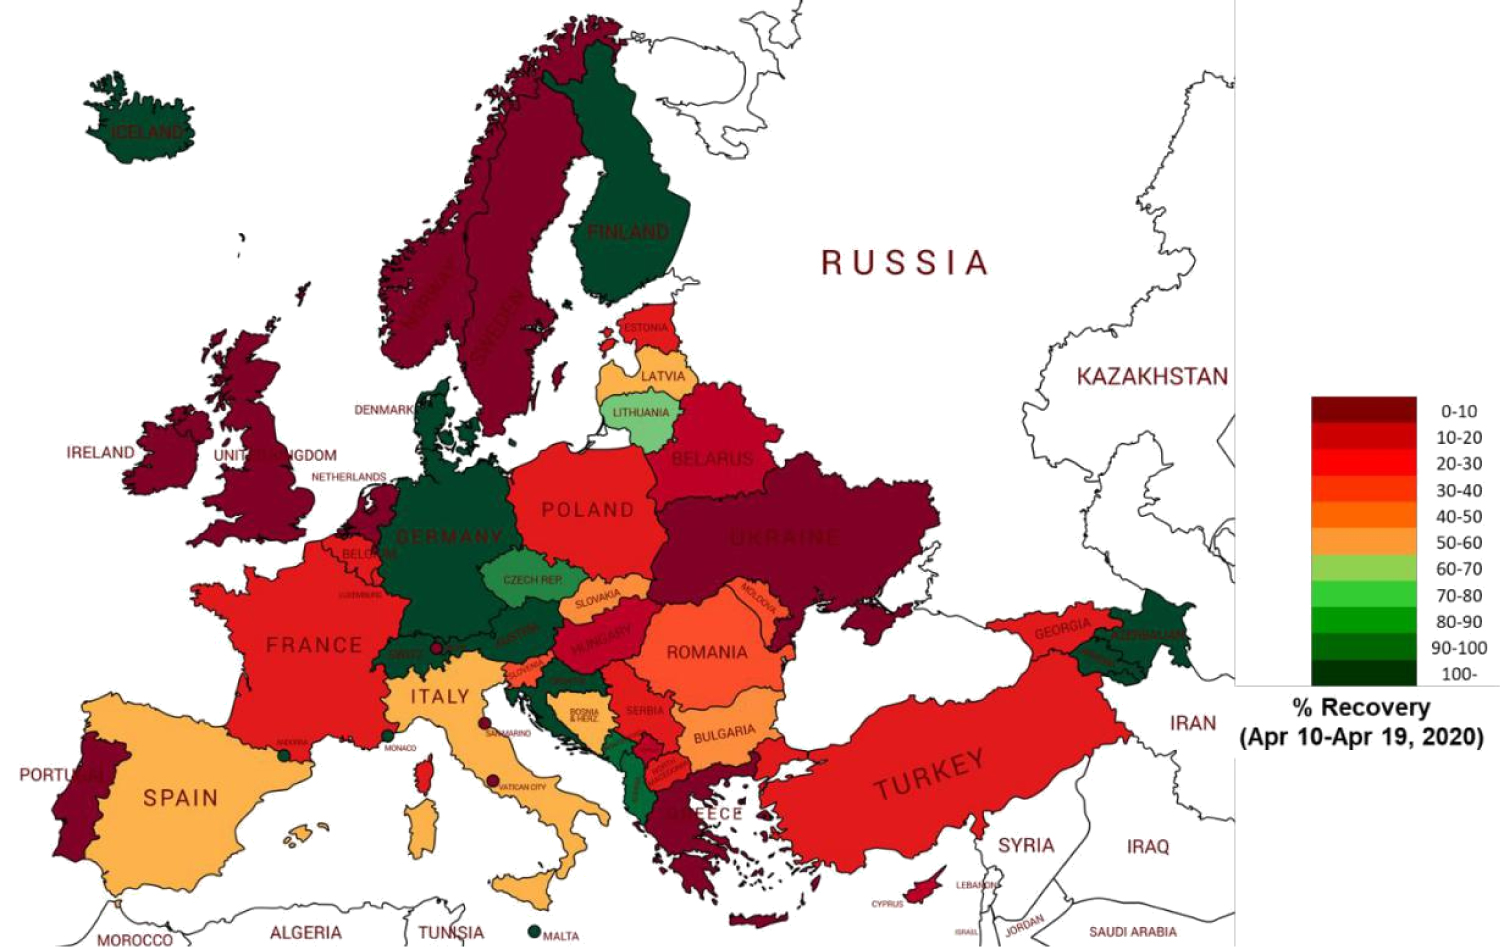
The % recovered cases were also tracked across the countries in the most recent 10 day block (i.e., Apr 10-Apr 19, 2020) as shown in (Figure 5). Above 100% recovery, meaning the number of recovered cases were higher than the number of new cases, were observed in Andorra, Armenia, Austria, Azerbaijan, Croatia, Denmark, Finland, Germany, Iceland, Malta, Monaco, and Switzerland. Except Malta and Monaco, which represented 100 out of 354451 new cases and 119 out of 132801 recovered cases reported in this 10 day block respectively, all these countries lied in 4-8 g/m3 range of AH. The other countries with high recovery percentage were Albania (97%), Montenegro (91%), Czechia (84%), and Lithuania (68%), which were all in AH range of 4-8 g/m3. The lowest recovery rates (< 10%) were found in Greece, Ireland, Liechtenstein, Netherlands, Norway, Portugal, San Marino, Sweden, Ukraine, and the UK, with no correlation with AH ranges.
Discussion
In this work, critical weather ranges were confirmed which support the coronavirus spread. For 10 day study blocks, if the total new cases were greater than 10,000, a majority of the infected cases were in countries with 3-9 g/m3 AH, consistent with worldwide observations. The recovery distribution was apparent for total recoveries of above 5000, for any 10 day block, with most of them lying in countries with AH in the range of 4-8 g/m3. Both these findings were consistent throughout Jan 01-Apr 19, 2020, and thus were independent of the study interval. These results are consistent with worldwide trends [3,4,9]. The percentage recovery between Jan 01-Apr 19, 2020, was the highest (> 70%) in countries with 4-5 g/m3 AH, moderate (50-70%) in countries with 4-7 g/m3 AH, and low (< 10%) in other countries. During Apr 10-Apr 19, 2020, there were above 100% recovery (meaning the number of recovered cases were higher than new cases) in countries with 4-8 g/m3 AH. The lowest recovery trends in this 10 day block were consistent with that observed through the entire study duration.
The trends of European cases distributed across 3-9 g/m3 range of AH in 10 day blocks, are very similar to worldwide [3,4] and US based [9] findings. [9] found the cases in the US states to be concentrated in a consistent 4-6 g/m3 range of AH, for the total cases in a study interval of greater than 10,000. Even though the consistent AH range identified for European countries is 3-9 g/m3, this trend was not apparent till the number of cases in a study block was above 10,000. In other studies by [3] and [4], the cases worldwide were majorly localized in countries with 3-9 g/m3 range of AH. Our findings are similar to these global observations.
The effect of recovery has been studied for the first time outside China. Our findings of majority recovery in countries lying in AH range of 4-5 g/m3 is to some extent similar with such observations across different cities in China [15]. Cumulatively considering the recovery trends while studying the weather based spread may throw light on the total and more realistic effect of weather on the infection spread.
There are a few limitations of this study. We only considered temperature, relative humidity, and absolute humidity among a wide range of different weather parameters studied around the world. The ranges for the absolute humidity were identified, in which majority of infections were reported, and compared with worldwide observations. Extrapolation of the findings beyond Europe without caution is not recommended. It should be clarified that impact of specific weather ranges on the spread is not causation and just an observation. Also, it should be mentioned that that there is no known numerical relationship between AH and COVID-19 cases to date. Only, the countries experiencing 3 g/m3 < AH < 9 g/m3 have consistently reported the majority of new cases. Therefore, even if two countries share similar AH, other factors such as population, healthcare measures, testing rates, social distancing [16], lockdowns and travel restrictions, may have played a role in the spread. In future, the integrative effect of such factors will be considered to better understand the dynamics of coronavirus transmission. An example is the comparison between countries with similar populations that applied similar social distancing measures, which may throw more light on the correlation between the AH and the spreading of COVID-19.
In conclusion, risky weather ranges were confirmed in European countries similar to worldwide observations, which supported the coronavirus spread till Apr, 2020. Some ranges of weather were also identified where the recoveries were significant. The results are cumulatively anticipated to help classify countries and regions based on weather, where the risks of spreading are high in the upcoming months.
Declaration of Interest
We declare that there are no conflicts of interest.
Acknowledgements
We did not receive any funding to conduct this study.
References
- Webmeter (2020) Coronavirus age, sex, demographics (COVID-19)-Worldomete.
- Kimberly Bloom Feshbach, Wladimir J Alonso, Vivek Charu, et al. (2013) Latitudinal variations in seasonal activity of influenza and respiratory syncytial virus (RSV): Aglobal comparative review. PLoS One 8: e54445.
- MM Sajadi, P Habibzadeh, A Vintzileos, et al. (2020) Temperature and latitude analysis to predict potential spread and seasonality for COVID-19. SSRN Electron J 18.
- Q Bukhari, Y Jameel (2020) Will coronavirus pandemic diminish by summer? SSRN Electron J 15.
- R Tosepu, Joko Gunawan, Devi Savitri Effendy, et al. (2020) Correlation between weather and Covid-19 pandemic in Jakarta, Indonesia. Sci Total Environ 725: 138436.
- B Oliveiros, L Caramelo, NC Ferreira, et al. (2020) Role of temperature and humidity in the modulation of the doubling time of COVID-19 cases. medRxiv.
- M Ahmadi, A Sharifi, S Dorosti, et al. (2020) Investigation of effective climatology parameters on COVID-19 outbreak in Iran. Sci Total Environ 729: 138705.
- MF Bashir, Benjiang Ma, Bilal, et al. (2020) Correlation between climate indicators and COVID-19 pandemic in New York, USA. Sci. Total Environ 728: 138835.
- S Gupta, G Singh, A Chanda (2020) Effect of weather on COVID-19 spread in the US: A prediction model for India in 2020. Sci Total Environ 728: 138860.
- M Şahin (2020) Impact of weather on COVID-19 pandemic in Turkey. Sci Total Environ 728: 138810.
- Álvaro Briz Redón, Ángel Serrano Aroca (2020) A spatio-temporal analysis for exploring the effect of temperature on COVID-19 early evolution in Spain. Sci Total Environ 728: 116544.
- National Oceanic and Atmospheric Administration (2019) Data Access | National Centers for Environmental Information (NCEI) formerly known as National Climatic Data Center (NCDC) Department of Commerce
- H Herrmann, H Bucksch (2014) Clausius-Clapeyron equation. in Dictionary Geotechnical Engineering/Wörterbuch GeoTechnik.
- Johns Hopkins Hospital and Medicine (2020) Coronavirus COVID-19 global cases by the center for systems science and engineering (CSSE) at johns hopkins university (JHU). Johns Hopkins University.
- Jingui Xie, Yongjian Zhu (2020) Association between ambient temperature and COVID-19 infection in 122 cities from China. Sci. Total Environ 724: 138201.
- GD Barmparis, GP Tsironis (2020) Estimating the infection horizon of COVID-19 in eight countries with a data-driven approach. Chaos, Solitons and Fractals 135: 109842.
Corresponding Author
Arnab Chanda, Assistant Professor, Centre for Biomedical Engineering, IIT Delhi; Department of Biomedical Engineering, AIIMS, Delhi, India, Tel: +918130089756
Copyright
© 2020 Chanda A, et al. This is an open-access article distributed under the terms of the Creative Commons Attribution License, which permits unrestricted use, distribution, and reproduction in any medium, provided the original author and source are credited.