Three-Dimensional Distribution and Public Health Interventions of COVID-19 in Sichuan Province, China
Abstract
Background
To analyze the epidemiological characteristics of all cases of COVID-19 in Sichuan Province until March 20, and summarize the public health interventions to give references.
Methods
The data of COVID-19 confirmed cases were collected from the official websites of Health Commission. Descriptive epidemiological methods were used to retrospectively analyze the epidemiological characteristics of all COVID-19 cases in Sichuan Province from January 21 to March 20, 2020.
Results
By 24:00 on March 20, 2020, there had been 542 confirmed COVID-19 cases in all 21 cities of Sichuan Province. Cases were concentrated in Chengdu (147 cases), Ganzi (78 cases) and Dazhou (42 cases), totally accounting for 49.3% of cases in the province. The inflection point of the epidemic was on January 30, 4 days earlier than that of non-Hubei areas in China. Among 181 confirmed cases, 56.9% were male. They were mainly in 15~64-years-old groups and the median age was 43-years-old. Before February 9, the confirmed cases were mainly imported cases in 13 cities in Sichuan.
Conclusions
The epidemic has been under control, indicating that public health interventions could inhibit the epidemic. At this stage, the province should guard against abroad imported cases.
Keywords
COVID-19, Distribution, Public Health Intervention, Confirmed Cases, Sichuan Province
Abbreviations
COVID-19: Coronavirus disease 2019
Introduction
Since December 2019, an outbreak of novel coronavirus pneumonia (NCP) has appeared in Wuhan, Hubei Province, China. The World Health Organization (WHO) named it as coronavirus disease 2019 (COVID-19) on February 11, 2020 [1]. With the spread of the epidemic, such cases have appeared in other regions of China and foreign countries, and the COVID-19 was declared outbreak a pandemic. As of March 19, China has reported no new local case for the first time, indicating that the public health interventions have achieved amazing results. Among them, Sichuan Province, as a province with a large population and labor export, China's "Southwest Gateway", as of March 20, reported a total of 542 confirmed cases (2 abroad imported cases), 3 deaths and 3 existing cases [2]. At present, there are few studies on epidemiology of COVID-19 in the province. Based on this, we analyzed the epidemiological characteristics of all COVID-19 cases as of March 20 and the public health interventions to sum up experience, with a view to serve as a standard reference for controlling COVID-19.
Materials and Methods
Data collection
The time series of observations of COVID-19 cases from January 21 to March 20, 2020 was obtained from the websites of National Health Commission of the People's Republic of China (http://www.nhc.gov.cn/) and Health Commission of Sichuan Province (http://wsjkw.sc.gov.cn). The information included the number of new confirmed cases, number of new cured patients and number of the new death.
The demographic sociological information of some cases was obtained from the websites of the municipal health commissions, and the information included the patient's age, gender, and contact history. The data on the number of permanent residents at the end of 2018 and natural population growth rate come from the "Sichuan Statistical Yearbook-2019".
Case definitions
The definitions of confirmed cases and clustered morbidity in this study came from the "Notice on the issuance of COVID-19 diagnosis and treatment plan (Pilot Version 7)" [3].
Methods
A descriptive epidemiological study was conducted to retrospectively analyze the collected surveillance data to describe the spatial, temporal and population distribution of COVID-19 in Sichuan province. Some previous studies regard the time corresponding to the peak of newly diagnosed people as the inflection point of the epidemic. However, this method is not suitable for the situation where there are peaks for several consecutive days, and the data fluctuation after the peak cannot be explained. Therefore, the actual data can be fitted into a smooth curve, so as to eliminate the influence of data noise, and find the change trend more objectively from the mathematical point of view. According to the characteristics of data fluctuation, we used one oscillation function (sum of sine function) to fit the curve, and computed the first order derivative to determine the largest-speed and peak of the curves for the number of cumulative confirmed cases and the number of confirmed cases, so as to objectively determine these inflection points.
Statistical analysis
Depending on the distribution of continuous variables, in normal distribution and M (Xmax,Xmin) in non normal distribution are used to describe the average level respectively. Analyses of the temporal, geographical and population distribution were performed with the use of stata 12.0. ArcGis10.2 was used for map production, and MATLAB_R2018b was used for curve fitting and first order derivative calculation.
Results
The basic situation and trend of COVID-19
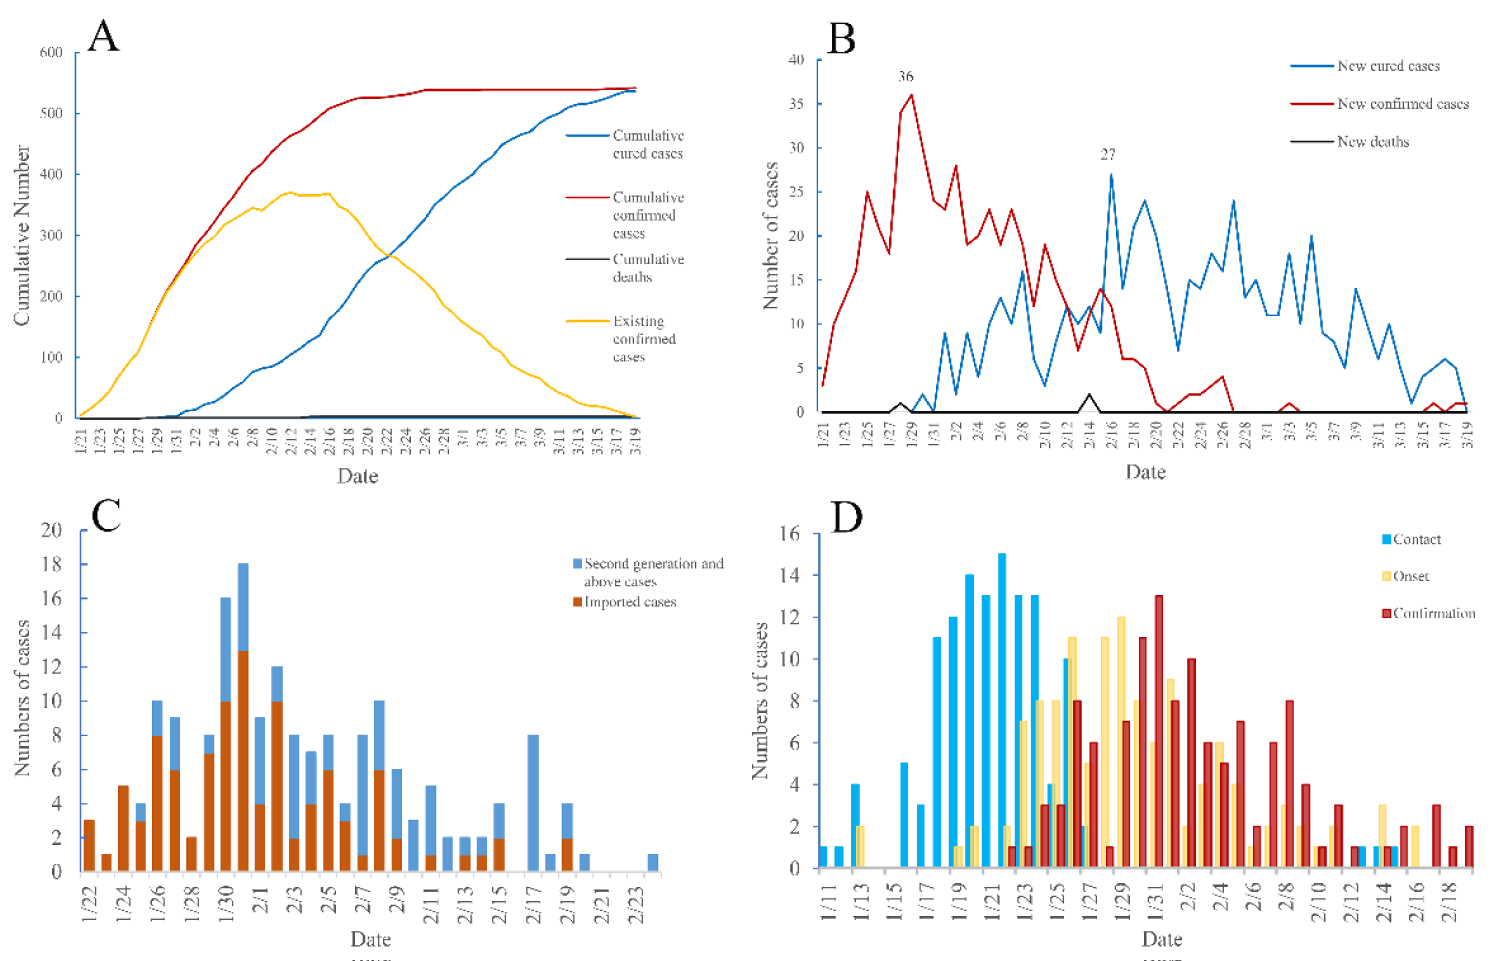
As of 24:00 on March 20, 2020, a total of 542 COVID-19 cases were reported in Sichuan Province, with a cumulative morbidity of 0.64/100,000 [2,4]. 536 patients were cured and discharged, and 3 died. The cure rate was 98.89%, and the mortality rate was 0.55%. At 24:00 on March 20, there were 3 existing patients and among them 2 were abroad imported cases (Figure 1A).
Temporal distribution and case sources
On January 21, 2020, 2 imported cases were reported in Sichuan Province, both of whom had lived in or traveled to Hubei Province [5]. The number of new confirmed cases reached a peak (36 cases) on January 30. Since then, a downward trend was observed. Since the first cured case was reported in Sichuan Province on January 29, the number of cured cases had gradually increased to a maximum of 27 cases by February 17. Then it exceeded the number of new confirmed cases. On March 20, there was one abroad imported case but no cured patient. Besides, the first death was reported on January 29, and two new deaths were reported on February 15 (Figure 1B).
As of March 20, imported cases accounted for 57%, and the proportion of two generation or above cases was 43%. Analysis of confirmed cases (181 cases) with clear epidemiological exposure history in 13 cities (Prefectures) in eastern Sichuan Province indicated that from January 22 to February 9, the new confirmed cases were mainly imported cases, who were residents or travelers to Hubei Province. The proportion of two generation or above cases increased from January 24 to January 31 and then gradually declined. Since February 9, two generation or above cases has become the main source of daily new cases in these 13 cities (Prefectures) (Figure 1C).
The contact time, onset time, and diagnosis time of 124 confirmed cases were collected. The earliest time of contact with the source of infection can be traced back to January 11, and this patient became ill on January 23 and was diagnosed on January 24. The date of contact of 105 (84.7%) patients was between January 18 and January 26. The peak exposure date was January 22, and the peak illness onset date was January 29. The median time from exposure to illness onset (the median incubation period) was 7 days, with a minimum of 1 day and a maximum of 25 days. The peak diagnosis date was January 31, and the median time from onset to diagnosis was 2 days, with a minimum of 1 day and a maximum of 27 days (Figure 1D).
The inflection points of epidemic in Sichuan Province and in China (non-Hubei)
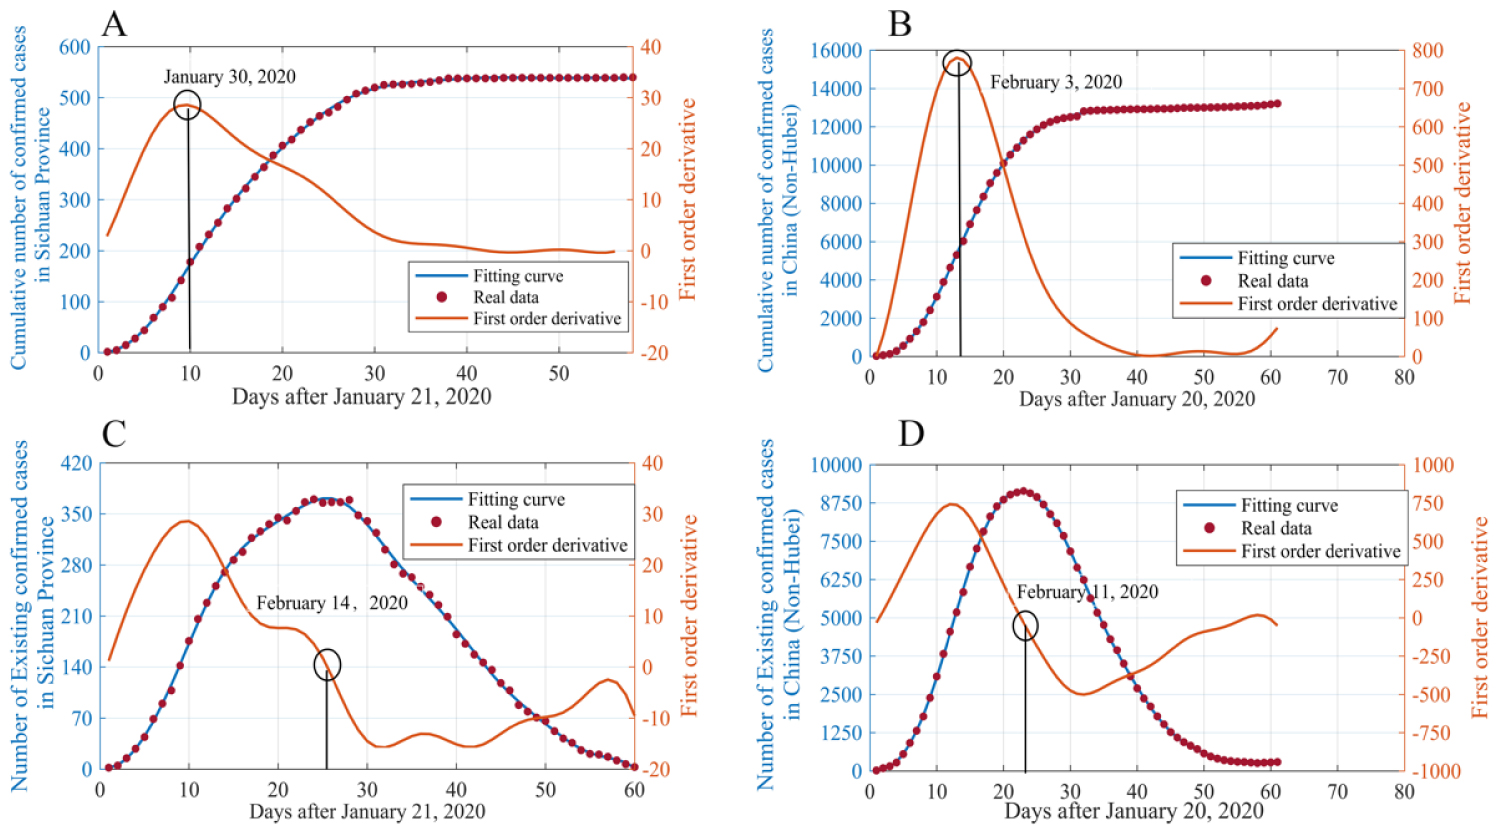
This study fitted the time sequence of cumulative confirmed cases (excluding abroad imported cases) number and the existing confirmed cases number with the sum of sine function and computed the first order derivative. The fitting curve of the cumulative number of confirmed cases in Sichuan Province (R-square: 0.9998, RMSE: 2.886), the fitting curve of the cumulative number of confirmed cases in non-Hubei non-Hubei areas in China (R-square: 0.9999, RMSE: 38.11), the fitting curve of the number of existing cases in Sichuan Province (R-square: 0.9992, RMSE: 4.308), and the fitting curve of the number of existing cases in the non-Hubei areas in China (R-square: 0.9999, RMSE: 38.69) were calculated (Figure 2A, Figure 2B, Figure 2C and Figure 2D).
For the functional model of the cumulative number of confirmed cases, the extreme point of the first order derivative of the fitting curve corresponded to the point with the largest number of daily new cases. Via this point, the number of new confirmed cases changed from an accelerated rise to a decelerated rise. Therefore, the date corresponding to this point can be regarded as the inflection point of the number of new cases. The number of daily confirmed new cases in Sichuan and non-Hubei areas in China reached the inflection point on January 30 and February 3 respectively (Figure 2A and Figure 2B).
In the functional model of the number of existing confirmed cases, the point where the first derivative value of the fitting curve is 0 corresponds to the peak point of the number of existing confirmed cases. From then on, the number of existing cases began to decrease, mainly because the sum of the number of new cured cases and the number of new death is greater than the number of new diagnosed cases. Therefore, the date corresponding to this point can be regarded as the inflection point of the number of existing confirmed cases. The number of existing confirmed cases in Sichuan and non-Hubei areas in China reached the inflection point on February 14 and February 11 respectively (Figure 2C and Figure 2D).
Geographical distribution of confirmed COVID-2019 cases
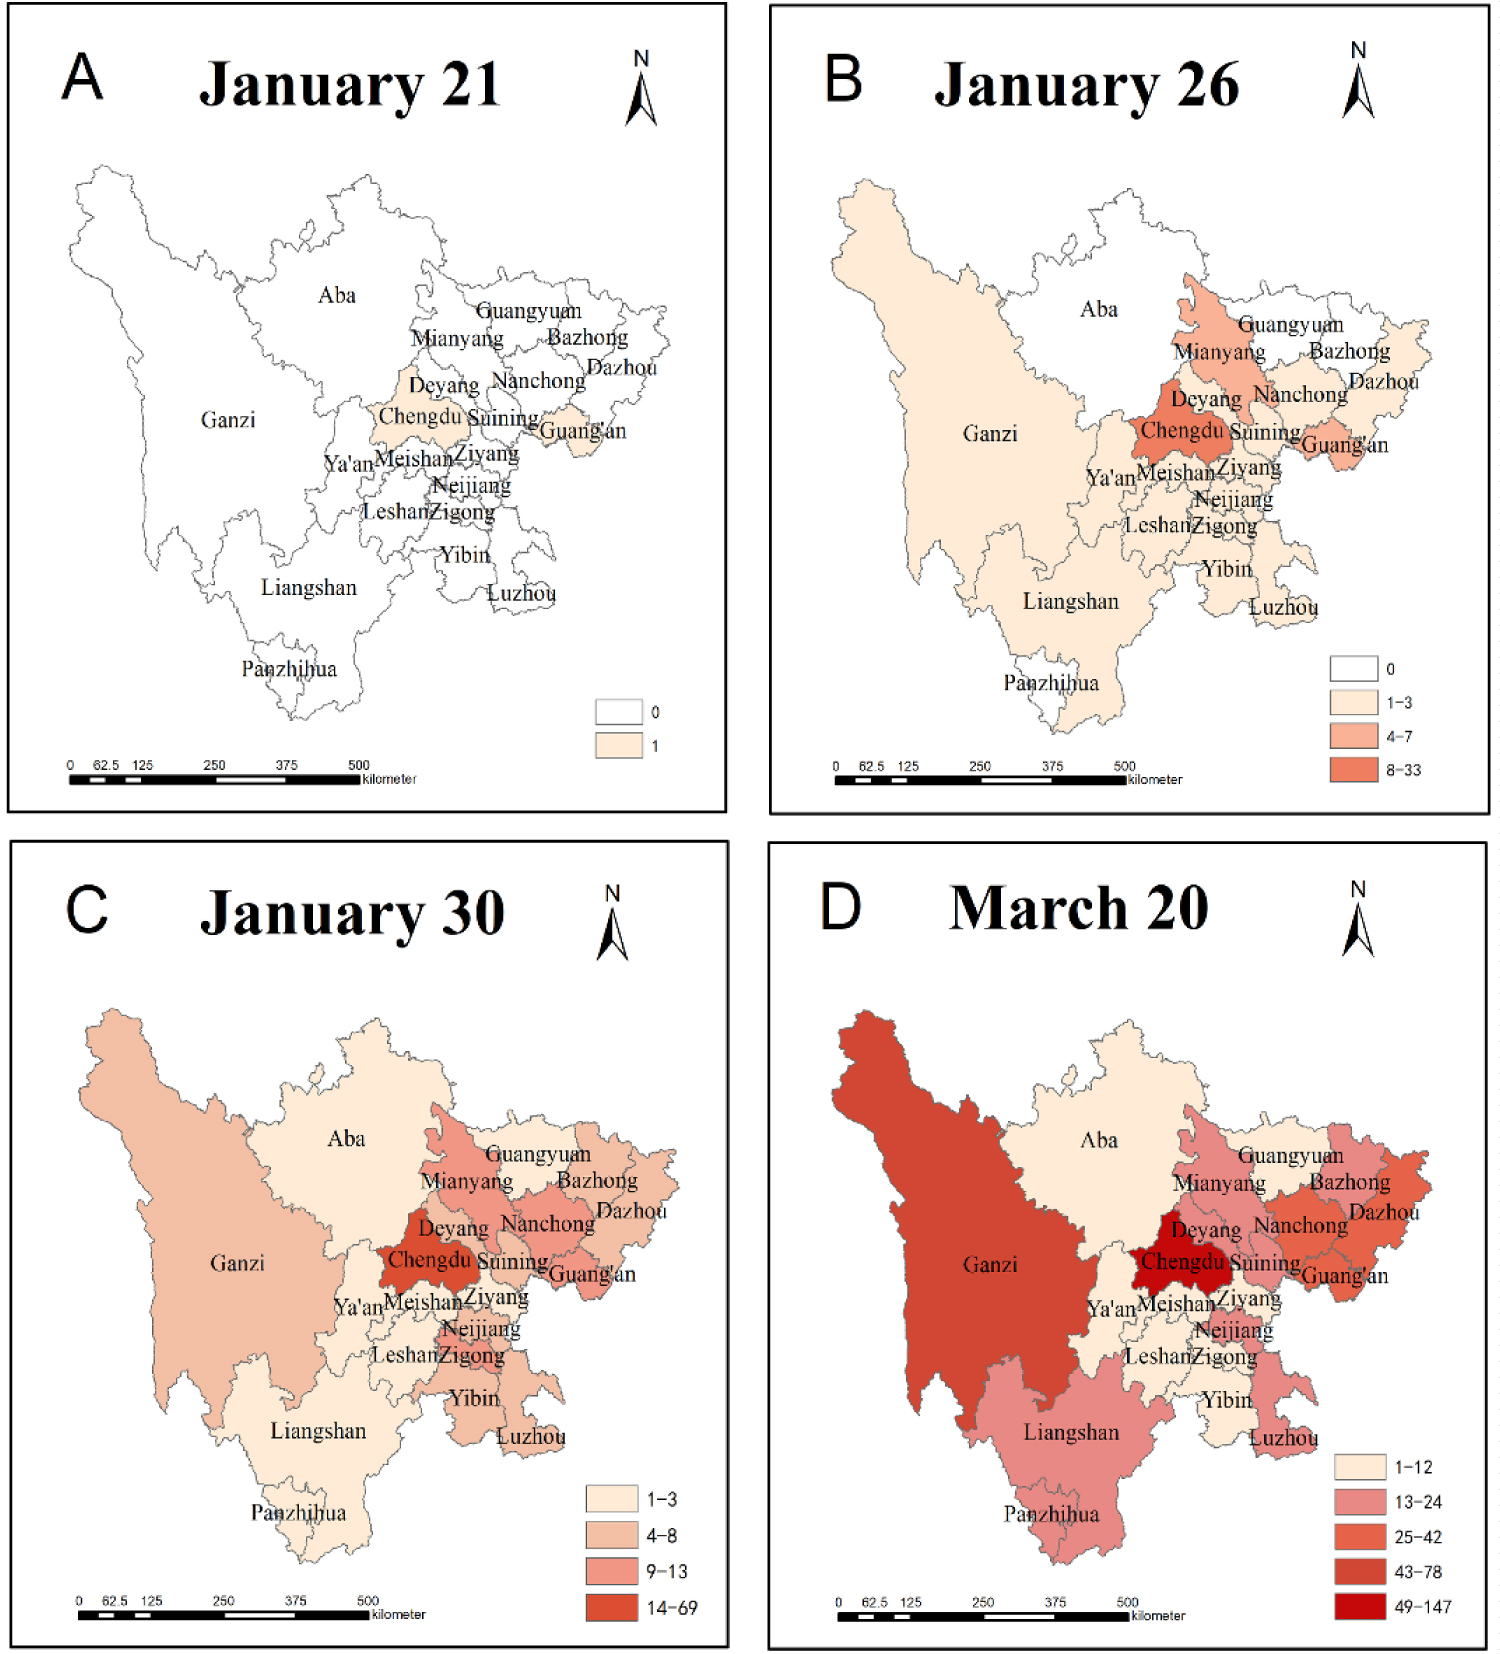
On January 21, Chengdu and Guang'an reported one imported case respectively (Figure 3A). On January 26, Mianyang City reported the first local second-generation case in the province. Except for Aba Prefecture, Guangyuan City, Bazhong City, and Panzhihua City, confirmed cases were reported in other regions (Figure 3B). As of January 30, the COVID-19 epidemic spread to 21 cities (prefectures) in the province and continued to increase (Figure 3C). As of March 20, the confirmed cases covered all 21 cities (prefectures) in Sichuan Province and were concentrated in Chengdu city (147 cases), Ganzi Prefecture (78 cases) and Dazhou City (42 cases), totally accounting for 49.3% of the cases in the province (Figure 3D).
Gender and age distribution
Since the demographic sociological information of the cases is not required by the municipal health commissions. Information on confirmed cases in some cities was missing or not rigorous enough to be included in the study. Therefore, this study only statistically described the confirmed cases (181 cases) in 13 cities (prefectures) in eastern Sichuan Province, including Bazhong City (24 cases), Luzhou City (24 cases), Mianyang City (22 cases), Neijiang City (22 cases), Deyang City (18 cases), Suining City (17 cases), Panzhihua City (16 cases), Liangshan Prefecture (13 cases), Zigong City (9 cases), Meishan City (8 cases), Ziyang City (4 cases), Leshan City (3 cases), Aba Prefecture (1 case) (Table 1).
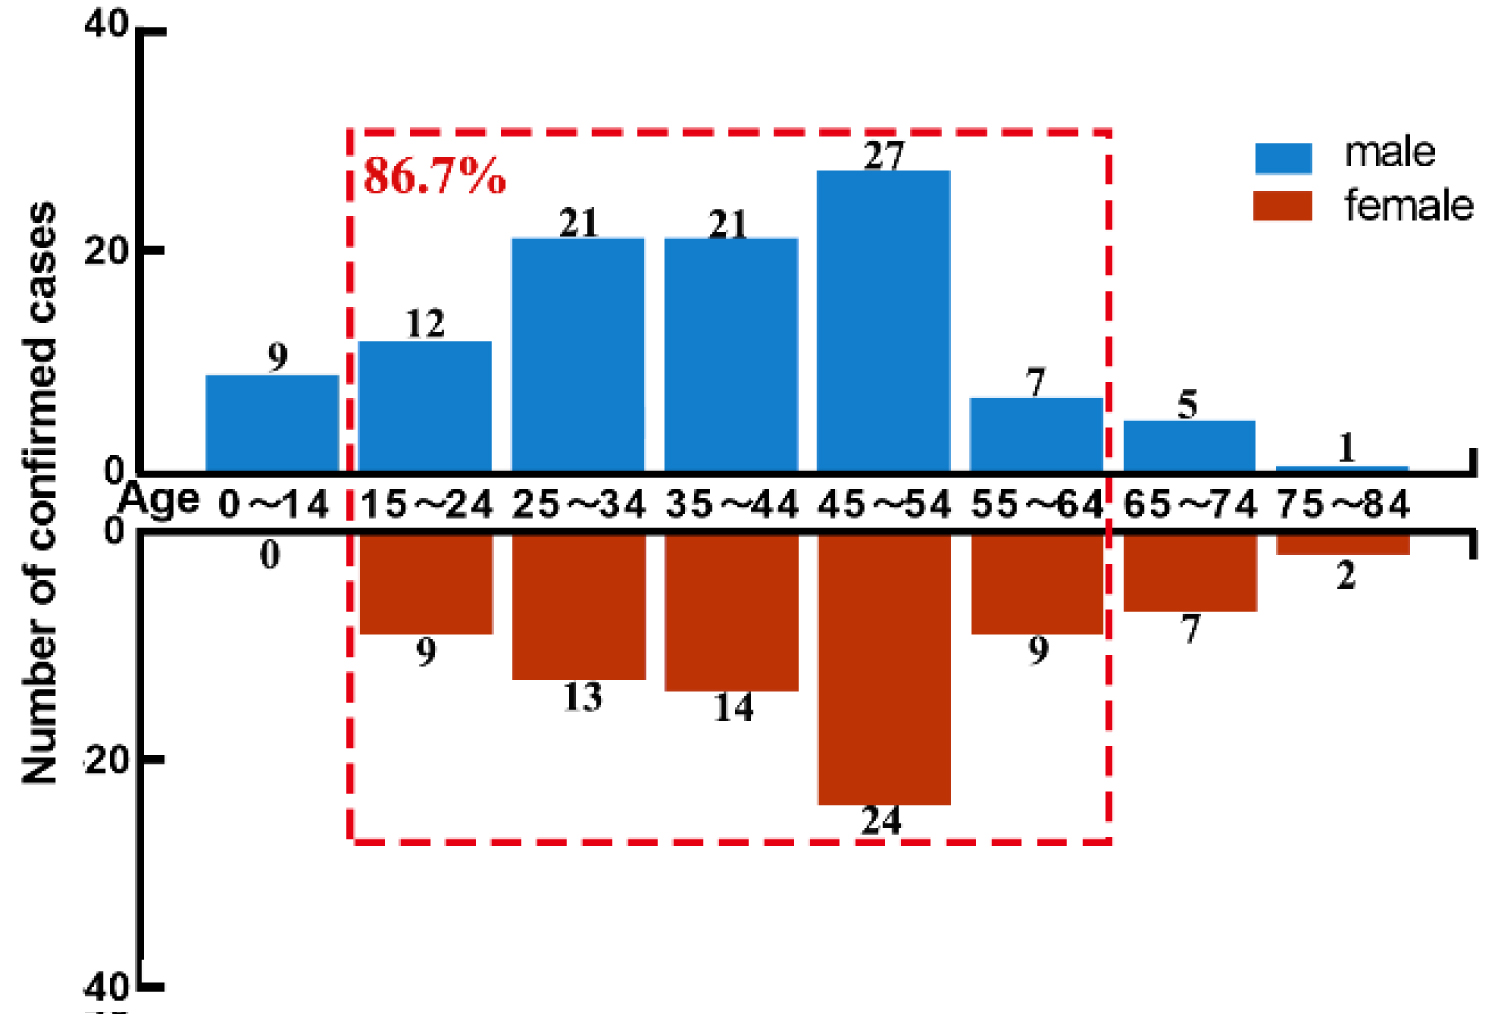
The ratio of men to women in 181 confirmed cases was 1.32:1. The median age of confirmed cases was 43-years-old. The youngest patient was 46-days-old, from Deyang City. The oldest patient was 79-years-old, from Panzhihua City. The patients were concentrated in the 15-64 age group (86.7%). The distribution of the main age groups was similar between men and women (Figure 4).
Discussion
As of 24:00 on March 20, 2020, a total of 542 COVID-19 cases were reported in Sichuan Province, with a cumulative incidence of 0.64/100,000, which is lower than Henan Province (1.32/100,000) and Guangdong Province (0.95/100,000) [6,7]. This is related to the fact that Sichuan Province is located in the far southwest of China and is not adjacent to Hubei Province, and economy and transportation of Sichuan are slightly underdeveloped.
The number of daily confirmed new cases in Sichuan reached the inflection point on January 30. Before this time point, the epidemic situation showed a sharp rise period. The possible reasons were as follows: Before Wuhan was put on lockdown on January 23, 2020, some Wuhan residents had returned to Sichuan, leading to an increase in imported cases. Due to the lack of knowledge about COVID-19 in the early stage, the whole country was relatively insensitive to the epidemic, and people's awareness of protection was generally weak. Moreover, it was at the peak of transportation during Spring Festival. Therefore, people's close contact with cases was common. This study analyzed 124 confirmed cases with a clear epidemiological history and found that 84.7% of the cases were exposed from January 18 to January 26, and the median incubation period was 7 days (1-25 days). It could partially explain the rising trend of the epidemic before January 30.
After January 30, the number of new confirmed cases began to decline, which was related to the timely implementation of public health interventions in Sichuan Province. On January 24, Sichuan Province officially launched the so-called wartime control measures, known as the first-level response to major public health emergency [8]. As follows: First, put cities with epidemic and cross-provincial epidemic areas on lockdown to limit population mobility. Second, restrict or stop crowd-gathering activities such as fairs, rallies, theater performances and so on, where there is a clear risk of epidemic transmission and cross-infection. Third, public places that are not necessary for residents' lives are closed. The public is required to wear masks when entering public places. Fourth, take measures for control COVID-19 such as on-site isolation, on-site observation and on-site treatment for confirmed cases and suspected cases, and take centralized or home-based medical observation for close contacts according to the situation. Fifth, set up temporary traffic health quarantine station in traffic stations and ports of entry and exit to conduct quarantine inspection for travelers. All confirmed COVID-19 cases and suspected COVID-19 cases are temporarily isolated, detention for check-up and transferred to institutions designated by local health departments. Sixth, collect and report epidemic information in time.
It was noteworthy that of the 124 cases traceable to exposure and onset dates, 10 (8.06%) had an incubation period greater than 14 days and a maximum incubation period of 25 days. This part of the infected people with super lengthy incubation period would become the potential source of infection after the quarantine of 14 days. After the cities in Hubei Province were put on lockdown, non-Hubei provinces of China except Tibet launched the so-called wartime control measures around January 24. The number of daily confirmed new cases in Sichuan reached the inflection point 4 days earlier than that of non-Hubei area in China, namely the number of new cases per day began to decline earlier, which reminded that the prevention and control measures in Sichuan Province received good results. Since there were only 3 dead cases in Sichuan Province, the inflection point of the number of existing confirmed cases was determined by the number of new cured cases and the number of new confirmed cases. The number of existing confirmed cases in Sichuan reached the inflection point 3 days later than that of non-Hubei areas in China and the peak of the curve of existing confirmed cases was delayed. It may indicate that the length of hospital stay of confirmed cases in Sichuan province was relatively long, which was related to the proportion of severe cases and other clinical characteristics of patients. The detailed data should be collected for further study.
The main source of confirmed cases in 13 cities (prefectures) gradually shifted from imported cases to local cluster cases (second generation or above cases) in early February. As of March 20, local cluster cases in 13 cities (prefectures) accounted for less than 50%, suggesting that there was no large-scale local transmission. This was due to the public health interventions mentioned above.
Since February 5, enterprises and factories in various regions have resumed work and production. The People's Government of Sichuan Province decided to adjust the emergency response level of public health interventions from the first-level response to the second-level response since February 25 [9]. The number of new confirmed cases continued to decrease. And the results of the previous work did not been damaged, suggesting that it was effective to take precise public health interventions according to the epidemic situation in different regions and to organize migrant workers to return to work safely and in order [10].
Based on the geographical and temporal distribution of confirmed COVID-2019 cases in Sichuan Province, all 21 cities reported new imported cases only 9 days after the first confirmed case was reported. According to research results, there was a positive correlation between daily morbidity and 3-day-before migration index [7]. The Baidu migration system showed that from January 10th to 20th, Chengdu and Dazhou ranked first and second in the list of destinations in Sichuan Province where people in Hubei Province moved to, respectively [11]. Chengdu is the capital and transportation fortress of Sichuan Province, and Dazhou is the first transportation hub to enter Sichuan. This result indicated that the people of Sichuan and the people of Hubei had a frequent contact because of developed modern traffic, which brought certain difficulties in preventing and controlling COVID-19. In Ganzi, in the early stage of the current epidemic, there were many local cluster cases due to poor prevention and control [12].
The cases in 13 cities (prefectures) in eastern Sichuan Province were mainly in young and middle-aged groups, who were main laborers. The proportion of cases in the 15-64 years-old age group was 86.7% among them, which was similar to other research results, such as the study by the Chinese Center for Disease Control and Prevention (CDC) (the 20-69 years-old patients nationwide accounted for 85.9%), the research result of the team of Nanshan Zhong (the proportion of 15-64 years-old patients was 84.0%) and research result of high incidence areas of Henan Province (15-64 years-old patients accounted for 83.9% to 89.8%) [6,13,14]. Among the 181 confirmed COVID-19 cases, 56.9% were male. Similarly, the result of CDC (male patients accounted for 51.4%), the result of team of Nanshan Zhong (female patients accounted for 41.9%) and the result of Huang, et al. (Male patients accounted for 73%) all suggested that there are more male patients than female patients [13-15].
Our analyses had several limitations. First, the data was from the websites of Health Commission. Analyzing the transmission network of 2019-nCoV among the people was difficult because of the lack of detailed case information. Second, based on the time of diagnosis instead of the time of illness onset, the temporal distribution of cases resulted in the effect of time lag on the epidemic of COVID-19. Third, due to lack of information, we did not analyze clinical characteristics and treatment of patients.
Conclusions
The epidemic in Sichuan Province has been under control. This result emphasized that the interventions could inhibit the epidemic of COVID-19.
Acknowledgements
This work was supported by Natural Science Foundation of China (grant number 81872718); Health Commission of Shanghai Municipality (grant number 201840041); 2018 medical education research project of medical education branch of Chinese Medical Association and medical education professional committee of Chinese Higher Education Society (grant number 2018b-n02081); Key undergraduate course project of Shanghai Education Commission (grant number 2019-65).
Thanks to all medical workers on the frontline fighting against this epidemic.
Conflict of Interest Statement
The authors declare that they have no competing interests. Availability of data and materials: The datasets used and/or analyzed during the current study are available from the corresponding author on reasonable request.
Supplementary
Supplementary data and codes were uploaded in Github. The data linking is as following: https://github.com/alicezhang65/COVID-19-Sichuan
References
- https://www.who.int/emergencies/diseases/novel-coronavirus-2019/technical-guidance/naming-the-coronavirus-disease-(covid-2019)-and-the-virus-that-causes-it
- http://www.sc.gov.cn/10462/10778/10876/2020/3/21/779e4df718064d5ba19f9495dbe52d65.shtml
- http://www.nhc.gov.cn/xcs/zhengcwj/202003/46c9294a7dfe4cef80dc7f5912eb1989.shtml
- (2020) China Statistics. Sichuan Statistical Yearbook-2019. China Statistics Press, China.
- http://www.sc.gov.cn/10462/12771/2020/1/22/5de02bd9001e4d25899e120ce2f588b2.shtml
- Li C, Ma Q, Yin H, et al. (2020) Epidemiological features and prevention measures of COVID-19 in high incidence areas of Henan Province. Journal of Wuhan University (Medical Edition) 03: 1-8.
- Wang X, Liao C, Li Z, et al. (2020) Preliminary analysis on the early epidemic and spatiotemporal distribution of new coronavirus pneumonia in Guangdong Province. Journal of Tropical Medicine 03: 1-8.
- http://www.sc.gov.cn/zcwj/xxgk/NewT.aspx?i=20200125200454-361030-00-000
- http://www.sc.gov.cn/10462/10464/10727/10866/2020/2/25/1b3d9ff5ed3844349c7fdc1bc1a0edcf.shtml
- http://www.sc.gov.cn/zcwj/xxgk/NewT.aspx?i=20200206184226-869478-00-000
- (2020) Baidu migration. Destinations moved out of Hubei Province.
- http://www.xinhuanet.com/legal/2020-02/25/c_1125624622.htm
- Epidemiology working group for NCIP epidemic response (2020) The epidemiological characteristics of an outbreak of 2019 novel coronavirus diseases (COVID-19) in China. Zhonghua Liu Xing Bing Xue Za Zhi 41: 145-151.
- Chen N, Zhou M, Dong X, et al. (2020) Epidemiological and clinical characteristics of 99 cases of 2019 novel coronavirus pneumonia in Wuhan, China: A descriptive study. Lancet 395: 507-513.
- Huang C, Wang Y, Li X, et al. (2020) Clinical features of patients infected with 2019 novel coronavirus in Wuhan, China. Lancet 395: 497-506.
Corresponding Author
Aihong Zhang, PhD, Department of Medical Statistics, School of Medicine, Tongji University, No.1239, Siping Road, Shanghai, China, 200092, Tel: 86-13621641931
Copyright
© 2020 Yang C, et al. This is an open-access article distributed under the terms of the Creative Commons Attribution License, which permits unrestricted use, distribution, and reproduction in any medium, provided the original author and source are credited.


