One-Compartment Soil Water Model for Forestlands in Water-Limited Regions
Abstract
Understanding the vertical distribution dynamics of soil moisture is essential for estimating soil water resources, controlling soil degradation and regulating the relationship between soil water and plant growth in water-limited regions. There have been a few studies of the vertical change of soil moisture in forestlands, but there are few models that can suitably describe the vertical change of soil moisture under different conditions. In this study, a one-compartment soil water model (OCSWM) was developed, and soil moisture data collected in a shrub forest were used to test the model. In this study, a one-compartment soil water model (OCSWM) was developed, and soil moisture data collected in a shrub forest were used to test the model. The results showed that the OCSWM can better express the vertical change of soil moisture under different conditions compared with the two-compartment soil water model (TCSWM) in terms of describing the vertical change of soil moisture under different situations in the shrub forest. The OCSWM has good application value in estimating some important parameters of soil water management for the sustainable management of forests in water-limited regions.
Keywords
Water-limited areas, Shrub forest, Soil moisture, Vertical distribution dynamics, OCSWM, TCSWM
Foreword
Soil moisture is a significant factor affecting shrub growth in water-limited regions. In the Loess Plateau of China, precipitation is the only source of soil moisture because loess soils are deep, ground water levels are low, and there is no irrigation [1]. The relationship between plant growth and soil moisture, until recently, has remained unclear, and soil degradation has increased due to soil drying in many perennial, forest plantations and grasslands in the region [2,3]. The combination of excessive evapotranspiration and an inadequate water supply has caused large-scale soil degradation and reductions in vegetation in perennial forestlands, which can subsequently influence the land-water cycle. Using soil moisture resources sustainably is crucial for the sustainable management of forests and vegetation in water-limited areas [4-6].
Soil water only used by plants, but cannot be used limitedly. One of the most important index to express whether or not plants overuse soil water resources is the soil water resources use limit by plants (SWRULP). It represents soil moisture storage in the maximum infiltration depth (MID) in which every soil layer becomes a dried soil layer, that is to say, the soil moisture content within the MID is equal to the wilting coefficient.
Soil water resources are water storage in a given soil layers, one of the most important parts of water resources. Soil water carrying capacity for vegetation (SWCCV) is an index that represents the ability of soil moisture resources to support vegetation when the water uptake by plants from the soil is equal to the water recharge in the root soil layer, or in other words, the maximum amount of soil moisture content per unit area that can maintain plant populations and help them grow well over a certain period. SWCCV represents the population quantity of plant indicators or their density. Plant indicators are edificato in a plant community a plant community for natural restoration of vegetation, with the goal with goal tree or grass for artificial vegetation. The mathematical model for vertical change in soil water is fundamental for estimating SWRULP and SWCCV [7]. At present, there have been a few qualitative analyses and spatial variability analyses at large scales [8-11]; however, there are a few studies using a vertical variation model of soil water [12]. For example, using the two-compartment soil water model (TCSWM), [13] mimicked the perpendicular change in soil moisture in locust forests in a loess gully slope of the Loess Plateau. Wang, et al. [14] also established a perpendicular variation model of soil water in caragana (Caragana korshinskii Kom) plantations in a water-limited area. However, the TCSWM is not suitable for all cases and should be improved since the vertical change in soil moisture is complex and affected by factors, such as climate, soil texture, root distribution, topography, and land use type [9,15] Further study of the vertical change in soil moisture is needed to improve the vertical distribution model for soil water.
The aim of this study was to further examine the vertical distribution of soil moisture and develop a universally-accepted model to better indicate the vertical distribution of soil moisture under all conditions. The outcomes will be beneficial for estimating soil water resources, SWRULP, and SWCCV and also for mitigating soil drying and land degradation, which hinders sustainable management of forests in water-limited regions.
Materials and Methods
Study site and measurements
The research was conducted in Guyuan County, Ningxia Hui Autonomous Region, which is located in a semi-arid region. The study site is characterized by deep loess soil, which has been impacted by severe soil loss. The mean annual temperature is 7.0 ℃, and the groundwater level is more than 60 m. The frost-free period is 152 days.
A 16-year-old caragana brushland covers an area of about 20 ha. An experiment was established in April 2002 in the caragana shrubland on a west-facing slope with a gradient of about 8° at an elevation of around 1650 m. The density of the experimental shrubs is 87 brushes per 100 m2, and the mean crown width is 102.9 cm × 87.2 cm. Herbaceous plants grow under the caraganas shrub forest.
Two 4 m long aluminum access tubes were fixed at the middle of the experimental plot with a 2 m level distance between them. A neutron probe (CNC503A (DR) made in nuclear instrument company, Beijing, China) was applied to monitor soil moisture in situ, and it was corrected for the soil in the research area [16]. The instrument counts the number of slow neutrons, which is linearly associated with soil moisture content [17]. The calibration equation was: a = 55.76b + 1.89, where, a is the soil moisture indicated in percent (%) and b is the proportion of the neutrons counted in the soil in comparison to the standard amount of neutrons found in water. Surveys were conducted continuously every half a month during the growing season for five years (2002 to 2006) at soil depths ranging from 0 to 400 cm in increments of 20 cm (beginning at 5 cm).
The rainfall data for 1983 to 2006 were obtained from a local experimental station located close to the study site (50 m).
Data Analysis
Analysis of precipitation
Precipitation was unevenly distributed during 1983 to 2001 with a mean rainfall of 415.6 mm. Rainfall levels were continuously low from 1997 to 2002, and precipitation in 2002 was 385.3 mm. In 2002, soil water was not sufficient to meet the needs of plant growth, which inevitably caused soil deterioration in the form of soil drought, which led to some desertification.
Analysis of soil moisture content
First, the soil moisture data from 2002 were used to draw a scatter diagram and analyze the vertical changes in soil moisture content. Then, the data measured during the period from 2002 to 2006 were used to validate the vertical variation model of soil moisture. Finally, nonlinear regression analysis was used to obtain the fitting parameters and homologous goodness-of-fit of the modified model with SPSS 16.0 software made in SPSS Inc, Chicago, USA.
Results and Analysis
The vertical change of soil water with soil depth
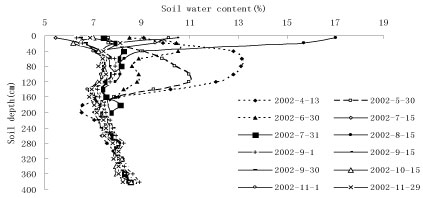
The measurements of soil water started in mid-April when caragana begins to germinate. The changes in soil water content over time are not noticeable before caragana germinates because of a lack of precipitation, which prevents plant roots from activating and taking in water during this period. Thirteen sets of soil water data were obtained (Figure 1). Analysis of variance showed that the differences among the thirteen sets of soil water data were not significant in the soil layers deeper than 220 cm (Figure 1). In addition, the soil water content measured on August 15 was the highest in the surface soil layer because precipitation in 2001 was higher than average precipitation, but moisture decreased dramatically with soil depth.
Vertical change model of soil moisture
The soil moisture in the wet soil layer higher than the wetting front, and the soil moisture in the dry soil layer lower than the wetting front reach a balance at the wetting front. Thus, the limit of soil water was found to be
where, Wa is the soil moisture in the soil layers higher than the wetting front, f is the soil moisture in the soil layers deeper than the wetting front, and hmax is the MID. The process of precipitation infiltration into soil can be described by the two-compartment soil water model (Figure 2), and the corresponding mathematical model is shown as follows.
Solving Equation 1, the vertical distribution model of soil moisture with soil depth can be found to be
where Wc1 is the soil moisture supply, h is the soil depth, k is the adsorption rate of soil moisture, k1 is the consumption rate of soil moisture, a and c are constant with regard to k and k1, and Wc0 is equal to a - c + f, a ≥ 0, c ≥ 0, k ≥ 0, k1 ≥ 0.
The soil moisture data metered in 2002 was utilized to validate Equation (2), and the fitting result is shown in Table 1. Table 1 shows that TCSWM is applicable in some cases but not others, and does not obtain applicable parameter values. With regard to the data measured on May 30 and July 31, the goodness of fit is lower and not in accordance with the statistical standards. With regard to the data measured on September 1 and September 30, the values of fitting parameters do not meet the demands that all the fitting parameters should not be smaller than 0. Therefore, Equation (2) should be improved in order to better illustrate the vertical change of soil water under different times.
The changed model of soil moisture
Because the soil ecological system is the connection in the time series, the state of mater and energy in the former stage will affect that in the subsequent stage. The elements impacting the soil moisture content on any one day are rainfall on that day, the pre-existing soil moisture content, and evapotranspiration (soil evaporation and transpiration).
Because precipitation and the antecedent soil water can replenish soil water on that day, the sum of the efficient recharge from rainfall and the antecedent soil water is recognized as the soil water supply. After analyzing these factors, we found that the soil moisture supply and evapotranspiration can be explained by OCSWM, respectively, see Figure 3.
The OCSWM is given by
where WC denotes the soil moisture content on the same day, WCR is the total recharge of soil moisture from rain, and WC0 is the antecedent soil moisture content. The soil moisture supply, WC1, equals soil water supply from rain, WCR, plus the antecedent soil moisture content, WC0, and the difference, WC1 - WC, is the soil moisture consumption. After analysis, it can be shown that WC1 decreases with increasing soil depth and approaches zero when the soil depth, h, tends to the MID. hmax and the change rate, WC1, are not constant but variable, and are proportional to the logarithmic of soil depth, h, expressed by klnh. Soil moisture consumption (WC1 - WC) reduces with increasing soil depth, and the change rate is k1. In addition, the soil moisture content will become more and more stable with soil depth. When the infiltration depth tends to hmax, the absolute value of the difference between WC and the soil moisture content, f, in those soil layers deeper than MID, hmax, tends to zero.
The solution of model 3 is shown as follows:
i.e.,
Thus, the improved model of soil water can be found to be
where the values of a and c are any real numbers and k, and k1 are bigger than 0. Equation 4 better describes the actual circumstance because it takes into account the precipitation and the antecedent soil water content in the earlier stage during establishment of the model (4). Besides, compared with equation (2), the change rate of soil water supply in equation (4) is a variable instead of the constant in the model (2).
Model validation
Equation (4) is used to fit the soil moisture data metered in 2002, and the values of fitting parameters and goodness of fit are given in Table 2. Table 2 shows that all of the goodness of fit fall in with the statistical needs of a significant test, suggesting that the one-compartment soil water model (OCSWM) is reasonable and can better express the vertical change of soil moisture observed in 2002.
According to the analysis of fitting parameters, the above thirteen groups of data metered in 2002 can be classified into four groups according to the parameter values, as shown in Table 3. Furthermore, the rainfall data for 2002 were used to analyze the similar characteristics of the four groups and to test the rationality of the category.
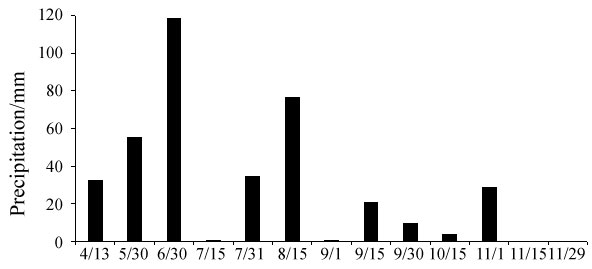
The cumulative precipitation in the period from January 1 to April 13 was 32.2 mm, and the total rainfall during the period from May 30 to June 30 was 118.6 mm, which was sufficient to meet the needs of plant transpiration. The cumulative precipitation between every two adjacent time points from January 1 to November 29 is shown in Figure 4.
Figure 4 shows that at the start of plant growth, the plants took in some water because of the start of budding and there were a few rain events before April 13 and May 30, and the soil water content was higher in the 60-100 cm soil layers for the two periods. The vertical change curves of soil moisture were similar.
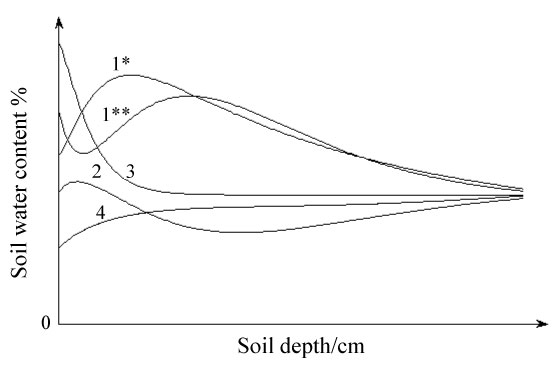
The vertical change trend of soil moisture content decreased after the first increase, as shown in curve 1*, see Figure 5.
The total rainfall in the period from May 30 to June 30 was 118.6 mm, which was the largest amount of precipitation between any two observations, and a heavy rain of 49.5 mm occurred on June 21. At the same time, the plants grew rapidly and required a lot of water, so the soil moisture was lower in the soil layers where most of plant roots were distributed. Even though there were some big rain events, the soil water supply still could not satisfy the needs of plant consumption until the end of July because plants were in the fast growth period. Thus, the soil water content in the 80-160 cm soil layers was lower than that in the other soil layers. There was a similar change tendency of soil water with increasing soil depth on June 30, July 15, and July 31. For the other two cases in November, although there was not a lot of water taken up by plants during this month because of dormant, the soil moisture in the 80-160 cm soil layers was still not larger than that in other soil layers because there were no rain events and soil water evaporated. From the above analyses, these five cases shared a common pattern in that the soil water supply was lower than the soil water consumption, as shown by curve 2 in Figure 5.
Cumulative rainfall reached 317.5 mm before August 15, accounting for 81.7% of the annual precipitation, and the soil water condition was also supplemented. The soil moisture content in the surface soil was dramatically high on August 15 because of a large number of preceding rain events. Afterwards, there were also rain events a few days before September 15, and the soil moisture content in the surface soil was not lower than that in the other layers. Therefore, the soil water content measured on September 15 followed a parallel vertical change trend with that measured on August 15. The same condition appeared on November 1 because the plants had stopped growing and there were some rain events with an accumulative precipitation of 28.9 mm. According to the analysis, after the soil water is fully complemented, the vertical change curve of soil water mostly shows a decreasing tendency, as shown in curve 3 of Figure 5. Moreover, model (4) can be simplified as follows:
From mid-August to September 1, plants utilized the soil moisture in the earlier stage at the same time because there was little rainfall in the experimental area. The soil moisture supply and soil moisture consumption relationship remained in balance at that moment, thus the soil water did not change dramatically with soil depth. In addition, the rainfall amount on September 30 was low, which was similar with that on October 15 and on September 1. When the soil moisture supply was in balance with the soil moisture consumption, the vertical change curve of soil moisture was smoothly ascendant (see curve 4 in Figure 5).
In addition, if there is a large amount of precipitation at the start of plant growth, the soil moisture content in the surface soil will increase rapidly. At that point, the soil moisture content decreases first and then increases and again reduces with soil depth. This situation can also be expressed by model (4) with the parameter values of c < a < 0 and k > k1 > 0 (see curve 1** in Figure 5).
In conclusion, it is reasonable to categorize these cases according to the parameter values, but it also can simplify the analysis of the vertical change dynamics of soil moisture.
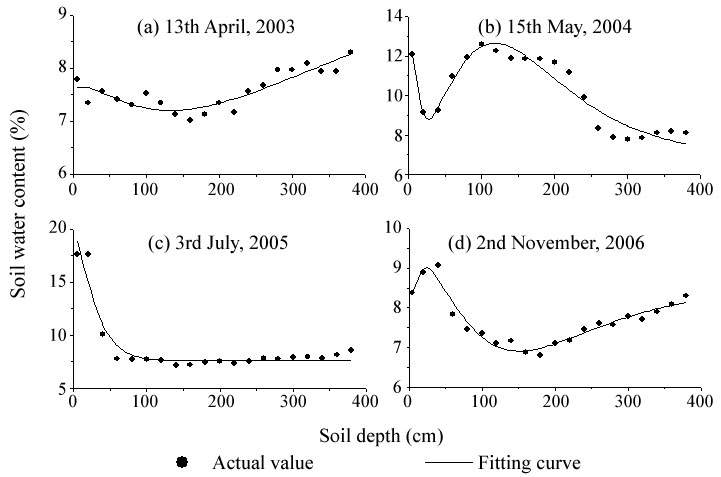
Furthermore, the soil moisture data investigated during the period from 2003 to 2006 were used to validate the model (4). In addition, the data metered on April 3, 2003, May 15, 2004, on July 3, 2005 and November 2, 2006 were selected to further analyze the reliability of the modified model because they represented different stages of plant growth (Figure 6). With regard to the above four sets of data, the goodness of fit was 0.8, 0.92, 0.99, and 0.93, respectively, which met the statistical needs, suggesting that the improved model can satisfactorily describe the actual situation and has wide applicability.
Discussion
Soil moisture management under forests and grasslands in water-limited areas is the primary challenge in controlling soil degradation and achieving vegetation restoration and sustainable use of soil moisture resources in water-limited areas, such as on Loess plateau of China. To better understand the soil moisture environment and to better manage soil water, we should understand the vertical distribution dynamics of soil water in estimations of soil water resources. If we obtain measures of the soil water resources, we can judge whether or not soil water resources are more than the SWRULP. If so, we then have to determine the SWCCV and regulate the relationship between caragana growth and soil water for sustainable use of soil water resources [7].
Because goodness of fit is a good statistical indicator reflecting the fitting degree of a model, we can select the indicator as a standard to compare two models. The model with the higher goodness of fit and fitting parameters that meet the requirements is better than the model with a lower goodness of fit or fitting parameters that does not meet the requirements. TCSWM was suitable for some sets of data but not all. In some cases, we could not obtain right parameter values, or the goodness-of-fit , such as the soil water data measured on September 1 and September 30, Table 1, which shows that TCSWM is not completely suitable to fit the vertical change of soil moisture in forestland. When the same soil water data are fitted by using OCSWM, it can obtain appropriate parameter values, but also the goodness of fit is higher (Table 1 and Table 2), which shows that OCSWM is better than the TCSWM.
Conclusion
A vertical change model of soil moisture content was modified in this study. It is a universal equation and the homologous parameter values are different under different situations. The modified model was used to fit soil moisture data observed during 2002 to 2006, and all of the goodness of fit values met the statistical needs of a significant test, indicating that OCSWM can better represent the vertical distribution of soil moisture under different situations in caragana shrub forests in water-limited areas. The outcomes will be good for estimating soil water resources, SWRULP, and SWCCV, and provide theoretical ground for the control of soil drought and soil degradation, and for achieving vegetation restoration and sustainable management of forests in water-limited areas.
Acknowledgments
The research was funded by the Natural Science Foundation of China (Project Number. 41071193 and 41271539).
References
- Yang WZ, Shao MA (2000) Study of soil water on the Loess Plateau. Science Press, Beijing.
- Chen HS, Shao MA, Li YY (2008) Soil desiccation in the Loess Plateau of China. Geoderma 143: 91-100.
- Guo ZS, Li YL (2009) Initiation stage to regulate the caragana growth and soil water in the semiarid area of Loess Hilly Region, China. Acta Ecologia Sinica 29: 5721-5729.
- Guo ZS, Zhang WW (2016) Impact of Initial Planting Density on Soil Water Resource use Limit by Plants. Geoinfor Geostat An Overview 4: 1.
- Guo ZS, Shao MA (2013) Impact of afforestation density on soil and water conservation of the semiarid Loess Plateau, China. Journal of Soil and Water Conservation 68: 401-410.
- Ning T, Guo ZS, Guo MC, et al. (2013) Soil water resources use limit in the loess plateau of China. Agricultural Sciences 4: 100-105.
- Guo ZS (2014) Theory and practice on soil water carrying capacity of vegetation. Science Press, Beijing.
- Lemmnitz C, Kuhnert M, Bens O, et al. (2008) Spatial and temporal variation of actual soil water repellency and their influence on surface runoff. Hydrological Processes 12: 1976-1984.
- Wang YQ, Shao MA, Liu ZP (2013) Vertical distribution and influencing factors of soil water content within 21-m profile on the Chinese Loess Plateau. Geoderma 193-194: 300-310
- Fan JL, Scheuermann A, Guyot A, et al. (2015) Quantifying spatiotemporal dynamics of root-zone soil water in a mixed forest on subtropical coastal sand dune using surface ERT and spatial TDR. Journal of Hydrology 523: 475-488
- Zhang, Shao (2015) Spatio-temporal variability of surface soil water content and its influencing factors in a desert area, China. Hydrological Sciences Journal 60: 96-110.
- Saike Liu, Zhongsheng Guo, Mancai Guo (2014) Vertical variation model of soil water in artificial Shrubland on the loess plateau. Multimedia, Communication and Computing Application. 505-509.
- Zhao Z, Li J, Yuan ZF, et al. (2009) A model used to describe vertical change of soil moisture of robinia pseudoacacia plantations growing in the loess gully slope. Scientia Silvae Sinicae 45: 9-13.
- Wang ZF, Guo ZS, Guo MC, et al. (2012) Vertical variation of soil water in shrubland of caragana microphylla in hilly and gully areas of Loess Plateau. Bulletin of Soil and Water Conservation 32: 71-74.
- Mendham DS, White DA, Battaglia M, et al. (2011). Soil water depletion and replenishment during first and early secondrotation Eucalyptus globulus plantations with deep soil profiles. Agricultural and Forest Meteorology 151: 1568-1579.
- Hauser VL (1984) Neutron meter calibration and error control. Transactions of the American Society of Agricultural Engineers 27: 722-728.
- Evett SR, Schwartz RC, Casanova JJ, et al. (2012) Soil water sensing for water balance, ET and WUE. Agricultural Water Management 104: 1-9
Corresponding Author
Zhongsheng Guo, Institute of Soil and Water Conservation, Northwest A & F University, CAS & MWR, China.
Copyright
© 2019 Liu S, et al. This is an open-access article distributed under the terms of the Creative Commons Attribution License, which permits unrestricted use, distribution, and reproduction in any medium, provided the original author and source are credited.


