Spatial and Temporal Patterns of CO2, CH4, and N2O Fluxes at the Soil-Atmosphere Interface in a Northern Temperate Forested Watershed
Abstract
Forest soils are recognized as sources and sinks of greenhouse gases (GHG) (CO2, CH4, N2O), but there are limited data quantifying the magnitude of GHG fluxes at the soil-atmosphere interface across a range of landscape hydrogeomorphic conditions. In our study, GHG fluxes were measured in a forested watershed across a range of hydrogeomorphic locations (wetlands, hillslopes, riparian zones, etc) and evaluated in relation to temperature, antecedent flow conditions, and stream chemistry to help develop strategies to scale GHG emissions from the point scale to the watershed scale. Mean study period CO2 fluxes (0.61 to 2.89 gCm-2d-1) were positive at all sites, with larger fluxes occurring in well-drained soils. Negative fluxes (CH4 sinks) were found at the hillslope and lowland sites, while the wetland was a large source of CH4 emissions at the watershed scale. Mean CH4 fluxes ranged from -2.53 to 330.34 mgCm-2d-1. Nitrous oxide fluxes were low relative to other GHG fluxes (in terms of CO2 equivalent) and ranged between -0.72 to 0.70 mgNm-2d-1. Although carbon dioxide fluxes were positively correlated to soil temperature at all locations, CH4 and N2O fluxes were not significantly related to temperature, antecedent flow conditions, or stream chemistry at the watershed scale. However, strong differences in CO2 and CH4 fluxes related to landscape geomorphology were observed, and exceeded the magnitude of seasonal variations for CO2 and CH4 fluxes, suggesting that landscape hydrogeomorphology was likely a stronger predictor of GHG fluxes at the watershed scale than temperature and stream chemistry variables, at least within the confine of one watershed. In lieu of statistical approaches relying on environmental variables to predict GHG fluxes at the watershed scale, geomorphological approaches, potentially coupled with seasonal comparisons of GHG fluxes in each land class, might therefore be a promising research avenue to provide solid watershed wide estimates of GHG fluxes.
Keywords
Greenhouse gases, Forest soils, Carbon dioxide, Methane, Nitrous oxide, Geomorphology
Introduction
A comprehensive understanding of soil contributions to atmospheric greenhouse gas (CO2, CH4, and N2O) concentrations is necessary to refine estimates of greenhouse gas (GHG) budgets. Globally, CO2 fluxes from soils are primarily driven by microbial and autotrophic respiration [1]. In contrast, CH4 can be consumed through methane oxidation (under aerobic conditions) or produced via methanogenesis primarily in wetlands under anoxic conditions [2,3]. Globally, wetlands may account up to 15-40% of global CH4 emissions or ~170 Tg CH4 yr-1, while aerobic upland soils are estimated to consume approximately 30 Tg CH4 yr-1 [4,5]. Nitrous oxide emissions from soils are also significant and are thought to account for up to two-thirds of the annual global emissions annually (6.6 Tg N yr-1; Anderson, et al. [5]). Nitrous oxide is the product of denitrification (dissimilatory) and nitrification (assimilatory); the former occurring under reducing conditions and the latter occurring under aerobic conditions [6]. However, in spite of the importance of GHG emission from soils at regulating GHG concentrations in the atmosphere, few studies have fully assessed the spatial and temporal variability of GHG fluxes from forest soils at the watershed scale, resulting in uncertainty in regional and global GHG budgets [7,8].
At the soil scale, the source/sink function and the magnitude of the GHG fluxes at the soil-atmosphere interface is mainly a function of physical controls on the biogeochemical processes of soil respiration, denitrification, nitrification, methanogenesis, and methane oxidation [9]. These biogeochemical reactions are strongly influenced by soil temperature, soil moisture, and the distribution of electron donors and acceptors in the soil profile [10,11]. For instance, soil temperature and soil water content are both directly positively related to rates of aerobic respiration in the soil profile, though these relationships can vary across space and time, and can change if temperature or moisture content become too high or too low [12-14]. Abundant soil organic matter coupled with anoxic conditions result in high rates of methanogenesis and associated CH4 emissions [3]. The availability of organic carbon (i.e., organic matter) as an electron donor also often positively correlates with denitrification activity, while nitrate concentration and soil temperature often positively correlate with N2O emissions [15].
At the watershed scale, forest soils are recognized as both a sink and a source of CO2, CH4, and N2O [9,16], with landscape position (e.g. wetlands, hillslopes, and riparian areas) controlling much of the source/sink function at specific locations [13,17]. For instance, Riveros-Iregui and McGlynn [17] showed that soil respiration rates can be organized by the structure and morphology of the landscape (i.e., riparian zones versus hillslopes). Pacific, et al. [13] also showed that the landscape structure, along with groundwater dynamics and soil water content, influenced the rates of CO2 flux in a forested watershed in Montana, USA. Other studies indicate that upland soil environments are often CH4 sinks [18], that wetlands are large CH4 sources [19], and that riparian areas can significantly contribute to N2O fluxes [11,20]. However, in spite of the known importance of landscape position in regulating GHG emissions from forest soils, capturing the variability of gas fluxes at the soil-atmosphere interface at the watershed scale still remains a challenge due to the known variability in biogeochemical activity occurring throughout the landscape [11]. Therefore, further characterizing the relationship(s) between GHG fluxes across time, space, and landscape characteristics in northern forested watersheds is important to provide a more comprehensive understanding of the dynamics of these gas fluxes at the watershed scale [21].
Additionally, along with a detailed characterization of GHG fluxes across landscape hydrogeomorphic classes (wetlands, riparian zones, lower hillslopes, upper hillslopes), linking stream chemistry to GHG emissions at the watershed scale might be a promising research avenue to generalize GHG emissions at the soil-atmosphere interface at the watershed scale as stream chemistry is often a good indicator of dominant biogeochemical processes at the watershed scale [13,22]. Indeed, measuring soil moisture, temperature, and the distribution of various electron donors and acceptors at many locations in a watershed on a routine basis is not a reasonable approach to scale GHG emission at the watershed scale for logistical reasons (cost, man-hours...). Determining to what extent commonly measured stream chemistry parameters at the outlet of our study watershed could be used (or not) to constrain GHG emission at the watershed scale for scaling purpose therefore has the potential to significantly advance our ability to estimate GHG emission from soil for management purposes.
Our study therefore addresses the following questions: (1) How do CH4, CO2, and N2O fluxes at the soil-atmosphere interface change over time and across hydrogeomorphically distinct locations in a northern temperate forested watershed? (2) Can stream discharge, temperature, and stream chemistry be used as predictors of soil CH4, CO2, and N2O fluxes across locations in a watershed? The implications of our results for developing greenhouse gas budgets at the watershed scale are also discussed.
Materials and Methods
Study area
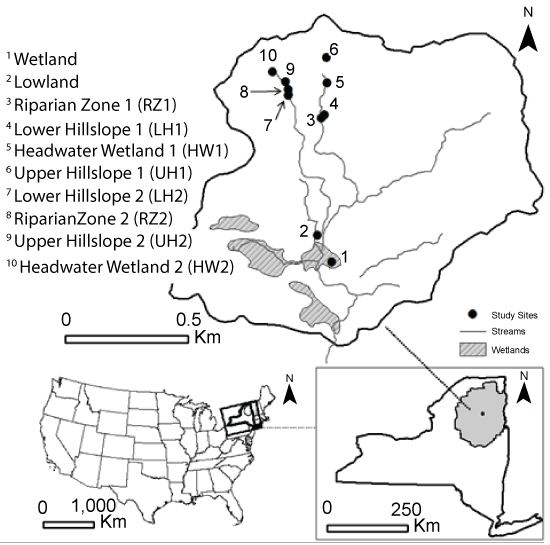
The Archer Creek Watershed (515 m above sea level, 43°59'32" N, 74°14'32" W) is a 135 ha forested catchment (1% water, 6% forested wetland, 93% forest) located in the Adirondack region of northern New York State (Figure 1). Climate is cool, moist, and continental. Between the years of 1941-2007, the mean annual temperature was 5.0 °C, the mean annual precipitation was 1046 mm, and the mean annual snowfall was 303 cm [23]. Precipitation in 2011 was 47% greater than the 30-year average, 8% less than the 30-year average in 2012, and 12% greater than the 30-year average in 2013. Snowfall was less than the 30-year average for the entire study period with 3%, 52%, and 40% less snowfall occurring in 2011, 2012, and 2013 respectively. Precipitation and air temperature were recorded at the National Atmospheric Deposition Program/National Trends Network Site (ID NY20) located in the Huntington Wildlife Forest approximately 2.0 km from the study sites (Figure 1).
From a geomorphological standpoint, the Archer Creek catchment has an average slope of 11%, and a total relief of 225 meters [23]. The surficial geology consists of glacial till composed of approximately 75% sand, and less than 10% clay [24]. Upland soils are sandy loam (Becket-Mundal series) approximately one meter thick with localized areas of deeper soil. Wetlands and valley-bottom soils are Greenwood Mucky Peats deposits 1 to 5 meters deep [25]. The lowland overstory in the Archer Creek Watershed is composed of eastern hemlock (Tsuga canadensis (L.) Carr), yellow birch (Betula alleghaniensis Britt.), speckled alder (Alnus incana (L.) Moench), red spruce (Picea rubens Sarg.), and balsam fir (Abies balsamea (L.) Mill). American beech (Fagus grandifolia Ehrh.), sugar maple (Acer saccharum Marsh.), red maple (Acer rubrum L.), yellow birch, and eastern white pine (Pinus strobus L.) dominate the upland environments [24].
Watershed hydrology and stream water chemistry data
Discharge data for Archer Creek (15 min. interval) were calculated for the outlet of Archer Creek watershed where stage height is recorded as part of the on-going long-term monitoring program of the watershed initially described in Mitchell, et al. [23]. One day (1dQ), 3-day (3dQ) and 7-day (7dQ) antecedent flow conditions at the outlet of the Archer Creek watershed were used as proxies for antecedent moisture conditions in the watershed and calculated as the mean discharge 1, 3, and 7 days before each sampling date [26]. Stream dissolved organic carbon (DOC) and nitrate (NO3-) concentrationsat the Archer Creek H-Flume were collected weekly as part of the on-going long-term monitoring program described above.
Greenhouse gas sampling and analysis
Instead of using a traditional statistically based sampling design (e.g. power analysis, random sampling) that would require sampling many areas of the watershed and render our study undoable for logistical reasons (access, cost), we used a geomorphologically driven sampling design (see below) based on the fact that previous studies have shown that such approaches can be suitable to generalize GHG emission estimates at the watershed scale [13,17]. Ten sampling locations corresponding to a variety of landscape hydrogeomorphic classes (palustrine wetland, lowlands, riparian zones, upper and lower hillslopes, and headwater wetlands; Figure 1) were therefore identified throughout the Archer Creek Watershed for greenhouse gas (GHG) sampling at the soil-atmosphere interface.
The lowland was located in a gently sloping area near the palustrine wetland. The riparian zone locations were located immediately adjacent to headwater streams, while the headwater wetlands were located near the source of the two streams used in this study (Figure 1). The upper hillslope sites were located on generally steep terrain (> 20% slope) while the lower hillslope sites were located downstream of the headwater sites on more moderate slopes (< 20% slope). At each of these sites, greenhouse gas (CO2, CH4, N2O) sampling occurred 19 times during the 2011, 2012, and 2013 snow free seasons, with an additional three winter sampling days in January, February, and March of 2013. Gas samples for GHG flux calculations at the soil-atmosphere interface were collected using 6 static chambers per site, for a total of 60 chambers (Figure 1). Static chambers are commonly used for GHG flux estimates at specific times and places, and have the advantage of being disconnected from atmospheric flow, which is critical for accurate flux measurements at the soil-atmosphere interface [27]. Static chambers were made of PVC material, and consisted of two parts: a bottom section (37 cm height and 27 cm diameter) inserted 10 cm into the ground, and an airtight lid fitted with a gas sampling port [28]. At the time of sampling, soil temperature was recorded at each sampling location 5 cm below the soil surface using a portable Hanna® pH/ORP/temperature meter (Model HI 9125, Hanna Instrument Inc., Woonsocket, Rhode Island, USA). When sampling, the chambers were closed with a lid and headspace gas concentrations measured 3 times over 50 min. Air samples (~15 mL) were stored in evacuated vials (10 mL) fitted with gray butyl rubber septa. GHG fluxes (F) were computed as:
Where dC/dt is the rate of change in GHG concentration inside the chamber (mass GHG m3 air per min), V is the chamber volume (m3), A is the area circumscribed by the chamber (m2), and k is a unit conversion factor (1,440 min/day) [27]. Winter sampling was carried out following the same protocol, except that snow was removed by hand from each chamber immediately before the airtight lid was placed onto the chamber, and the snow was returned into the chamber immediately after sampling. Samples were kept out of the light during transport and storage periods, and were usually analyzed within two weeks of collection. Carbon dioxide, CH4, and N2O concentrations were analyzed utilizing a Shimadzu GC-2014® gas chromatograph (Shimadzu Corporation, Kyoto, Japan.) equipped with a flame ionizing detector and an electron capture detector interfaced with a CombiPal® autosampler (LEAP Technologies, Carrboro, North Carolina). The stationary phase consisted of a Porapak Q® precolumn (90 cm long) and Hayesep D® analytical columns (180 cm long). The GC was calibrated using standard gases obtained from Alltech (Deerfield, Illinois). To prevent moisture buildup in the GC columns, the GC oven was heated (150 °C) for 15 min for every 20 samples.
We tested for the importance of sampling time on daily soil GHG flux estimates by conducting four intensive sampling campaigns (5 hour intervals over a 24 hour period) on September 6 and October 20, 2012, and June 6 and July 16, 2013, at one chamber per site (for logistical reasons) at sites RZ1, LH1, RZ2, LH2, HW2 and UH2 (Figure 1). Carbon dioxide, CH4, and N2O fluxes varied over a 24-hour period, however, sampling time did not consistently affect flux estimates.
Data analysis
Because of the high spatial heterogeneity of GHG emission within each site (e.g. RZ1, LH1, RZ2, LH2, HW2), CO2, CH4, and N2O fluxes at each site (for each sampling date) were determined by taking the median flux of the six chambers at each site for each sampling date [20,29]; however, when multiple dates were aggregated to identify either annual or seasonal average, the arithmetic mean of GHG fluxes for each site and each date was used. For inter-site comparison purposes, a Kruskal-Wallis test was used to compare median fluxes of CH4, CO2, and N2O among the 10 study sites. If a significant Kruskal-Wallis statistic (p < 0.05) was observed, pairwise differences among the 10 study sites were evaluated using the Two Sample Mann-Whitney test. Spearman rank correlation analysis [30] was used to assess relationships between CO2, CH4, or N2O flux at each site with soil temperature, stream nitrate (NO3-), stream dissolved organic carbon (DOC), and antecedent flow conditions (1dQ, 3dQ, and 7dQ).
Results
Watershed hydrology and stream water chemistry
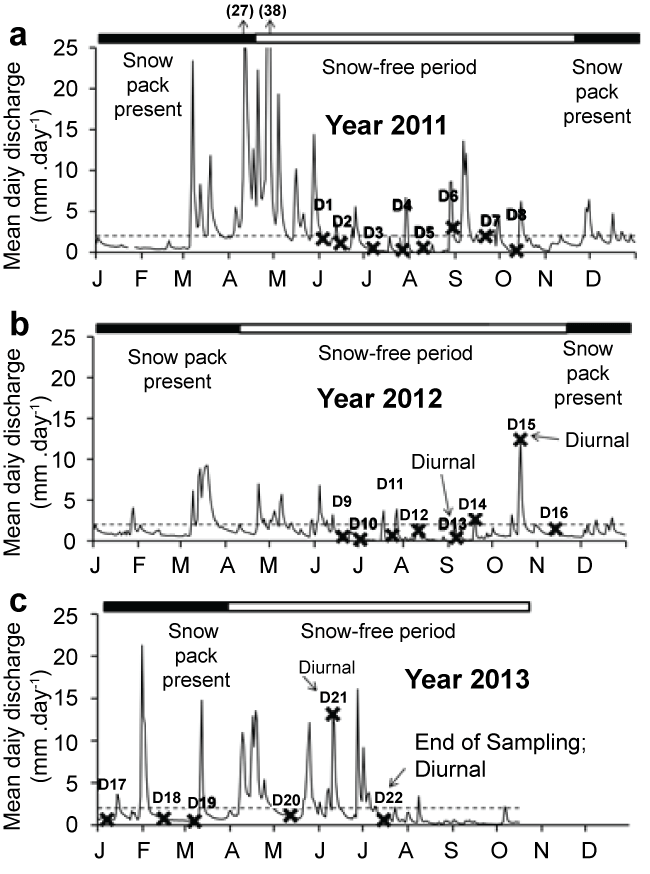
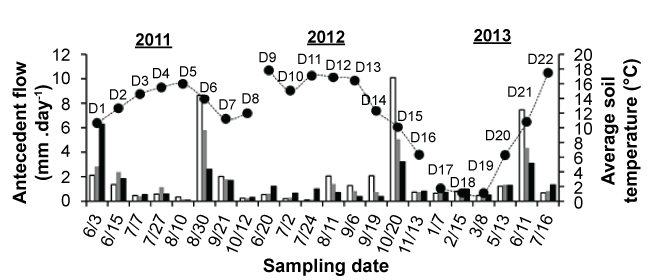
Over the course of the study, the specific discharge at the Archer Creek outlet was 2.02 mmd-1 (Figure 2). Most sampling dates (18 out of 21) occurred at time when stream flow was below 2.02 mmd-1. On three occasions (D6, D15, D21), sampling occurred following intense storm events as observed by a sharp decrease in antecedent flow conditions in the days preceding sampling (i.e., 7dQ > 3dQ > 1dQ) (Figure 3).
Soil temperature varied seasonally with winter (January, February, March) temperatures below 4 °C, and spring (April, May, June) and autumn (October, November, December) temperatures between 4 °C to 14 °C. Summer soil temperatures (July, August, September) were higher and varied between 14 °C to 18 °C. During winter sampling, soils were not frozen on D17 (January 7, 2013) and were generally frozen at the surface on D18 (February 15, 2013) except at the HW1 sitedue to relatively warm discharging groundwater in the vicinity. The LH1, HW1, UH2, and LH2 sites remained unfrozen on D19 (March 8, 2013), while the soils at the other sites were frozen on this date. Snowpack depth ranged from 20-61 cm with an average depth of 41 cm throughout the D17, D18, and D19 field sampling dates.
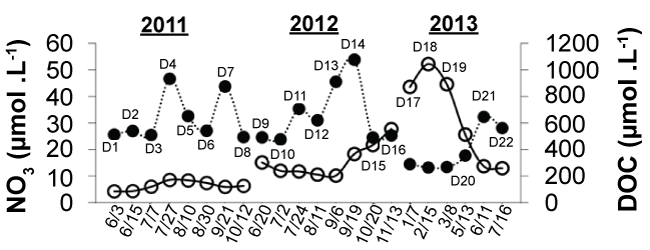
Over the study period, stream DOC concentrations at the Archer Creek outlet ranged from 264.0 to 1076.4 μmolCL-1 (3.16 to 12.92 mgCL-1), and NO3- concentrations ranged from 4.30 to 52 μmol NO3- L-1 (0.06-0.73 mg N L-1) (Figure 4). In spring, summer, and fall 2011 and spring and summer 2012, NO3- concentrations generally remained below 20 μmolL-1 (0.28 mgL-1). However, NO3- concentration increased through Fall 2012, and peaked during winter 2013 (D17, D18, and D19). The winter peak in NO3- concentrations (52.0 μmol NO3- L-1 or 7.28 mg NO3- L-1) coincided with a clear decline in DOC concentrations to 264 μmolL-1 (3.16 mgL-1) from a high of 1080 μmolL-1 (12.9 mgL-1) in September 2012 (D14). Average stream DOC concentration over the study period was 578 μmolL-1 (6.9 mgCL-1).
Variation of GHG fluxes across landscape positions
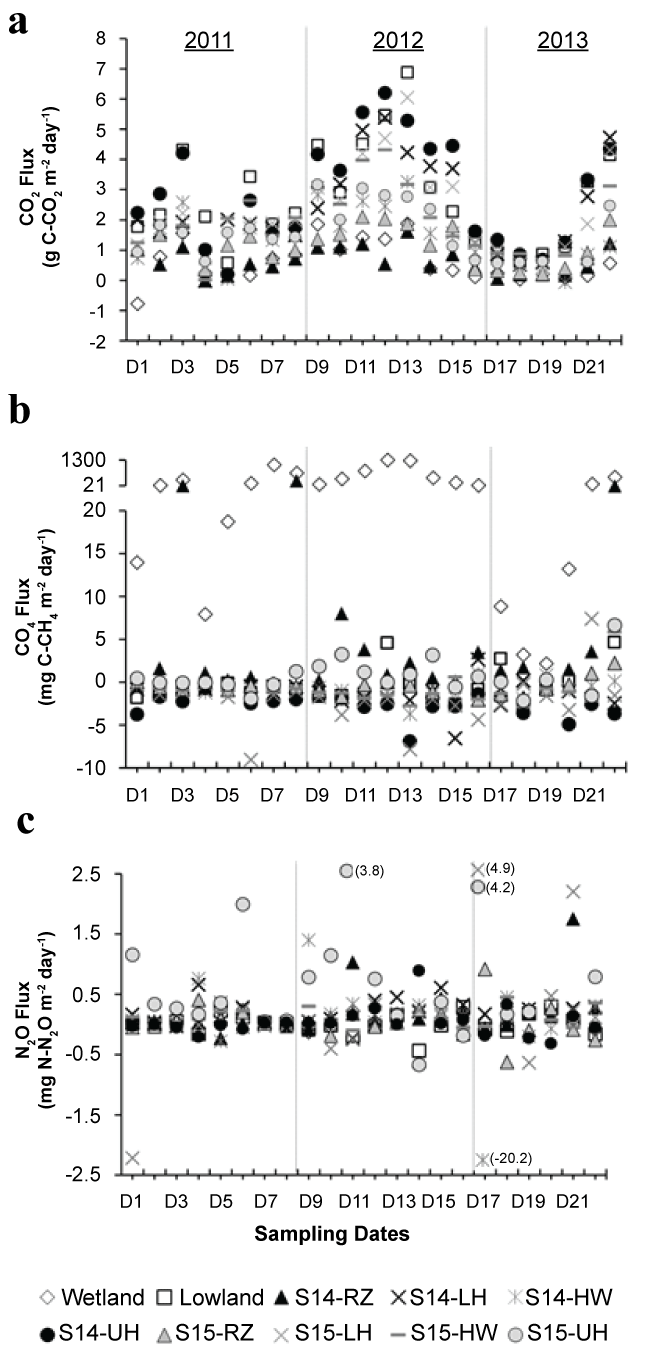
During the duration of the study, CO2 fluxes at the soil-atmosphere interface were generally positive (Table 1), although negative values were observed on specific dates/locations (Figure 5A). Mean CO2 fluxes among the sampling sites during the winter sampling dates D17, D18, and D19 were significantly smaller and less variable (0.02 to 1.34 g C-CO2 m-2day-1) than during the remainder of the year (-0.77 to 6.87 g C-CO2 m-2day-1). When sites were compared, the lowland, LH1, UH1, and LH2 sites presented mean (across dates) CO2 fluxes greater than 2 g C-CO2 m-2d-1 over the study period, while mean CO2 fluxes at the wetland and RZ1 site were less than 1 g C-CO2 m-2d-1 (Table 1). Other sites (HW1, RZ2, HW2, and UH2) presented intermediary CO2 flux values between 1 and 2 g C-CO2 m-2d-1. Overall, CO2 fluxes varied significantly across the ten study sites (χ2 (9,N = 219) = 73.43; p < 0.0001) with pairwise comparisons resulting in significantly different median CO2 fluxes (using α = 0.05) for most site pairs. The only exceptions were the lowland, LH1, UH1, and LH2 sites for which no differences in CO2 fluxes were observed (p < 0.05). The following sites also showed no significant differences (p < 0.05) between one another in term of CO2 fluxes: the wetland and the RZ1 site, the LH2 and HW2 sites, and the HW2 and UH2 sites.
Methane (CH4) fluxes at the soil-atmosphere interface were consistently positive at the wetland site (range: 2.2 to 1293 mg Cm-2d-1), with the largest fluxes occurring in the summer and early autumn (July through October). Relatively low fluxes below 15 mgCm-2d-1 at the wetland site occurred in the winter (D17, D18, D19), and each spring (D1, D4, D20). Positive CH4 fluxes were also observed at the RZ1 site for 18 of the 22 sampling dates, with a temporal pattern similar to the one observed in the wetland site. At the other sampling locations, CH4 fluxes were generally negative on most dates (Figure 5). When sites were compared, the average study period CH4 flux at the wetland site (330 mgCm-2d-1; RSD 127%) was two orders of magnitude higher than the average CH4 flux at any other site. A Kruskal-Wallis test indicated that CH4 fluxes differed significantly across the ten study sites (χ2 (9,219) = 130; p < 0.0001). Wetland CH4 fluxes differed significantly from each of the other study sites (α < 0.05), while the lowland, LH1, UH1, and LH2 had similar median fluxes.
Soil N2O fluxes generally ranged from -0.5 to 0.5 mg N m-2d-1 for most of the study period (Figure 5). Both the highest (4.9 mg N m-2d-1 at the LH2 site) and the lowest (-20.2 mg N m-2d-1 at the HW1) observed values across all sites during the study occurred on the same date (D17-January 7, 2013). Over the study period, pairwise comparisons resulted in significantly different median N2O fluxes (α = 0.05) between most locations, except between the RZ1, RZ2, HW1, and HW2 sites. The median wetland and lowland fluxes were also not statistically different from each other either.
Relationships between CO2, CH4, and N2O fluxes and watershed conditions
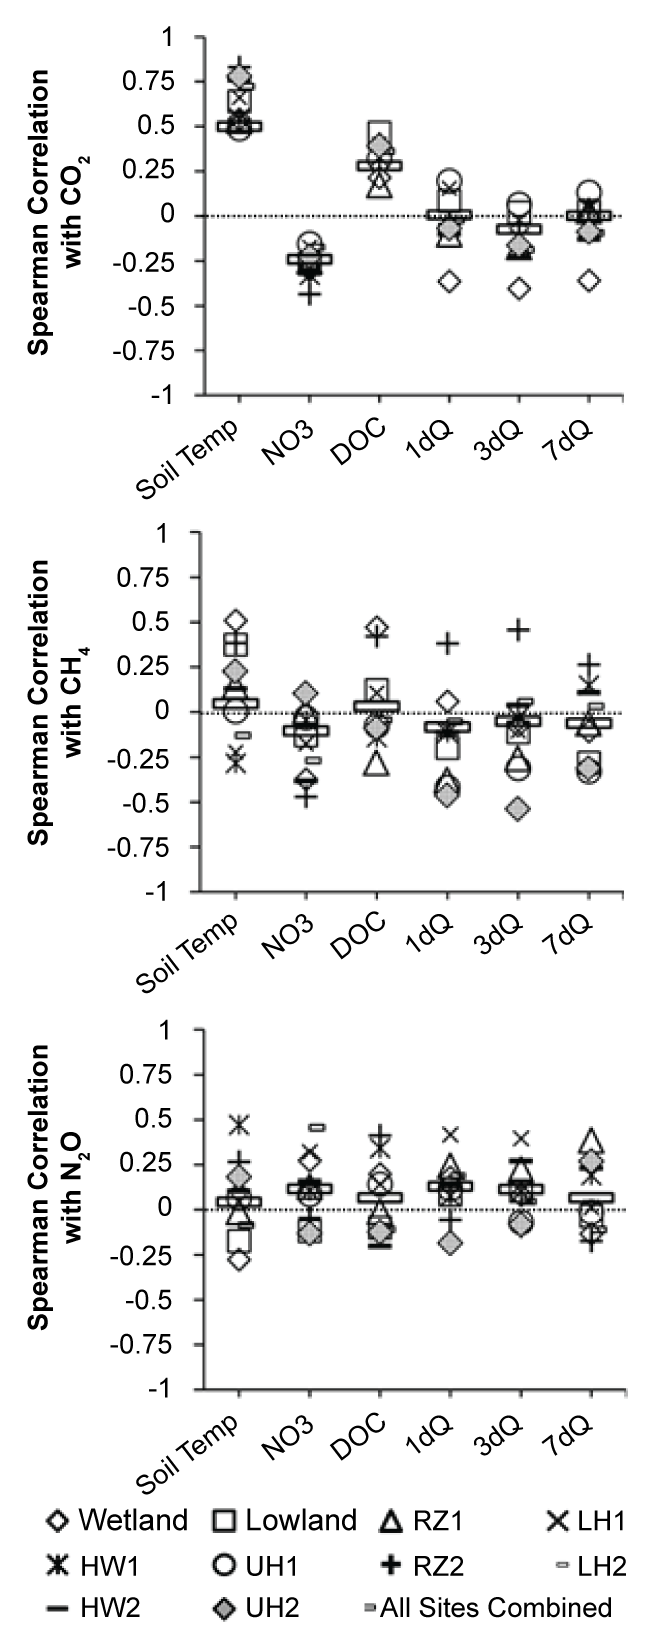
Over the study period, CO2 flux was positively correlated with temperature both on a site-by-site basis (r = 0.47 to 0.83; all p < 0.05; Figure 6) and across all locations(r = 0.50, n = 203, p < 0.001). With respect to NO3-, it was only when all sampling dates were grouped together (n = 203) that CO2 fluxes were significantly correlated to stream NO3- (r = -0.24, n = 203, p < 0.05) and DOC (r = 0.28, n = 203, p < 0.05). No significant correlation was observed between antecedent flow conditions and CO2 fluxes at any of the sites. As for CH4 and N2O, temperature was significantly correlated with CH4 flux at the wetland site (r = 0.51, n = 20, p < 0.05), and to N2O (r = 0.47, n = 20, p < 0.05) at the HW1 site. However, no significant correlations were observed between N2O and temperature (except at the HW1 site) or 1dQ, 3dQ, and 7dQ at any of the sites. Antecedent flow conditions were also generally not significantly correlated to CH4 except at the UH2 site (r = -0.46 with 1dQ, r = -0.54 with 3dQ) and the RZ2 site (r = 0.46 with 3dQ). Methane fluxes were only significantly correlated to NO3- at the RZ2 site (r = -0.47) and to DOC at the wetland (r = 0.47, n = 203, p < 0.05) and RZ2 (r = 0.42, n = 22, p < 0.05) sites. Nitrous oxide flux was significantly correlated with NO3- concentrations only at the LH2 site (r = 0.45 n = 21, p < 0.05), but was not related to DOC stream concentrations.
Discussion
Impact of landscape position on overall CH4, CO2, and N2O fluxes at the soil-atmosphere interface
The CO2 fluxes reported across the range of hydrogeomorphic locations studied here are consistent with other studies. For instance, CO2 fluxes reported here are comparable to those reported in a northern Rocky Mountain watershed (2.7 to 18.07 gCm-2d-1) [17] and similar to those reported during the growing season in the Harvard Forest, MA, USA (0.84 to 2.88 gCm-2d-1) [31]. On a site by site basis, CO2 emissions from the hillslope sites are consistent with those reported by Ullah and Moore [16] for well-drained soils in a deciduous forest in eastern Canada (1.4 to 2.9 gCm-2d-1). From a biogeochemical process standpoint, the riparian zone and wetland soils had the smallest average fluxes of CO2 across the study period, which is consistent with depressed aerobic respiration compared to the other sites owing to high soil moisture at these sites, and CO2 consumption via methanogenesis [12,19,32]. In contrast, the hillslope and lowland soils consistently had the largest amounts of CO2 per unit area, which is consistent with aerobic, yet moist conditions, observed at these sites over the duration of the study. Fluxes of CO2 from headwater wetlands, which were at times either saturated or near saturated (field observations), presented intermediate CO2 values. These moderate fluxes in headwater wetlands may be attributed to a combination of periods of low moisture during which soils were drier and aerobic (higher flux) and periods of high moisture conditions when soils were saturated and anaerobic (lower flux).
Local hydrologic and geomorphic conditions also played an important role at regulating CH4 fluxes across the forest landscape. For instance, wetlands and seasonally saturated soils were CH4 sources, while upland and well-drained soils were CH4 sinks, which is consistent with our current understanding of the impact of landscape geomorphology on CH4 emission and results published in other studies [3,16,33]. More specifically, the wetland site exhibited an average CH4 flux of 330.34 (RSD 127%) mgCm-2d-1, which is approximately three times the average global flux estimated by Turetsky, et al. [33] from a study of boreal, temperate and subtropical wetlands, but lower than CH4 fluxes (> 5,000 mgCm-2d-1) reported for temperate peatlands in the same study. The CH4 fluxes observed at the RZ1 site (16.17 mgCm-2d-1) where organic rich mucky soils dominated are consistentwith values reported by Morse, et al. [3] in restored agricultural wetlands (range: 16.2 to 21.6 mgCm-2d-1). Methane fluxes at sites others than the Wetland or RZ1 sites were negative (-2.53 to -0.54 mgCm-2d-1), which is consistent with fluxes reported in forested hillslope sites in eastern Canada (-1.7 ± 0.1 mgCm-2d-1) [16] and with the aerobic conditions and associated CH4 oxidation often observed in well drained forested soils [18]. The only exception is the upper hillslope 2 site (UH2), which had a slightly positive CH4 flux (0.51 mgCm-2d-1).
Unlike CO2 and CH4, no relationship could be established between N2O fluxes and landscape position in our study (Table 1). Such heterogeneity in N2O fluxes has been highlighted by othersand tied to the fact that both nitrification (under aerobic conditions) and denitrification (under anaerobic conditions) can lead to N2O production [19,34]. Our results are nevertheless consistent with values reported from mixed deciduous forests in the eastern USA [27], and an infrequently flooded riparian forest in Indiana, USA [35].
Impact of seasonality on CH4, CO2, and N2O fluxes at the soil-atmosphere interface
Higher CO2 and CH4 fluxes during the summer, and lower fluxes during winter and spring, are consistent with prior studies that indicated the importance of temperature-mediated controls on respiration and methanogenesis [16,34]. In the rare cases when relatively low CO2 fluxes occurred in summer during warm conditions (> 15 °C), those were concomitant with relatively dry periods (low antecedent flow), suggesting that moisture could become a limiting factor to CO2 production in summer. This is consistent with results reported by Riveros-Iregui, et al. [36] in a forested watershed in Montana showing that moisture can become a limiting factor for CO2 flux rates by regulating the amount of microbial activity occurring in the soil profile. With respect to CH4, highest CH4 fluxes occurred on summer/fall dates with high antecedent flow conditions (D7, D12, and D13), which again is consistent with other studies showing that warm temperature along with high antecedent moisture conditions are both needed for very high CH4 emissions to occur [3,29,34] .
Unlike for CO2 and CH4, no seasonal patterns were observedfor N2O fluxes, which may be due to fine-scale temporal variability in the watershed conditions affecting both nitrification and denitrification [37]. Vidon, et al. [34] also observed a lack of clear seasonal patterns in N2O flux in a restored wetland in Indiana, USA. However, unlike several studies that found increases in N2O flux after intense re-wetting events [3,34,34] , we observed no significant statistical or consistent qualitative relationships between N2O fluxes and antecedent flow conditions across the sites.
Impact of temperature, stream discharge, and stream chemistry on CH4, CO2, and N2O fluxes
The soil temperature-CO2 relationship over the study period (r = 0.50, n = 203, p < 0.001) indicated in our results is consistent with the CO2 flux-temperature relationships found at the Harvard forest in Massachusetts, USA [12], and in a mixed hardwood forest in Korea [38], suggesting that temperature correlations with CO2 flux can be useful in assessing possible behaviors of forest soils in response to changing temperature conditions. The stronger CO2-temperature correlations observed at some sites (e.g. r = 0.83, n = 21, p < 0.05 at the RZ2 site) are consistent with a study in Montana showing that the explanatory power of a CO2-temperatue regression analysis is often muted when considered across the watershed scale compared to individual sites [13]. The lack of significant correlation between CO2 and 1dQ, 3dQ or 7dQ at any location suggests that, at least for our study period, moisture was unlikely to be a strong limiting factor for aerobic respiration. However, the significant correlations between CO2 fluxes across all sites over the study period and DOC (r = 0.28, n = 203, p < 0.05) and NO3- (r = -0.24, n = 203, p < 0.05) suggest that stream water quality does have an impact of overall CO2 fluxes at the watershed scale.
At sites where CH4 fluxes were negative, temperature was not significantly correlated to CH4 fluxes, but temperature was significantly correlated to CH4 at the wetland site (r = 0.51, n = 20, p < 0.05). This suggests that in locations where large CH4 fluxes due to methanogenesis dominate (e.g. peatlands), CH4-temperature regression curves might be a suitable tool to help generalizing CH4 emissions at the landscape scale, but that such relationships are less likely to help constrain CH4 emissions in complex landscapes where both methane oxidation and methanogenesis actively occur. Similarly, although our analysis of seasonality illustrates the need for both high temperature (summer) and high moisture conditions (wetlands) to co-occur for the highest CH4 fluxes to occur, antecedent moisture conditions were not a strong predictor for CH4 fluxes across the watershed. The lack of significant correlation between N2O and either temperature or antecedent moisture conditions is consistent with other studies showing somewhat erratic N2O flux patterns due to fine-scale temporal variability in the watershed conditions affecting both nitrification and denitrification [37]. These results suggest that much more research is needed to identify landscape scale variables capable of predicting N2O fluxes at the watershed scale in a variety of landscapes.
Implications for GHG budget estimation at the watershed scale and conclusions
Our study indicates that estimating N2O fluxes at the watershed scale remains a challenge, as neither landscape geomorphology nor environmental conditions (temperature, water chemistry, and antecedent flow conditions) appear to be strong predictors of N2O emissions. However, our results indicate that temperature for CO2, and to some extent stream NO3- and DOC for CO2 at the watershed scale, were significantly correlated to CO2 fluxes. Similarly, in the wetland (high organic carbon content, anaerobic conditions), the significant positive correlation between CH4 and soil temperature suggests that temperature could be used to constrain CH4 emissions at such locations. However, data suggest that landscape geomorphology based approaches likely hold more promise than temperature or stream chemistry based approaches as tools to scale up CO2 and CH4 point flux measurements for GHG budget development at the watershed scale. Indeed, as indicated in the results, strong differences in CO2 and CH4 fluxes related to landscape geomorphology were observed (e.g. wetlands vs. other locations for CH4; low riparian and wetland CO2 fluxes compared to those at other locations, etc), and the magnitude of these differences exceeded the magnitude of seasonal variations for CO2 and CH4 fluxes (Figure 5 and Table 1), and this, in spite of the potential importance of temperature at regulating CO2 across the watershed and CH4 fluxes in the wetland (Figure 6). This indicates that landscape hydrogeomorphology is likely a stronger predictor of GHG fluxes at the watershed scale than environmental variables (temperature and stream chemistry), at least within the confine of one watershed.As we reach this conclusion, it is important to note that we understand that on a site-by-site basis, alternative approaches such as measuring soil moisture, temperature, and the distribution of various electron donors and acceptors at individual locations where GHG fluxes are measured may allow for the development of predictive relationships on a case-by-case basis. However, such approaches are not suitable for scaling purposes for logistical reasons (cost, man-hours...). We therefore propose that landscape based approaches aimed at identifying the relative importance of land classes (e.g. wetland versus riparian zone versus hillslope), potentially coupled with long-term analyses of the influences of seasonality on GHG emissions in each land class, are likely to lead to the best results in determining the long-term contributions of forest soils to GHG emissions at the watershed scale. In a companion paper [39], we therefore explore how GHG budgets can be developed for a whole watershed based on a geomorphic classification of the landscape (beyond the scope of this paper), so this study investigating the relative importance of landscape position/geomorphology and environmental variables (temperature, stream chemistry) at predicting GHG emission at the watershed scale can significantly advance our ability to scale up point measurements of GHG emission to a whole watershed. In that paper, we also demonstrate that the N2O fluxes presented here only represent a couple percentage points of total N2O, CO2 and CH4 emissions (in CO2 equivalent) at the watershed scale, and that our limited ability to solidly predict N2O fluxes at the landscape scale is therefore unlikely to affect overall estimates of GHG production (in CO2 equivalent) at the soil-atmosphere interface at the watershed scale.
Acknowledgements
This project was supported by a USDA McIntire-Stennis Formula Grant (award # NYZ-2611-20-001) to P. Vidon, M. Mitchell, and C. Beier. The support of NYSERDA in providing funds for the monitoring at the Arbutus Watershed and Huntington Forest is also greatly appreciated. The authors would also like to thank Pat McHale, SatishSerchan, Cheryl Glor, and the staff of the Adirondack Ecological Center in Newcomb, NY, for help in the field and laboratory.
References
- Changsheng LI (2007) Quantifying greenhouse gas emissions from soils: Scientific basis and modeling approach. Soil Scie Plant Nutri 53: 344-352.
- Groffman PM, RV Pouyat (2009) Methane uptake in urban forests and lawns. Environ Sci Technol 43: 5229-5235.
- Morse JL, Ardón M, Bernhardt ES (2012) Greenhouse gas fluxes in southeastern US coastal plain wetlands under contrasting land uses. Ecol Applic 22: 264-280.
- Forster P, Ramaswamy V, Artaxo P, et al. (2007) Changes in atmospheric constituents and in radiative forcing. 129-234.
- Brian Anderson, Karen B Bartlet, Steve Frolking, et al. (2010) Methane and nitrous oxide emissions from natural sources. United States Environmental Protection Agency.
- Hefting MM, R Bobbink, H de Caluwe (2003) Nitrous oxide emission and denitrification in chronically nitrate-loaded riparian buffer zones. J Environ Qual 32: 1194-1203.
- Hashimoto S (2012) A New Estimation of Global Soil Greenhouse Gas Fluxes Using a Simple Data-Oriented Model. PLoS One 7: e41962.
- IPCC (2013) Climate Change 2013: The Physical Science Basis. Contribution of Working Group I to the Fifth Assessment Report of the Intergovernmental Panel on Climate Change. In: Stocker TF, D Qin, GK Plattner, et al. Climate Change 2013 ‑ The Physical Science Basis. Cambridge University Press, Cambridge, USA, 1535.
- Smith K, Ball T, Conen F, et al. (2003) Exchange of greenhouse gases between soil and atmosphere: interactions of soil physical factors and biological processes. Europ J Soil Scie 54: 779-791.
- Lars O Hedin, Joseph C von Fischer, Nathaniel E Ostrom, et al. (1998) Thermodynamic constraints on nitrogen transformations and other biogeochemical processes at soil-stream interfaces. Ecology 79: 684-703.
- Philippe Vidon, Craig Allan, Douglas Burns, et al. (2010) Hot spots and hot moments in riparian zones: Potential for improved water quality management. J Amer Wat Resour Assoc 46: 278-298.
- EriC A Davidson, Elizabeth Belk, Richard D Boone (1998) Soil water content and temperature as independent or confounded factors controlling soil respiration in a temperate mixed hardwood forest. Global Change Biol 4: 217-227.
- Vincent J Pacific, Brian L McGlynn, Diego A Riveros-Iregui, et al. (2010) Landscape structure, groundwater dynamics, and soil water content influence soil respiration across riparian-hillslope transitions in the Tenderfoot Creek Experimental Forest, Montana. Hydrol Process 25: 811-827.
- Raich JW, WH Schlesinger (1992) The global carbon dioxide flux in soil respiration and its relationship to vegetation and climate. Tellus B 44: 81-99.
- Knowles R (1982) Denitrification. Microbiol Rev 46: 43-70.
- Sami Ullah, Tim R Moore (2011) Biogeochemical controls on methane, nitrous oxide, and carbon dioxide fluxes from deciduous forest soils in eastern Canada. J Geophys Research Biogeosciences 116.
- Diego A Riveros-Iregui, Brian L McGlynn (2009) Landscape structure control on soil CO2 efflux variability in complex terrain: Scaling from point observations to watershed scale fluxes. J Geophys Research Biogeoscie 114.
- Mark S Castro, Paul A Steudler, Jerry M Melillo, et al. (1995) Factors controlling atmospheric methane consumption by temperate forest soils. Global Biogeochem Cycles 9: 1-10.
- Naiman RJ, H Decamps, ME McClain (2005) Riparia: Ecology, Conservation, and Management of Streamside Communities. Elsevier Academic Press, London, United Kingdom, 430.
- K Fisher, Jacinthe PA, Vidon P, et al. (2014) Nitrous oxide emission from cropland and adjacent riparian buffers in contrasting hydrogeomorphic settings. J Environ Qual 43: 338-348.
- Colin M Beier, John C Stella, Martin Dovčiak, et al. (2012) Local climatic drivers of changes in phenology at a boreal-temperate ecotone in eastern North America. Climatic Change 115: 399-417.
- EW Boyer, GM Hornberger, KE Bencala, et al. (1997) Response characteristics of DOC flushing in an alpine catchment. Hydrol Process 11: 1635-1647.
- Mitchell MJ, DJ Raynal, CT Driscoll (2009) Response of Adirondack Ecosystems to atmospheric Pollutants and Climate Change at the Huntington Forest and Arbutus Watershed: Research Findings and Implications for Public Policy. New York State Energy Research and Development Authority (NYSERDA), New York.
- Sheila F Christopher, Blair D Page, John L Campbell, et al. (2006) Contrasting stream water NO3- and Ca2+ in two nearly adjacent catchments: the role of soil Ca and forest vegetation. Global Change Biol 12: 364-381.
- Somers RC (1986) Soil classification, genesis, morphology and variability of of soils found within the central Adirondack region of New York, State University of New York. College of Environmental Science and Forestry, Syracuse.
- LE Wagnera, P Vidona, LP Tedescoa, et al. (2008) Stream nitrate and DOC dynamics during three spring storms across land uses in glaciated landscapes of the Midwest. J Hydrol 362: 177-190.
- Jacinthe PA, Lal R (2004) Effects of soil cover and land-use on the relations flux-concentration of trace gases. Soil Scie 169: 243-259.
- Pierre-Andre Jacinthe, Warren A Dick (1997) Soil management and nitrous oxide emissions from cultivated fields in southern Ohio. Soil Tillage Research 41: 221-235.
- Jacinthe PA, Vidon P, Fisher K, et al. (2015) Soil Methane and Carbon Dioxide Fluxes from Cropland and Riparian Buffers in Different Hydrogeomorphic Settings. J Environ Qual 44: 1080-1090.
- Conover WJ (1980) Practical nonparametric statistics. (2nd edn), John Wiley and Sons, New York.
- Bowden RD, MS Castro, JM Melillo, et al. (1993) Fluxes of greenhouse gases between soils and the atmosphere in a temperate forest following a simulated hurricane blowdown. Biogeochem 21: 61-71.
- Bowden RD, KM Newkirk, GM Rullo (1998) Carbon dioxide and methane fluxes by a forest soil under laboratory-controlled moisture and temperature conditions. Soil Biol Biochem 30: 1591-1597.
- Merritt R Turetsky, Agnieszka Kotowska, Jill Bubier, et al. (2014) A synthesis of methane emissions from 71 northern, temperate, and subtropical wetlands. Global Change Biol 20: 2183-2197.
- Philippe Vidon, Pierre-Andre Jacinthe, Xiaoqiang Liu, et al. (2014) Hydrobiogeochemical controls on riparian nutrient and greenhouse gas dynamics: 10 years post-restoration. J Amer Wat Resour Assoc 50: 639-652.
- Jacinthe PA, Bills JS, Tedesco LP, et al. (2012) Nitrous Oxide Emission from Riparian Buffers in Relation to Vegetation and Flood Frequency. J Environ Qual 41: 95-105.
- Diego A Riveros-Iregui, Ryan E Emanuel, Daniel J Muth, et al. (2007) Diurnal hysteresis between soil CO2 and soil temperature is controlled by soil water content. Geophys Research Letters 34.
- Lydie Chapuis-Lardy, Nicole Wrage, Aurelie Metay, et al. (2007) Soils, a sink for N2O? A review. Global Change Biol 13: 1-17.
- Sinkyu Kang, Sueyoung Doh, Dongsun Lee, et al. (2003) Topographic and climatic controls on soil respiration in six temperate mixed‐hardwood forest slopes, Korea. Global Change Biol 9: 1427-1437.
- Gomez J, Vidon P, Gross J, et al. (2016) Estimating greenhouse gas emission at the soil-atmosphere interface on forested watersheds of the US Northeast. Environ Monit Assess 188: 295.
Corresponding Author
Philippe Vidon, Department of Forest and Natural Resources Management, State University of New York College of Environmental Science and Forestry (SUNY-ESF), 1 Forestry Drive, Syracuse, NY, 13210, USA, Tel: +315-470-4765, Fax: +315-470-6535.
Copyright
© 2017 Gomez J, et al. This is an open-access article distributed under the terms of the Creative Commons Attribution License, which permits unrestricted use, distribution, and reproduction in any medium, provided the original author and source are credited.

