Assessing and Evaluating of Ground Water Potential using Electrical Resistivity Method (Vertical Electrical Sounding Geophysical Methods) in Woldia University, North Wollo Zone, Woldia, Ethiopia
Abstract
This paper mainly studied on 'assessing and evaluating of ground water potential using electrical resistivity method (Vertical Electrical Sounding geophysical method) in Woldia University, north wollo zone, Woldia, Ethiopia. In this study, we already identified that; the availability of ground water potential and measured depth to the water table and identification of the drilling point through interpretation of the geophysical and borehole data. Geophysical data have been measured, processed, and interpreted in two dimensions using SURFER software. The results of interpretation indicated that the study area was composed of two aquifers, the first is the upper Basalt aquifer which is slightly confined between the alluvial upper and lower Massive Basalt, the second is Lower Basalt aquifer which is confined by the Tarmaber Basalt. The depth of the upper aquifer is ranging from 50 to 70m, while the depth of the lower aquifer is greater than 270m. The area is dissected by fault elements of NW-SE and NE-SW trends. Generally, the ground water potential in Woldia University has more water resources and it requires the utilization of such water potential in our community to relief the scarcity of drinking water in the area.
Abbreviations
VES: Vertical Electrical Sounding; AC: Alternative Current; DC: Direct Voltage; N-S: North-South; IGRF: International Geomagnetic Reference Field; GPS: Global Position System; NW-SE: Northwest-Southeast; SW-NE: Southwest-Northeast; NE-SW: Northeast-Southwest; Mm: Millimeter; SE: South-East; NW: North-West; Masl: Meter Above Sea Level; MER: Main Ethiopian Rift; RMS: Root Mean Square
Introduction
Water is an important and basic component of life. The need for water is strongly ascending and has diversified value and function, which is not only important for drinking purposes but is also vital for any developmental activities. Nowadays, the use and sustainability of water is getting more complex due to population growth, urbanization, and industrialization [1]. Any development is related either directly or indirectly with water for any particular purpose. Groundwater is the water found underground in the cracks (surface) and spaces in soil, sand, and rock. It is stored in and moves slowly through geologic formations of soil, sand, and rocks called aquifers (a layer of rock that can be absorbed and hold water). Groundwater will eventually come back to the surface, discharging to natural flows of water, springs (source of water), lakes (pool of liquid), or oceans, to complete the hydrologic cycle. Groundwater, which is in aquifers below the surface of the earth, is one of the Nation's most important natural resources, which is the source of about 33% of the water, county and city water departments supply to households and businesses [2]. Water potential means that a solution has free movement of water molecules. Apart from the solute concentration of water, it is also influenced by factors such as pressure, gravity & humidity. Water moves from regions of high-water potential to regions of low water potential. Pure water is more positive than the internal water potential of a plant cell because of the cytoplasm's high solute content. Based on this difference in water potential, water will move from the soil into a plant's root cells through the process of osmoses .The high amount of water on Earth (97.2%) is flowed in the oceans and seas as or salty water but only a low amount (2.8%) exists as fresh water on land. This fresh water found on land is distributed as ice caps and glaciers (very large area of ice) (76.43%), groundwater and soil moisture (21.96%), freshwater lakes (0.32%), saline lakes (0.29%) and a very small portion of it as streams in channels (0.004%) [1]. The amount of fresh water which is available for domestic, industrial, and agriculture purposes is very limited as compared to the total volume of water on planet Earth. However, it is found relatively in large amount next to that available in ice caps and glaciers. This fresh water requires less expense for purification and transport, which occurs in places where there is scarce amount of surface water supply making it to be a vital source for drinking, domestic and livestock use for rural populations including in countries like Ethiopia. Due to the above reasons, the search for deep ground water is vital as an immediate and sustainable solution to alleviate the scarcity of water for drinking and other domestic uses in heavily populated areas like Woldia town. The daily consumption of water in Woldia town is 370,000 m3 and the daily consumption of water in Woldia University is 1000 m3 to 20175 m3, but the availability of water on surface and groundwater presently is 350,000 m3 showing the coverage of water supply at around 73% [3]. Currently, there is a shortage of supply of water in the area for drinking, for agricultural and for any economic activity in the town as well as in the University, so the utilization of such water potential will resolve our problem we already faced with.
Materials and Methods
Description of the study area
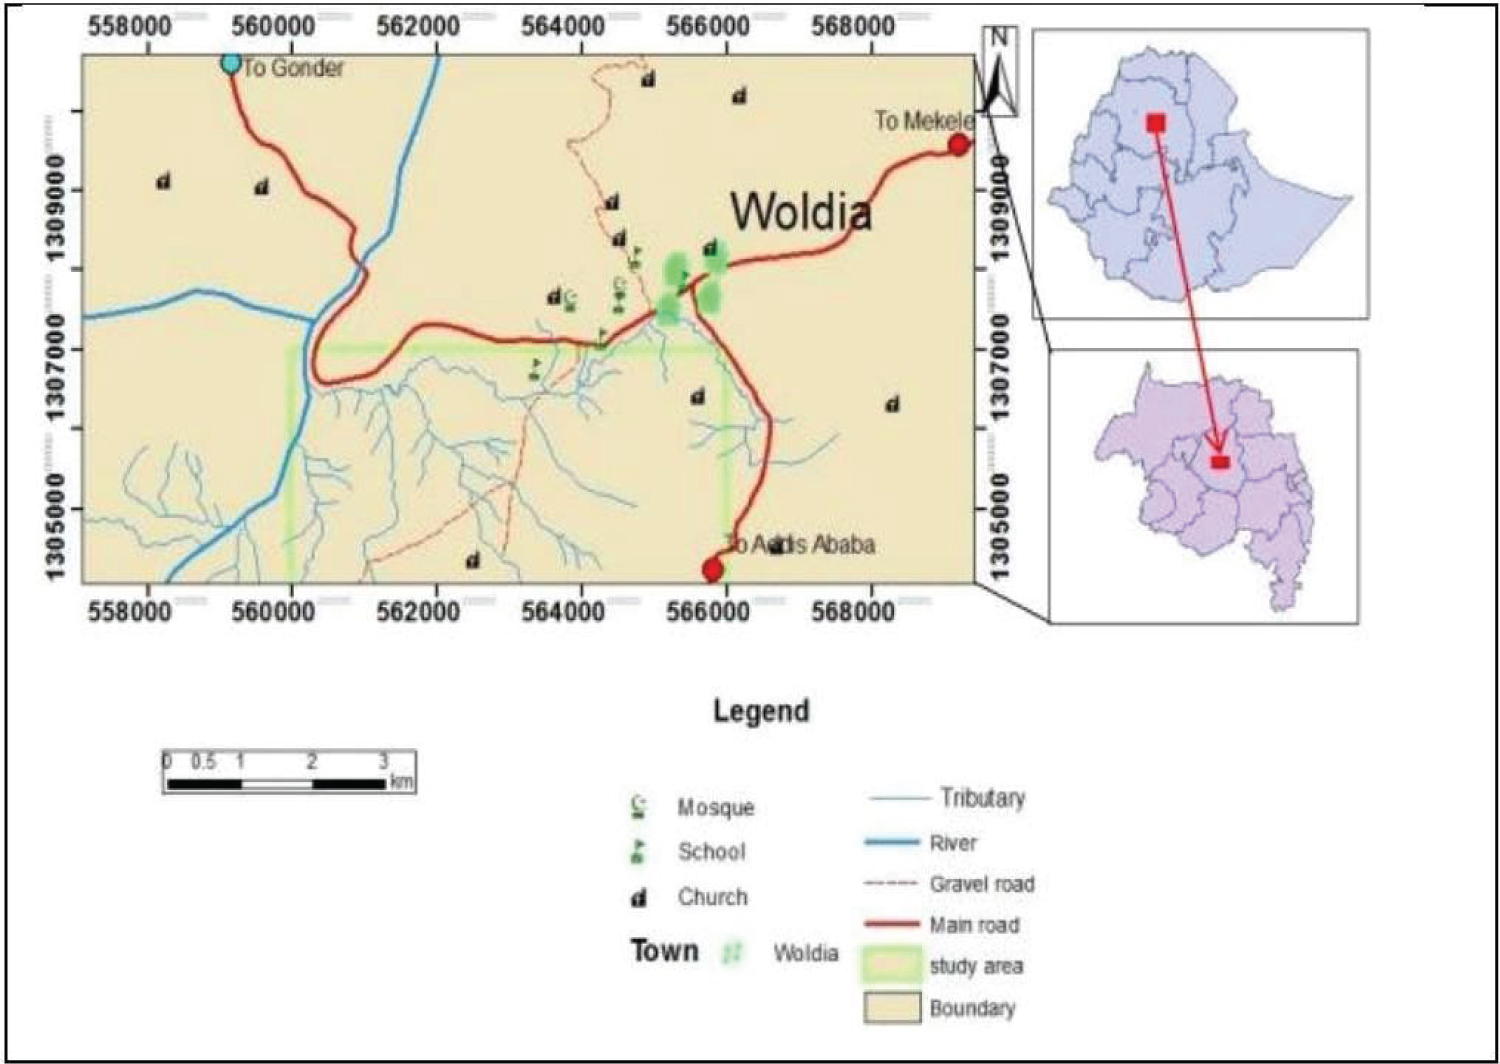
The survey was located in the central northern part of Ethiopia, currently in northern Ethiopia, zonal administration in north Wollo zone, in Woldia town and Woldia University which is far from 120 km from Dessie town and 5 km from Woldia town. It was ·composed of peasant associations lying between 11°07' 30" latitude North and 8°15'30' and 13°23' longitude, and it was the target area for rural community water development organization which has bent ground water development in the area (Figure 1).
Data source
To collect data, the primary data was observations from the study area, and secondary data was obtained (using surveying 2010 E.C look at the Appendix 1). We collected the data along three selected traverses well distributed to cover the study area. VES survey was carried out along a line oriented approximately northeast southwest within the area and observations were made at around 0.5 km sounding station spacing. A Schlumberger array with a current electrode spacing 750 m (AB/2 = 750 m) was generally used for the maximum depth of interest. A total of three (3) VES distributed on one line were surveyed in the study area with transect separation ranging from 0.5 km to1 km. Some of these VESS were located near previously drilled boreholes to obtain control during interpretation. The VES observation points were generally located at 0.5 km interval, however at places these positions were shifted approximately up to 0.25 km in line and sometimes off the transect lines to find a suitable measurement ground.
Method of data analysis
To achieve these objectives, a number of steps have been followed. These include reviewing different previous works, not only geophysical works (on groundwater exploration and identification of geological structures) but also geological and hydro-geological literatures on the study area. Finally, one geophysical method were employed in the study area: VES, method of prospecting. To collect data, the primary data was the observation in the study area and secondary data were obtained using (surveying 2010 E.C). We collected the data along three selected traverses well distributed to cover the study area. These secondary data were analyzed using appropriate software like SURFER, Auto CAD 2010, and Microsoft Excel.
Data acquisition and processing
Survey traverse selection
The organization administrator and supervision enterprise selected an area northeast of Woldia and surrounding Woldia University to be studied for groundwater resources potential. The area was planned to be studied for detailed investigation to understand the different litho logical units, ground water potential zones, geological structures, and the physical properties of subsurface rocks.
The methods chosen for the survey consist of VES geophysical techniques. In essence, the area selected due to the presence of thick alluvial sediments that occur along Tekurwuha River. Moreover, this depositional basin appears to represent a fault bounded NE-SW oriented, possibly filled with Quaternary basalt flows and recent alluvial material factors, suggesting that a good groundwater resource potential. The geophysical observations have been carried out all along the transect lines based on previous detailed geological, hydrogeological, and previous VES surveys (2010 E.C).
Data acquisition and instrumentation
Vertical electrical sounding
VES survey was carried out along a line oriented approximately northeast southwest within the area and observations were made at around 0.5 km sounding station spacing. A Schlumberger array with a current electrode spacing 750m (AB/2 = 750m) was generally used for the maximum depth of interest. A total of three (3) VES distributed on one line were surveyed in the study area with transect separation ranging from 0.5 km to1 km. Some of these VESS were located near previously drilled boreholes to obtain control during interpretation. The VES observation points were generally located at 0.5 km interval, however at places these positions were shifted approximately up to 0.25 km in line and sometimes off the transect lines to find a suitable measurement ground.
The instrument employed for the Vertical Electrical Sounding (VES) survey was the Super sting R1 electrical resistivity unit having a maximum current output of 2A. Handheld GPS was used to record the sounding point locations. The apparent resistivity for different electrode spacing and the location of VES points were recorded. Data quality was controlled by concurrently plotting and examining the VES data in the field. The spread directions were fully recorded and these were used during the data processing sessions for anisotropic correction purposes.
Data reduction and processing
VES Data reduction and processing
VES data reduction: The apparent resistivity values are mapped on logarithmic transparent paper. In processing of the collected data, the apparent resistivity value on the ordinates and the electrode separation (AB/2) on the abscissa (horizontal coordinate of points), the resistivity measurements were made by progressively increasing the potential electrode distance (MN) for relatively large increment of the current electrode distance (AB/2). In most cases, the sounding curve is segmented due to overlap measurement and cannot be interpreted as it is. To have precise interpretation, the segmented curves were shifted to small MN curve points, so that the effect could be quantified and corrections could be made to obtain a single smooth curve that could be processed by the computer using IP2WIN and WIN RESIST software [4].
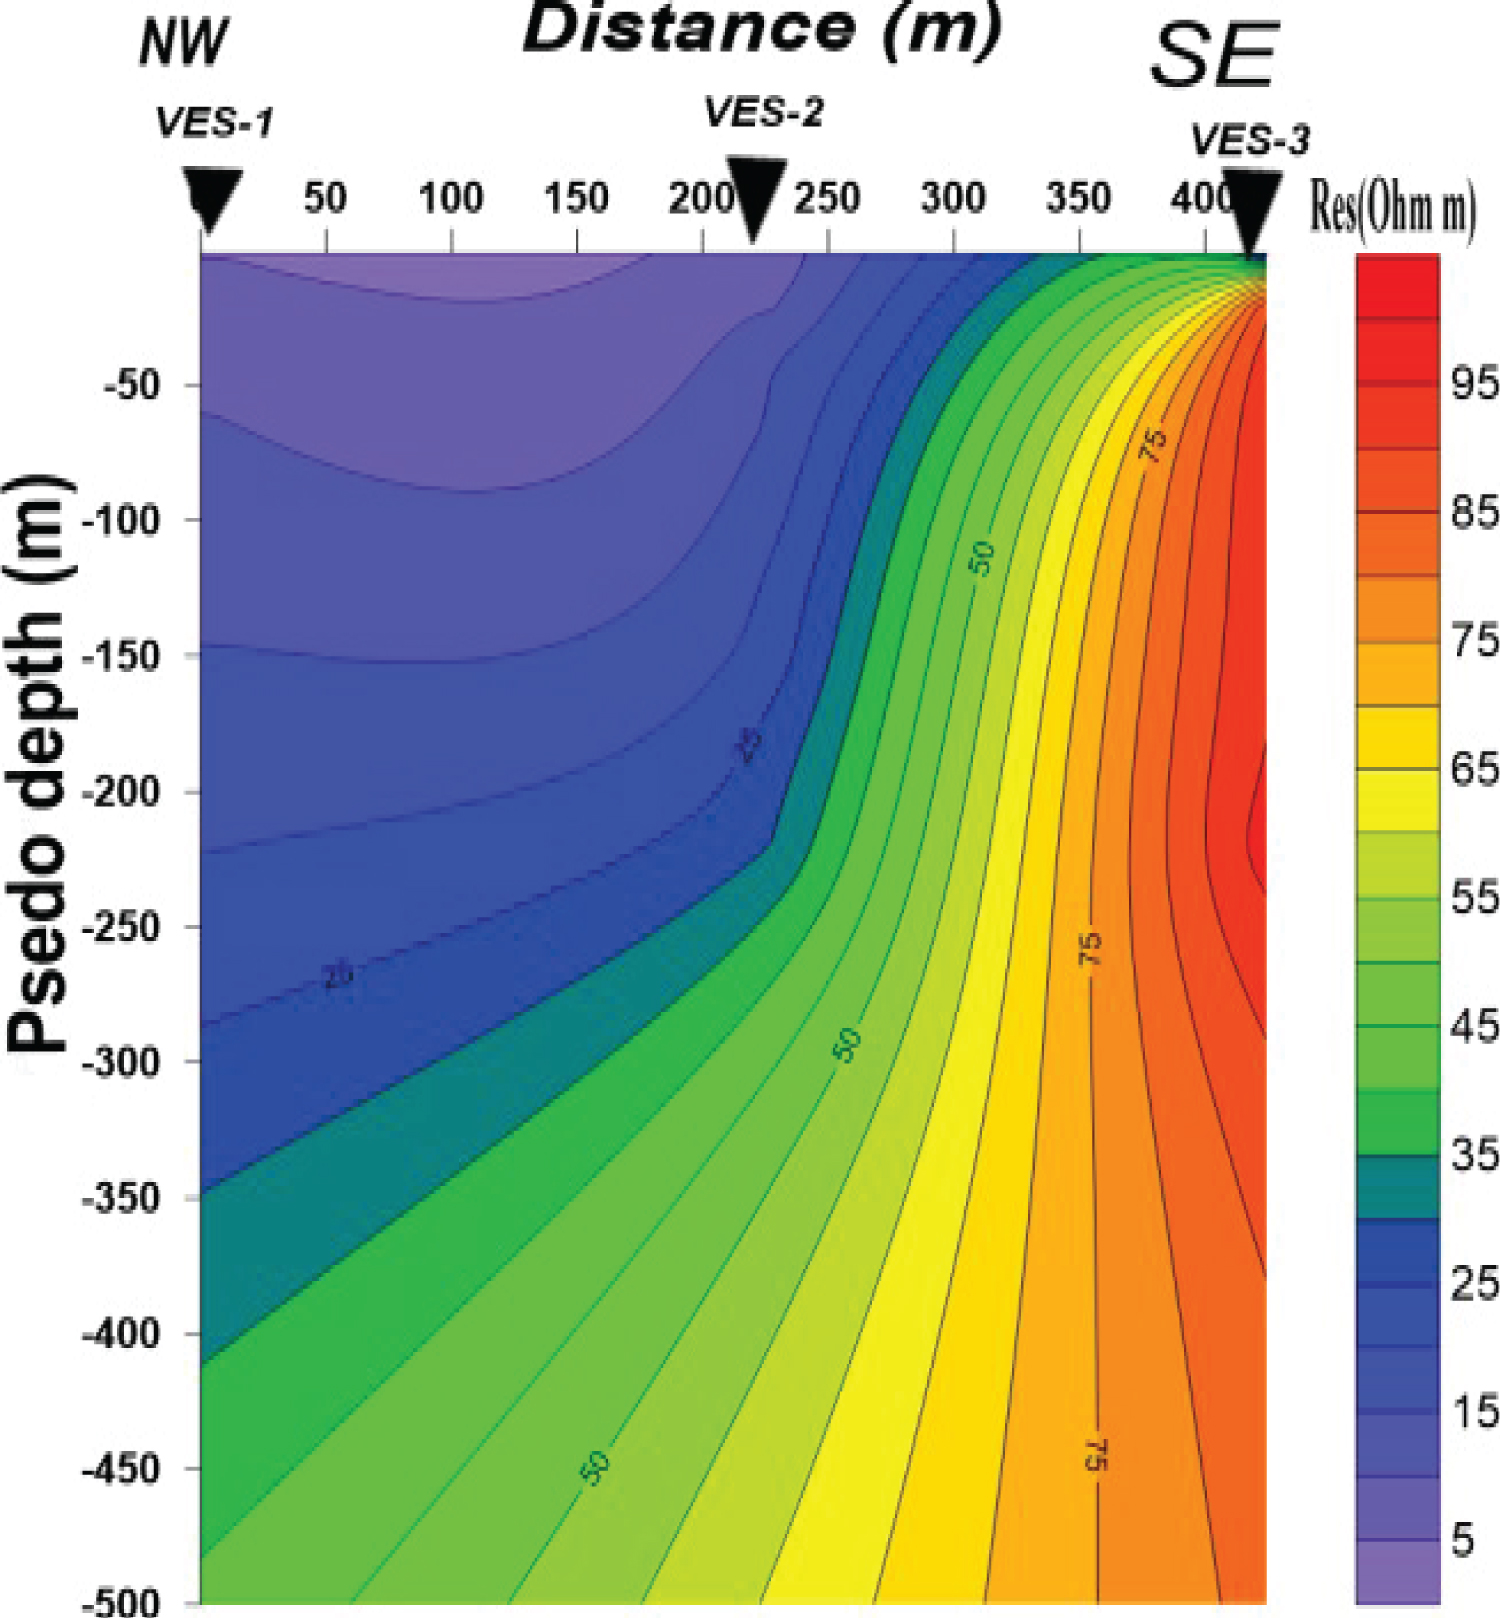
VES processing: The results of the study are presented in both qualitative and quantitative interpretations, in the qualitative interpretation the shape of the data curve is observed to get an idea qualitatively about the number of layers and resistivity of layers. The line curves were moved to small MN curve points to have precise interpretation. The results of this method of interpretation involved a slice stacking electrical resistivity map and geo-electric pseudo sections. The VES data collected in the field were plotted on a bilog paper and interpreted by using IP2WIN software to determine the initial model parameters of possible layers. Those parameters obtained from IP2WIN software were arranged and analyzed with the litho-logical units of existing boreholes to use as an initial model in RESIST inversion software, which resulted and reliable electrical parameters of the layers with tolerable errors ranging 1.5-3.5%. In the quantitative method geo-electrical parameters, i.e., true resistivity and layer thickness, were obtained to make geo-electrical sections using the software Auto CAD 2006. The type of the curve and the model parameters for the first curves of each profile are obtained from the software are presented in Figure 2. A slice stacked map for different values of AB/2 reflects the lateral variation of apparent resistivity over a horizontal plane at a certain depth. In other words, these plots indicate the distribution of apparent resistivity in the area with the distance of current electrodes. The maximum depth penetration of the AMNB method is 1/3 to 1/4 of the maximum distance of current electrodes [5]. Pseudo-section qualitatively reflects the apparent resistivity distribution within the subsurface versus electrode spacing values (AB/2). These pseudo sections are given in Figure 3. Geo-electric sections, in general, showing the distribution of layer resistivity and sand thicknesses are believed to give a closer approximation to the actual geoelectric setting in the subsurface. In practice, most of the quantitative interpretation would be based on these sections. To prepare the geoelectric sections, the final model parameters (thickness and resistivity) of this work were determined by an inversion software, RESIST [6].
General discussion and interpretation: As discussed in the preceding section, the results of the resistivity sounding survey are presented in the form of an interpreted VES curve, pseudo-depth map, and apparent resistivity pseudo- sections for qualitative assessment and vertical geo-electric section, permitting quantitative interpretation.
Discussions and interpretation of VES
Interpreted VES curves
Apparent resistivity versus electrode spacing plotted on a bi-log scale is interpreted by using IP2Win software to obtain the initial model parameters to be entered into the inversion software (resist) by constraining it further with the existing boreholes. It is seen from the interpreted field curves that an excellent correlation between the field data and the interpreted model sections are obtained for all three VES points. This is attested by an RMS error of 1.5 to 3.5% obtained for the sounding data. An honored was made using three interpreted VES curves, one each from each of the survey traverses, and these are given in Figure 2.
Profile one
Pseudo depth section is the pseudo-depth section constructed for VES-1, 2, and 3 that lie on the Survey traverse line is given in Figure 2. According to this Figure 2, there is a lateral variation in resistivity in the top most part of the section with prominent high resistivity top zones mapped between VES-1 and VES-3. This high resistivity zone is not extended to a large depth. Otherwise, the vast region under the section shows extensive coverage of the low resistivity zone. The resistivity ranges (0 to 100 ohm-m) of this low resistivity region are indicative of potential water saturation. The high resistivity region was indicative of low potential water saturation and the medium resistivity region was indicative of moderate potential water saturation.
Geoelectric section
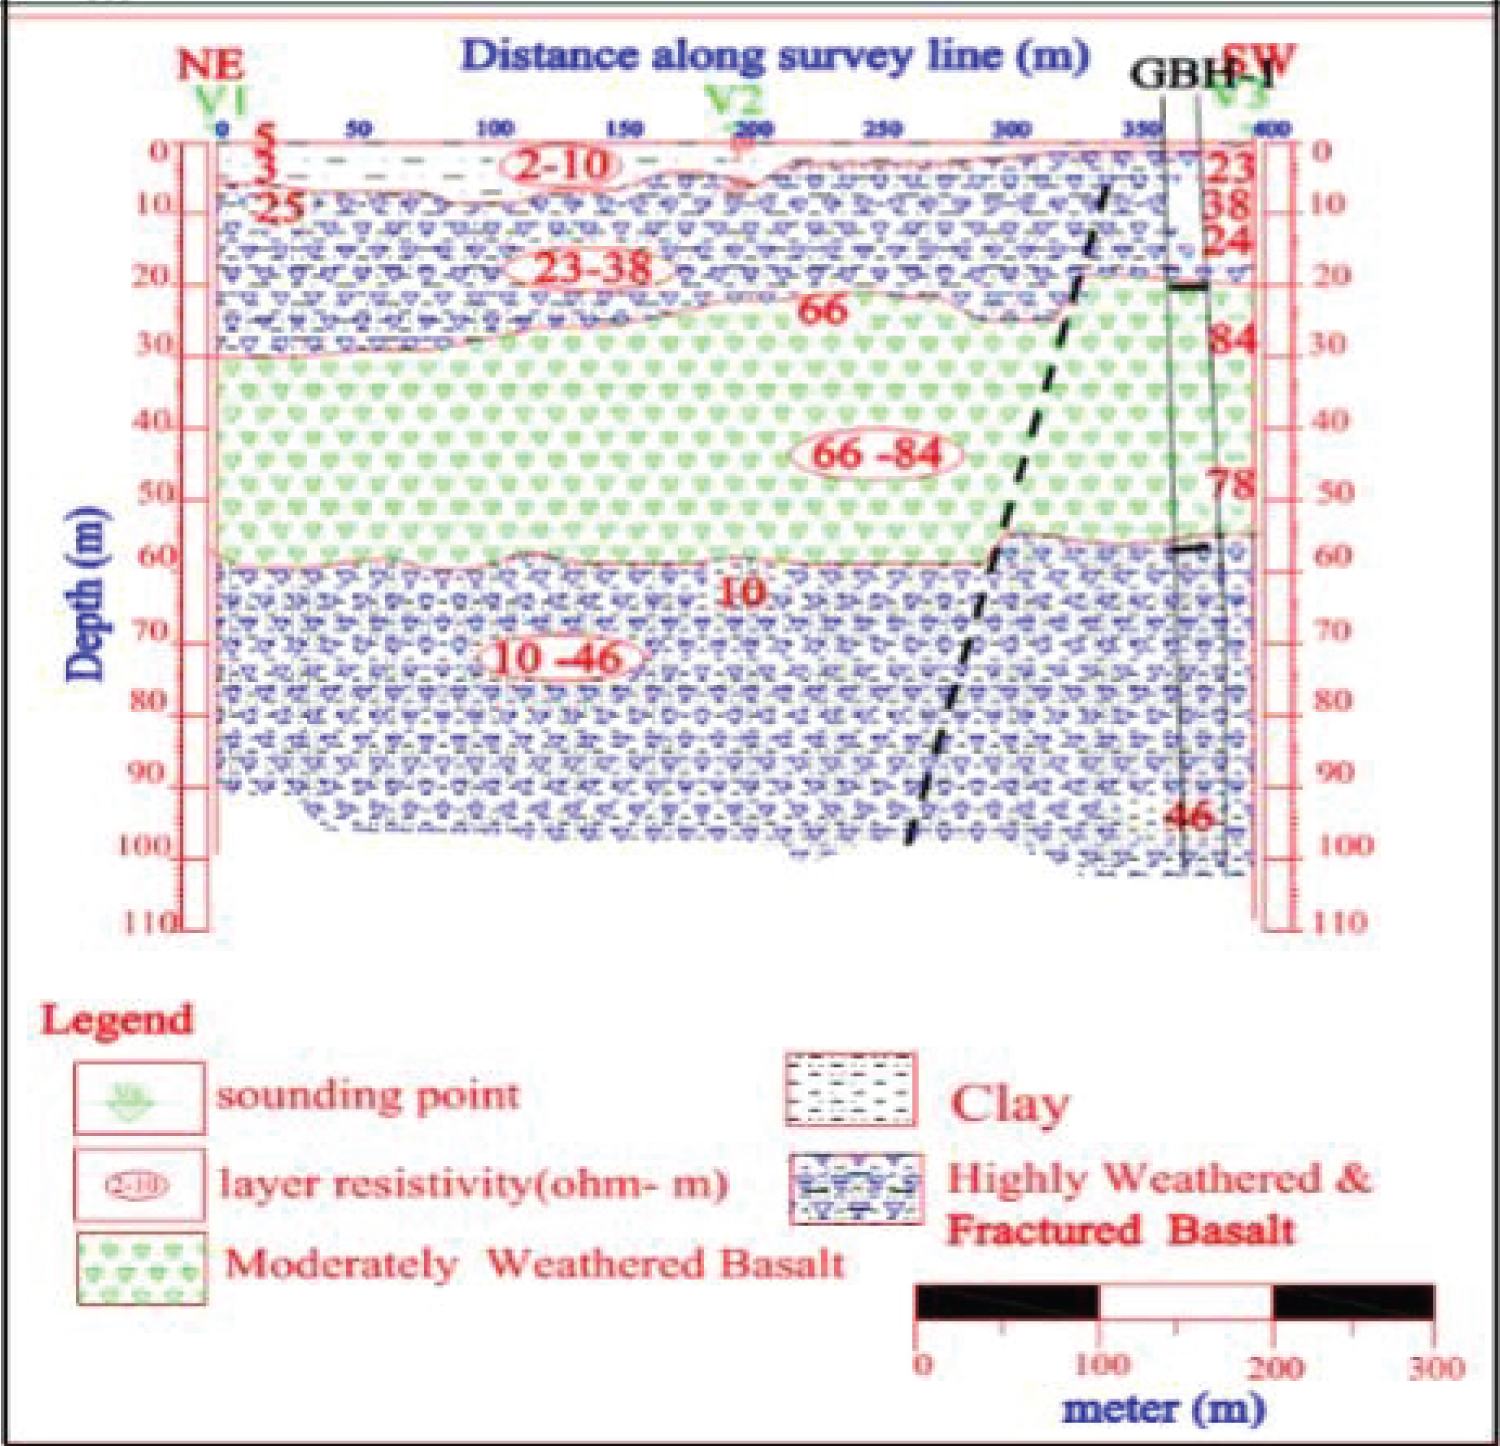
The resulting geoelectric section constructed from the interpreted layer parameters of the three VESS lying on this traverse is given in Figure 3. It was located near the profile, especially close to VES-3 was also used to constrain the depth and identify the litho logical units beneath these VES points during modeling in the litho logical description of the borehole depth section with their resistivity parameters from each interpreted VES were used to prepare the geoelectric section shown below (Figure 3). Near the surface geoelectric layer that has variable resistivity ranging from about 2-10 Ohm-m. The difference in the resistivity values is due to the variation in the amount of grain size, the area with high resistivity values indicated the presence of gravel and sand as top soil, while those with relatively low resistivity values indicated the presence of clay intercalation with sand and the thickness variation are about from 0.5-10 m and may be attributed to the top soil with alluvial (geological deposit) cover (sand, clay and silt) [7]. The second geoelectric layer is marked by resistivity values ranging from 23 to 38 Ohm m. The thickness variation is from 10-30 m. This layer likely reflects highly weathered and fractured basalt. The resistivity of the third geoelectric layer that corresponds to a moderately saturated layer varies from 66-84 Ohm-m and its thickness also varies from 20-60 m. The type of litho logs of this layer may be volcanic ash, silt, and clay and slightly weathered, moderately to highly fractured, and weathered basalt. From the section, this layer has relatively good potential of groundwater, especially under VES-1 with the resistivity value ranging from 65.5-70 Ohm-m [8]. The thickness of the bottom layer varies from 60 m - 110 m with lateral variation of resistivity from 10-46 Ohm-m and the layer may be moderately to highly weathered and fractured basalt. From the geoelectric point of view, the fourth layer in the sequence has to be more promising for its high potential of ground water. The resistivity signature within this section ranges from 10 to 46 Ohm-m considering the response of a conductive basaltic rock. Likely lithology compositional interpret was that this layer may comprise highly weathered and fractured coriaceous (old ocean) basalt with a possible covering of clay materials [9].
Conclusions
Based on the result discussion and interpretation, the following conclusions have been drawn using the combination of data presentation approaches:
• The apparent resistivity pseudo-depth section and the true resistivity geo-electricity section showed the presence of shallow as well as deeper low resistivity horizons which are potential zones of groundwater saturation.
• The low resistivity and large thickness of these horizons is an indicator of high groundwater potential in the study area.
• From the results of the electrical resistivity method, we have seen that the area is highly affected by tectonic forces (a force which can change the structure of the earth surface), resulting in fracturing and faulting of the rock units at varying depths. These faults (contacts) and fractures are believed to control the flow of groundwater. The fractures and weak zones are the major controls for the flow of ground water over the area.
• Most of the basaltic rocks (for all traverse lines) are highly fractured and weathered, which expects to be water bearing zones at different depths.
• The geological structures (fractures, faults, and contacts) play a great role in the movement and occurrence of groundwater in the study area.
• The highly to moderately weathered and fractured basalt and sand layers contribute more to the recharge and movement of the groundwater through the faults and wake zones.
• Comparison of the geophysical interpretations with drilled borehole results show that the results of the geophysical survey are good correlation with the borehole litho logical logging results.
• The main geologic units upon the survey area that are likely to bear groundwater (based on the degree of fracturing and weathering) are basalt and sand. The water table of the study area varies from 20 to 60 meters deep that increases towards the northwest of the study area.
Recommendations
Based on the results of this study, the following thoughts are recommended:
• Woldia University and Woldia Town Water Administration office need to assess and use the groundwater potential resources of the study area.
• Further intensive study on large-scale sample size is recommended to produce much more relevant information about the ground water potential.
References
- Desersa TT, Hassan R, Ringler C (2008) Measuring Ethiopian farmers’ vulnerability to climate change across regional states. IFPRI Discussion Paper 806. Washington, D.C: IFPRI.
- (2004) United Nations educational, scientific, and cultural organization world water assessment program national water development report for Ethiopia (Final) Addis Ababa December 2004.
- (2016) Estimating access to drinking water supply, sanitation, and hygiene facilities in Woldia Town, North, Ethiopia, regarding to national coverage.
- Zohdy AAR, Anderson LA, Muffler LJP (1973) Resistivity, self-potential, and induced-polarization surveys of a vapor-dominated geothermal system. Geophysics 38: 1130-1144.
- (1996) Direct current resistivity investigation of groundwater in the Lower Mesilla Valley, New Mexico and Texas.
- (2016) Ground water resources potential assessment in the eastern arid and semi-arid areas of Ethiopia: In case of Fafan District, Jijiga Area.
- (2017) Integrated geophysical investigations to characterize the shashamane-Aje 2016 ground fissures, main Ethiopian rift.
- Ayodele YG, Joshua AO, Sunday OJ (2015) An Engineering Site Characterization using Geophysical Methods: A Case Study from Akure, Southwestern Nigeria. Journal of Earth Sciences and Geotechnical Engineering.
- (1998) Application of electrical resistivity and electromagnetic prospecting methods for ground water studies around dembi near debrezeit.
- (2018) Application of integrated geophysical techniques to map groundwater potential zones and geological structures at Woldia University and Mechare Meda, North Wollo Zone, North Ethiopia.
Corresponding Author
Mehari Sisay Aberie, Natural and Computational Science, Woldia University, 400, Ethiopia
Copyright
© 2022 Aberie MS. This is an open-access article distributed under the terms of the Creative Commons Attribution License, which permits unrestricted use, distribution, and reproduction in any medium, provided the original author and source are credited.