Quality of Recovery in Breast Surgery: Estimation of MCID and Effect of Anesthesia
Abstract
Purpose: Postoperative recovery following breast surgery is essential for optimizing patient outcome. Despite the validation of the Quality of Recovery-15 (QOR-15) scale for the assessment of postoperative recovery, the threshold for clinically meaningful change over time is under-researched and under-reported for breast surgery. This study assesses the degree of postoperative recovery using QOR-15-derived MCID estimates for breast surgery patients. The data is derived from survey scores collected at multiple post-operative days. The study also evaluates patterns in the QOR categories (sub-domains): pain, physical comfort, physical independence, psychological support, and emotional state, and quantify the extent of change in patient recovery to potentially tailor intervention strategies for breast surgery patients.
Methods : In a prospective cohort study, surveys from 60 breast surgery patients were utilized in the QOR-15 analyses. Data was collected at 4 postoperative time points: Post-operative days 1, 2, 3, and 7. The Minimal Clinically Important Difference (MCID) values were calculated for groups receiving pectoralis and serratus plane (PECS) block and subcutaneous infiltration of local anesthetic (LOC) agents. MCID was determined using both anchor-based and distribution-based methods that are triangulated. The sub-dimensions of QOR and the Cohen’s dz effect sizes were examined for the two anesthetic groups. A mixed-effects model was applied for statistical analysis.
Results : A value of 3.8 to 9.9 MCID was determined from the QOR-15 score. This range was used as a metric for clinically important improvement in postoperative recovery among breast surgery patients. The sub-dimensional scores showed varying recovery patterns with the majority following steady and incremental trends. Effect size indicated small to moderate score gains with time. Preliminary findings suggest that anesthesia type may influence the early recovery profile.
Conclusion : This study provides QOR-15- derived MCID values and a meaningful benchmark for evaluating postoperative recovery for breast surgery patients. It also highlights temporal patterns within the sub-dimensions of the QOR-15 survey. Additionally, the analysis of effect sizes and anesthesia types can enhance our understanding of postoperative recovery trajectories, serving as an input for the development of tailored perioperative pain management strategies for breast surgical patients.
Keywords
Quality of recovery, QOR-15, Postoperative pain, MCID, Breast surgery, Anesthesia
Introduction
Postoperative recovery is a critical component of patient care, influencing both short- and long-term surgical outcomes [1]. The Quality of Recovery-15 (QOR-15) scale is a validated and reliable tool widely used for the assessment of postoperative recovery from the perspective of the patient. The QOR-15 scale is utilized across multiple specialties for its feasibility and clinical applicability [2-5]. Another important metric is the Minimal Clinically Important Difference or the MCID, defined as the smallest changes in a score perceived by patients as significant, serving as valuable determinant of treatment success [6]. Previous studies have evaluated methods for estimating the MCID. However, there are limited MCID values reported for patients specifically undergoing breast surgery. Furthermore, there is limited evidence on how to determine MCID in the context of repeated measurements [7], which are common in postoperative recovery studies. Such studies often involve non-independent outputs due to within-subject correlations [8]. In this context, mixed-effect models are recognized as a powerful statistical tool for analyzing longitudinal data [9].
While various methods have been used to estimate MCID, few studies have focused specifically on the breast surgery population. For instance, Li, et al. utilized the Quality of Life Instrument for Cancer Patients - Breast Cancer (QLICP-BR), a 32-item tool with four sub-domains, to estimate MCID values ranging from 6.79 to 18.88 points [10]. In contrast, Nelson, et al. and Voineskos, et al. also applied the 16 questions-based Breast Q method with a 4 point score to estimate the MCID for patients underwent breast reconstruction surgery [11,12]. Although these tools are tailored to breast surgery, they differ substantially from the QoR-15 in structure and focus.
In different studies, Myles, et al. estimated MCID of 0.92, 8.0, and 6.3 for QOR-9, QOR15 and QOR-40, respectively, for patients underwent elective general surgery, orthopedic, and urologic procedures, illustrating the importance of number of items in the survey when determining MCID [13]. Subsequent studies have proposed a ROC-derived MCID of 6 for the QoR-15 across various procedures [14]. However, as emphasized in a systematic review by Kleif et al., these MCID values were not specific to breast surgery [15].
To date, there is no distinct study identifying a breast surgery-specific MCID for the QoR-15, representing a significant gap in the literature regarding validated recovery metrics for this population [16]. Furthermore, the psychological effect of breast disease, and the impact of breast surgery on body image are important factors that must be considered, as they can significantly influence the recovery profile [17]. Therefore, applying a non-specific MCID to breast surgery may lead to inaccurate estimation of clinically meaningful changes in this patient population [18].
Therefore, the main objection of this study is to estimate a breast surgery-specific MCID for the QoR-15, using QOR-15 data collected across multiple postoperative days, to assess the degree of postoperative recovery over time. The study also evaluates patterns in the QOR categories (sub-domains), and quantify the extent of change in patient recovery to potentially tailor intervention strategies for breast surgery patients.
Material and Methods
Study design
This observational prospective study was conducted across multiple hospitals within the Geisinger Health System from July 8, 2022, to November 26, 2024 (IRB approval number 2021-0696). The study aimed to assess post-surgical pain recovery in patients who underwent breast surgery. A total of 68 patients completed the survey (Table 1). Of these, 7 were excluded due to incomplete survey response, where greater than two answers were marked as “Not Applicable (NA)”, and 1 patient was excluded due to incomplete anesthesia record. As a result, a total of 60 patients were included (Table 2). The patients either received subcutaneous injections of short-acting or long-acting anesthetic agents (LOC) n = 51, or Pectoralis and Serratus Plane (PEC) block n = 9, table 1. Two patients underwent two separate surgeries where they received LOC and PEC respectively. Survey results with two or less responses including “NA”, were imputed and included in the data.
Pain management and measures
The selection of intraoperative pain therapy was tailored based on patient history, type of surgery and expected recovery. Subcutaneous injections of local anesthetic agent were administered as either Short-Acting in the form of Marcaine or Lidocaine, or Long-Acting Liposomal Bupivacaine (Exparel). Pectoralis and Serratus Plane Block (PEC) was performed using a mixture of Marcaine, with or without Exparel.
Types of medications used postoperatively are listed on Table 2. Recovery was assessed on post-operative days 1, 2, 3 and 7 using the QOR-15 survey tool. An additional category was included with 7 supplemental questions to assess “pain severity” using a 1 to 10 numerical scale, where 1 represented no pain and 10 reflected severe pain. This specific question was utilized to categorize pain as “Improved” or “Not Improved,” serving as clinically meaningful anchor for analyzing recovery outcomes, i.e. MCID.
Statistical analysis
Both descriptive statistics and residual normality were analyzed using the JMP, Version18. SAS Institute Inc., Cary, NC, 1989-2023 software. An 80% power and sample size collection was targeted to detect clinically meaningful differences. However, due to challenges in patient recruitment, particularly within the PEC group, the final sample size was smaller than originally planned, leading to unequal sample sizes. While large effects are reasonably powered, the smaller PEC group may not have been powered to sensitively detect smaller differences, which could be a limitation of this study.
A linear mixed-effect model and Cohen’s dz were applied given the repeated measures designs with non-independent survey outcomes, and unequal but paired sample groups. Anesthesia type and postoperative day were modeled as fixed effects to assess their impact on QOR-15 scores, while Patient ID was included as a random effect to account for repeated measures and within-subject correlations in recovery over time. Cohen’s dz utilizes the ratio of mean difference between responses of each condition, and the corresponding standard deviation of the differences to quantify the magnitude of postoperative recovery. This was used to estimate within-subject changes over time as effect size, benchmark being 0.2 for small, 0.5 for medium, and 0.8 for large effects [19-21].
Triangulated MCID was calculated using both distribution-based (0.5 standard deviation), and anchor-based approaches. The anchor was defined as the mean change in scores among patients whose pain was categorized as “improved.” Receiver Operating Characteristic (ROC) and Area under Curve (AUC) were also analyzed to estimate the QOR-15 scale’s ability to identify recovery changes [22-24]. Intraclass Correlation (ICC) determines variability in between-patients, and it was calculated using the ratio of between-patient variance to the total variance. Values between 0.75 and 0.9 suggest good reliability of the ICC estimates [25].
Ethical considerations
Informed consent was obtained from all participants. All the methods adhered to ethical principles outlined in the Declaration of Helsinki, and confidentiality was maintained per institutional and regulatory standards [26].
Results
Patient demographics and procedural information
Table 2 summarizes the demographic and clinical data. Sixty female patients, aged 20 to 83, completed the survey. The most common procedure performed was excisional biopsy (36%), followed by partial mastectomy with axillary sentinel lymph node biopsy (SLNB) (29%). Partial mastectomy (26%), complete mastectomy with or without immediate reconstruction (7%), and axillary lymph node biopsy or axillary dissection (2%) were additional surgeries performed.
Post-operative analgesia
Analgesia choice following breast surgery was patient dependent. A summary of the oral medications used is provided in table 2. The majority of patients (69%) used a combination of medications along with non-pharmacologic methods such as ice packs or heating pads [27]. 16% of individuals reported not requiring any analgesics postoperatively, while 14% used only a single form of treatment for pain control. Among the medications reported, Tylenol was the most commonly used (38%) medication, followed by Tylenol in combination with Motrin (28%), and Tylenol with ice or warm compresses (13%). Additionally, 13% of patients reported using Tramadol or Ultram. See table 2 for additional information.
Mixed-effect model and diagnostics
Modeling results revealed a statistically significant fixed effect of time on QOR-15 scores (p = 0.008), indicating improvement in recovery from postoperative Day 1 to Day 7 (Table 3). Anesthesia by itself and the Anesthesia*Time interaction remained not statistically significant (p = p = 0.314 and p = 0.311 respectively). The mixed-effects model demonstrated strong overall performance, with a marginal R 2 of 87%, indicating that the combination of fixed and random effects explained a substantial proportion of the variance in QOR-15 scores. The root mean square error (RMSE) was 6.6, reflecting a relatively small average prediction error in the postoperative recovery scores. The intraclass correlation coefficient (ICC) was 0.83, suggesting high model reliability, and indicating that 83% of the total variance in QOR-15 scores was attributable to between-patient differences, supporting the inclusion of Patient ID as a random effect. Residual diagnostics showed a slight negative skew; however, all residual values remained within an acceptable range (skewness < 1), indicating an adequate model fit [28].
Anesthesia and effect size
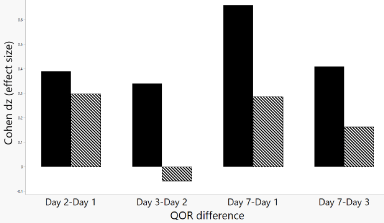
Most patients surveyed received Local Anesthesia (LOC) intraoperatively (85%), compared to 15% who received a Pectoralis and Serratus Plane Block (PEC), as listed in table 2. The relationship between postoperative day and anesthesia type was assessed using Cohen’s dz based on QOR-15 scores (Table 4). Between postoperative Day 1 and Day 7, the PEC group demonstrated a small effect size (dz = 0.29) with a mean QOR-15 score improvement of 2.84 points. In contrast, the LOC group showed a medium effect size (dz = 0.66), with a greater improvement of 8.9 points in QOR-15 scores, suggesting a more pronounced recovery trajectory (Table 4, Figure 1). Overall, both groups exhibited a gradual and incremental recovery pattern from Day 1 to Day 7. However, the smaller sample size in the PEC group may have limited the power to detect more substantial effects [29].
QOR-15 and recovery trajectory
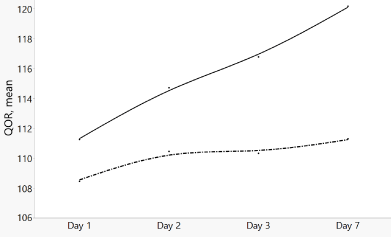
Total QOR-15 scores increased progressively over time for both anesthesia groups. On Day 1, PEC showed a mean score of 108.4 versus 111.2 for the LOC group. By Day 7, scores increased to 111.3 and 120, respectively (Table 5). Although there is no statistical difference in QOR scores between LOC and PEC groups (p = 0.314), LOC consistently showed higher QOR 15 scores (Figure 2). The steady increase in both demonstrates improvement in postoperative recovery over time.
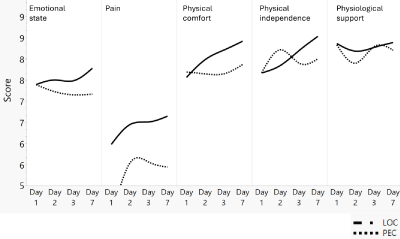
The sub-dimensions scores and recovery trajectories are demonstrated on figure 3. For emotional state, patients with LOC showed better recovery over time, while PEC achieved earlier pain control until Day 3 and then declined. In the case of physical comfort, LOC showed steady recovery while PEC began stabilizing after postoperative Day 3. For physical independence, LOC remained steady, but PEC suggested rapid initial increase followed by unstable score. For physiological support, both anesthesia groups showed unstable trend.
Clinical relevance and MCID
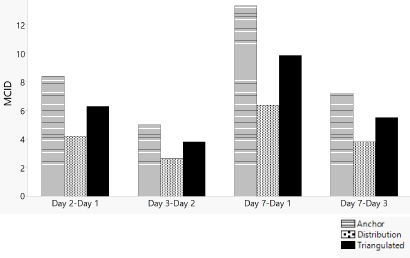
The MCID for QOR-15 scores were determined using both anchor-based and distribution-based methods. Anchor-based points ranged from 5 to 13.3, with the largest improvement calculated being between Day 7 and Day 1. The results from the distribution-based analysis were lower, 2.6 to 6.4, indicating a more conservative threshold. The average of both methods resulted in the triangulated values of 3.8 to 9.9.
Table 6 and figure 4 show the combined MCID data for both anesthesia groups. Additionally, AUC values were extracted from the ROC plots [22,23,30], and they were 0.66 (Day 2-Day 1), 0.77 (Day 3-Day 2), 0.48 (Day 7-Day 3), and 0.76 (Day 7-Day 1), respectively. In some literature, cut-off values derived from the ROC curve were recorded as an alternative MCID threshold [31]. These values were 0.27 (Day 2-Day 1), 0.45 (Day 3-Day 2), 0.28 (Day 7-Day 3), and 0.62 (Day 7-Day 1). However, these were excluded from the final MCID triangulation due to their low threshold levels and variability. AUC values exceeding 0.7 are generally accepted and suggest fair discrimination of the patient-reported, “Improved” or “Not Improved” responses collected from the anchor questions [23,32]. Therefore, due to the dependency of MCID outcome from the ROC plots, in this report the cutoff values were solely used to support the QOR-responsiveness to distinguish between the improved and not-improved categories from the anchor survey outcome.
Discussion
This study aimed at characterizing postoperative recovery following beast surgery, as measured by the QOR-15 scale. Anchor-based and distribution-based methods were applied to determine the triangulated MCID points. ROC analysis assessed the scale's ability to discriminate MCID over postoperative periods, but the derived MCID values were excluded due to low and variability in the cutoff points. General sample size may have affected this result. The anchor-based analysis yielded MCID values ranging from 5 to 13.3, (Table 6, Figure 4). These points could serve as clinically meaningful reference benchmarks following breast surgery to assess recovery progress, and to potentially guide intervention approaches. These findings are consistent with previous research, supporting the idea that using a single, general MCID across different patient populations can be misleading [10-14,18].
Effect size analysis of the total QOR-15 scores indicated a steady, gradual improvement in postoperative recovery from Day 1 to Day 7 (Figure 1). Sub-dimension analysis revealed distinct recovery patterns between anesthesia groups. In the LOC group, emotional recovery showed a steady upward trend over time. In contrast, patients in the PEC group experienced earlier pain relief and more rapid initial gains in physical independence; however, their recovery appeared less stable in the domains of comfort and physical support during the early postoperative period. These findings suggest that patients receiving PEC blocks may benefit from additional early emotional and comfort-focused support to optimize recovery.
The mixed-effect model demonstrated a good fit, with an R 2 value of 87%, indicating that a significant portion of the variance in QOR-15 scores was accounted for both fixed and random effects, (Table 3). The RMSE = 6.6 suggested reasonable predictive power. A significant main effect of time (p = 0.008) demonstrated a positive recovery trajectory after breast surgery. However, anesthesia (p = 0.314) and its interaction with time (p = 0.311) were not significant. This suggested that both types of intraoperative pain therapy facilitate recovery [16,33]. Variance component analyses (ICC = 83%) indicated existence of the between-patient variability [25]. The skewness (all, < 1) indicated a moderate effect and did not significantly affect model fit [28].
The study’s main limitation is the uneven sample size between anesthetic groups, particularly the PEC group, which may have reduced power and introduced variability in some of the estimates. Larger and more balanced groups are expected to improve statistical output [29].
Conclusion
This study provides valuable insight into postoperative recovery following breast surgery using the QOR-15 scale. By combining anchor- and distribution-based methods for calculating the triangulated MCID thresholds, we identified the clinically meaningful change that can be used to imply treatment success, which ranges from 3.8 to 9.9. The results highlight the importance of patient-centered outcomes in clinical decision-making and demonstrate the use of the QOR-15 scale to study recovery after breast surgery. The effect size results from the sub-dimension analysis align with the steady incremental recovery observed, illustrating the impact of anesthesia group on recovery. The findings also emphasize the need for adequate sample size for reliable estimates, particularly for ROC analysis.
Acknowledgements
The authors thank the research team at the Geisinger Medical Center, especially Katie Frank for the initial data analysis, and Samantha Crissinger for assistance with project management. Special thanks to Dr. Mona Deora Duncan for her expertise in patient care and surgery. We also acknowledge Christopher Lloyd for his assistance in the data entry.
Disclosure
The authors declare no financial disclosures or conflicts of interest of related to this study.
Declaration of AI-assisted Technologies
AI was utilized to improve some grammatical performance and sentence structure.
References
- Woudneh AF (2025) Understanding the dynamics of post-surgical recovery and its predictors in resource-limited settings: A prospective cohort study. BMC Surg 25: 44.
- Stark PA, Myles PS, Burke JA (2013) Development and psychometric evaluation of a postoperative quality of recovery score: The QoR-15. Anesthesiology 118: 1332-1340.
- de Vlieger JCN, Luiting WH, Lockyer J, et al. (2022) Validation of the Dutch translation of the quality of recovery-15 scale. BMC Anesthesiol 22: 243.
- Rosato R, Palazzo V, Borghi F, et al. (2023) Factor structure of post-operative quality of recovery questionnaire (QoR-15): An Italian adaptation and validation. Front Psychol 13.
- Kang R, Lee S, Lee E, et al. (2022) Validation and clinical utility of the Korean version of the obstetric quality-of-recovery score (ObsQoR-11) following lective cesarean section: A prospective observational cohort study. Diagnostics 12: 291.
- Jaeschke R, Singer J, Guyatt GH (1989) Measurement of health status. Ascertaining the minimal clinically important difference. Control Clin Trials 10: 407-415.
- Lorenzen MD, Pedersen CF, Carreon LY, et al. (2024) Measuring quality of recovery (QoR-15) after degenerative spinal surgery: A prospective observational study. Brain Spine 4.
- Detry MA, Ma Y (2016) Analyzing repeated measurements using mixed models. JAMA 315: 407-408.
- da Silveira LTY, Ferreira JC, Patino CM (2023) Mixed-effects model: A useful statistical tool for longitudinal and cluster studies. J Bras Pneumol 49: e20230137.
- Li F, Liu Y, Wan C, et al. (2022) Establishing minimal clinically important differences for the quality of life instrument in patients with breast cancer QLICP-BR (V2.0) based on anchor-based and distribution-based methods. Front Oncol 12.
- Nelson JA, Chu JJ, McCarthy CM, et al. (2022) Breast-Q React: Clinical reference values for the BREAST-Q in post-mastectomy breast reconstruction patients. Ann Surg Oncol 29: 5280-5293.
- Voineskos SH, Klassen AF, Cano SJ, et al. (2020) Giving meaning to differences in BREAST-Q scores: Minimal important difference for breast reconstruction patients. Plast Reconstr Surg 145: 11e-20e.
- Myles PS, Myles DB, Galagher W, et al. (2016) Minimal clinically important difference for three quality of recovery scales. Anesthesiology 125: 39-45.
- Myles PS, Myles DB (2021) An updated minimal clinically important difference for the QoR-15 Scale. Anesthesiology 135: 934-935.
- Kleif J, Waage J, Christensen KB, et al. (2018) Systematic review of the QoR-15 score, a patient- reported outcome measure measuring quality of recovery after surgery and anaesthesia. Br J Anaesth 120: 28-36.
- Barrington MJ, Seah GJ, Gotmaker R, et al. (2020) Quality of recovery after breast surgery: A multicenter randomized clinical trial comparing pectoral nerves interfascial plane (Pectoral Nerves II) block with surgical infiltration. Anesth Analg 130: 1559-1567.
- Türk KE, Yilmaz M (2018) The effect on quality of life and body image of mastectomy among Breast cancer survivors. Eur J Breast Health 14: 205-210.
- Franceschini M, Boffa A, Pignotti E, et al. (2023) The minimal clinically important difference changes greatly based on the different calculation methods. Am J Sports Med 51: 1067-1073.
- Cohen J (2013) Statistical power analysis for the behavioral sciences. (2 nd edn), Routledge, New York.
- Lakens D (2013) Calculating and reporting effect sizes to facilitate cumulative science: A practical primer for t-tests and ANOVAs. Front Psychol 4.
- (2025) Five different “Cohen’s d” statistics for within-subject designs.
- Liu Y, Xue H, Wong W, et al. (2024) Establishing minimal clinically important differences for the quality of life scale QLICD-SLE for patients with systemic lupus erythematosus based on ROC curve. Sci Rep 14: 20982.
- Mandrekar JN (2010) Receiver operating characteristic curve in diagnostic test assessment. J Thorac Oncol 5: 1315-1316.
- Park SH, Goo JM, Jo CH (2004) Receiver operating characteristic (ROC) curve: Practical review for radiologists. Korean J Radiol 5: 11-18.
- Koo TK, Li MY (2016) A guideline of selecting and reporting intraclass correlation coefficients for reliability research. J Chiropr Med 15: 155-163.
- (2025) WMA declaration of Helsinki - Ethical principles for medical research involving human participants. WMA.
- (2025) Acute pain management: A practical guide. Routledge.
- Joseph FH, Tomas MHG, Christian MR, et al. (2025) A primer on partial least squares structural equation modeling (PLS-SEM). Sage Publications.
- Serdar CC, Cihan M, Yücel D, et al. (2021) Sample size, power and effect size revisited: Simplified and practical approaches in pre-clinical, clinical and laboratory studies. Biochem Med 31: 010502.
- Froud R, Abel G (2014) Using roc curves to choose minimally important change thresholds when sensitivity and specificity are valued equally: The forgotten lesson of pythagoras. Theoretical considerations and an example application of change in health status. PLoS ONE 9: e114468.
- Zheng Y, Dou L, Fu Q, et al. (2023) Responsiveness and minimal clinically important difference of EQ-5D-5L in patients with coronary heart disease after percutaneous coronary intervention: A longitudinal study. Front Cardiovasc Med 10.
- de Vet HCW, Ostelo RWJG, Terwee CB, et al. (2007) Minimally important change determined by a visual method integrating an anchor-based and a distribution-based approach. Qual Life Res 16: 131-142.
- Battista C, Krishnan S (2023) Pectoralis nerve block. StatPearls.
Corresponding Author
Ruth T. Samson, Geisinger Wyoming Valley Hospital, 1000 E Mountain Blvd, Wilkes-Barre, PA 18711, USA.
Copyright
© 2025 Samson RT, et al. This is an open-access article distributed under the terms of the Creative Commons Attribution License, which permits unrestricted use, distribution, and reproduction in any medium, provided the original author and source are credited.

