Tumor Modeling and Microwave Heating for Increasing Oxygen in Tumors during Photodynamic Therapy
Abstract
Tumor destruction due to Photodynamic Therapy (PDT) is mainly governed by the amount of molecular oxygen present in the tumor. Oxygen is one of the rate-limiting factors in PDT. This rate-limiting factor always makes PDT a lengthy process, as it necessitates interruption in treatment in order to restore the depleted oxygen levels to normal range. In this paper, a microwave (MW) heating technique is proposed as a mechanism to elevate the local tissue temperature for oxygen enhancement. Extensive mathematical modeling of a tumor is presented to show the level of microwave heating required to optimize the PDT application within safety margins.
Keywords
Photodynamic therapy, Tumor modeling, Capillaries
Introduction
The effectiveness of PDT is governed by properties of the chemical constituents of the photosensitizer, proper illumination of the tumor with an ideal wavelength of light with sufficient power, and the availability of oxygen within the immediate microenvironment [1-4]. The first two factors can be controlled externally by modifying the photosensitizing agent and the light source. However, the third factor, oxygen availability, can only to be modified by manipulating the blood supply to the tumor.
Oxygen consumption during PDT is a rapid process and may quickly lead to depleted levels if the utilization outpaces tissue oxygenation via blood vessels [5]. The resulting tumor hypoxia during illumination will diminish the efficacy of the treatment. Since oxygen is one of the key ingredients for PDT action on the tumor, the best dosimetry protocol has to be designed with the highest source of oxygen from within [6,7]. Oxygen for tumor tissue is supplied via blood vessels in which it is transported in two different forms, as oxyhemoglobin, bound to hemoglobin (Hb) molecules and as dissolved oxygen in plasma, the latter presenting a much lower in quantity compared to the content of oxygen bound to Hb [8]. Thus, the main source of oxygen supply to a tissue is from oxyhemoglobin [9-11]. Changes of blood perfusion within the tumor during PDT may cause changes in supply of oxyhemoglobin. Following this, tissue oxygenation may also become depleted during or after illumination, if damage to vascular structures reduces perfusion.
The changes in oxygen concentration during PDT have been investigated using spheroids and in animal tumors as in vitro and in vivo models, respectively [4,7,12-14]. Monitoring the micro-vessel oxygen tension from these experiments has shown that the oxygen depletion is rapid during the initial irradiation period forming singlet oxygen; with time, an equilibrium is reached [5,12]. Further, it has been observed that, with time, oxygen concentration increases slowly, though fails to reach normal levels, and this phenomenon is thought to be due to the diffusion of oxygen from the adjoining capillary beds that are not affected by radiation [5]. Studies done with hypoxia markers have detected increased tissue hypoxia with continuous observation in the hours after PDT, in association with decreased vascular perfusion [15]. However, in contrast to hypoxia that develops during illumination, this late phase of hypoxia after PDT improves tumor response because the vascular damage itself contributes to tumor regression.
Since the availability of molecular oxygen during PDT has profound effects on treatment outcome, it is of utmost importance that the maximum concentrations be maintained during the illumination period. The benefits of tumor oxygen maintenance highlight the need for investigation of PDT-created hypoxia and development of a method and materials to optimize the oxygen content in order to ensure successful therapy. Sensitive methods to evaluate and quantify the tumor oxygen levels, and also methods that enhance oxygen availability in the PDT milieu, would be extremely helpful approaches in addressing this issue. However, the difference between experimental tumor models and the real tumors prevent the progress of translation of experimental results into clinical application. This is due to the fact that tumors may behave differently under their physiologic environment. The following approach of using a mathematical model to represent esophageal cancer is developed with the above considerations and directed towards the goal of achieving an enhancement of oxygen concentration during PDT.
Tumor Model
Mathematical models of tumor growth have been shown to be helpful tools in designing treatment protocols, especially during experimental therapeutic trials. Though there are numerous mathematical models, none seems fitting for the purpose of tumor modeling in the presence of PDT as the treatment modality [16].
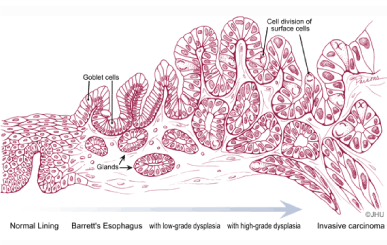
The anatomy of a tumor can be represented as in Figure 1 where tumor parenchyma and capillaries conquer the healthy tissue. In most occasions the early stage of cancer is exclusively recognized by a tissue biopsy. As a tumor grows, its capillary network grows simultaneously with it, in order to supply the comparatively larger requirement of nutrition and oxygen to the neoplasm [17]. The density of capillaries present in cancerous tissues, therefore, is comparatively higher than that present in healthy tissue. Thus for the structural model, the growing of a tumor should be represented as a highly vascular tissue, with an increasing number of capillaries for a constant amount of tumor parenchyma [18-21]. The average capillary density of a healthy human tissue is approximately 600 per cubic millimeter; an amount considered as the baseline for this model [8]. Capillaries play an important role in the transport of blood and diffusion of oxygen into the tissues. Therefore, the number of capillaries per unit volume of tissue is an important factor to be taken into consideration when calculating the amount of blood flow to a tissue. The number of capillaries per unit volume of a tumor is considered as the "growth factor of the tumor" [22,23]. Capillaries in a tissue are arranged in a complex network, as shown in Figure 1.
Esophageal adenocarcinoma is a malignancy of the lining epithelium, which invades into the underlying connective tissue and muscle layers deep in its wall, as the tumor advances. In Barrett's esophagus, which is the pre-malignant stage of esophageal adenocarcinoma, the capillaries are growing either parallel or perpendicular to the esophageal wall. The histology of Barrett's esophagus at cellular level shows that the major vascular component in the tissue is the capillary network, the rest being inclusive of the supply vessels consisting of small arteries, arterioles, venuels and veins [21,24,25]. Figure 1 shows an illustration of a growing tumor in an epithelium in different stages, with numerous growing capillaries. However, the representative elementary volume of the medium is selected in such a way that it consists of only capillaries, since the oxygenation of the tumor and the oxygen diffusion occur at the level of the capillary network.
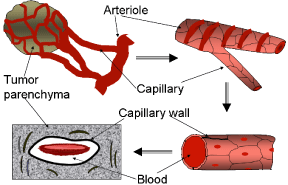
The main scope of this model is to show how tumor oxygenation is calculated, and how the oxygen content can be enhanced to obtain the most effective PDT treatment. For a tumor, the parenchyma is solid compared to blood within the capillaries. Thus a tumor can be represented as including two constituents: a porous medium of tumor parenchyma and blood. The Figure 2 is an illustration of a microscopic representation of tumor vasculature.
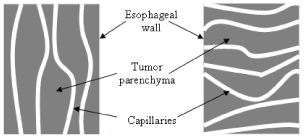
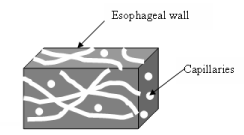
As stated earlier, the amount of oxygen present in a tumor depends on the number of capillaries per unit volume of tumor. Apart from the capillary density, the orientation of the capillaries in esophageal wall is considered in this model, in order to show the possible technique of enhancing the oxygen delivery to tumor tissue. It is assumed here that the tumor capillaries are located in different planes and directions. Three different capillary orientations in the esophageal wall are assumed in this model. Figure 3 illustrates two capillary orientations where capillaries are either parallel or perpendicular to the esophageal wall. Figure 4 illustrates the anisotropic capillary distribution, which is the natural orientation of the capillary network in a tumor.
In this porous medium model, blood inside the capillary network and the tumor parenchyma are considered separately as the two major constituents. The model differs from the exact microscopic nature of the representative elementary volume, since the components like red blood cells, white blood cells, and capillary membrane are not considered separately. The porosity represented by the existence of capillaries is enough to calculate the blood flow into the tumor. As shown in Figure 2, blood capillaries are not exactly circular in their cross section, rather oval in shape, with a diameter just sufficient for the red cells to squeeze through. Capillaries are assumed circular in our model, and furthermore the amount of red cells that flow into a capillary per unit time is calculated from the value of red blood cells per unit volume of blood. In the case of this model being used to study the blood flow when the blood viscosity is comparatively less, the properties of the blood can be used accordingly. Effects of having different capillary orientations are further discussed in the results section. However, in development of the model, not much emphasis is given to capillary orientation, except considering different effective thermal conductivities for different capillary orientations.
Derivation of a mathematical model for temperature dependent oxygen content in a selected tissue volume
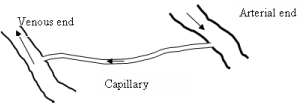
The amount of oxygen that diffuses into tissue is directly related to the volume of blood that flows within the capillaries [26]. Oxygen diffusion takes place only through the capillary endothelial membrane, and it is only the dissolved oxygen component that is diffused. The concentrations difference of dissolved oxygen between the arterial and venous ends of a capillary can be taken as a measurement of partial pressure difference; it provides indirectly measurement of blood flow. This fact can be used to develop a mathematical model to calculate the amount of blood flow into a specific tissue volume.
A simple geometrical theory is used to establish the amount of blood contained in a unit volume of tissue. If there are n number of capillaries per cubic millimeter of tissue, with diameter d and length , in the esophageal wall, it is possible to calculate the blood flow into the tissue with Hagan-Poiseuille equation. The oxygen partial pressure difference between the arteriolar and venous ends of a capillary is being used here, and it is assumed that the blood flow in capillaries and arterioles is not pulsative.
Hagen-Poiseuille equation in vector form is applied to the capillary of length S, with the following assumptions: the capillary is a rigid cylindrical tube where S >>> r (r, standing for radius), blood is an ideal fluid where viscosity of blood is not a function of shear rate, flow is laminar and steady, and the velocity is zero at the capillary wall. Then
We can write as follows:
where is the velocity of blood in the capillary, A is the average cross sectional area of the capillary, is the pressure gradient from point-1 to point-2 in the capillary, and μ is the viscosity of blood. Equation (1) is applied along the direction of the capillary axis. The direction of blood flow changes when the fluid flows from point-1 to point-2. Equation (1) is integrated from point-1 to point-2
where is the blood velocity vector at point .
Now we can take where u is the velocity of blood and is considered uniform along the entire capillary, since the mass flow rate, capillary cross section, and blood density is uniform along its length. Therefore, the left hand side of the Eq. (2) is as follows:
The right hand side of the Eq. (2) is given as follows:
From Eq. (3) & Eq. (4) the following is obtained.
If we define tortuosity we can write Eq. (5) as follows:
where stands for a selected length of the tumor, and 0 < x < 1.
Therefore volume of blood flow per unit time in a capillary is
where is the capillary blood volume.
Now combining Eq. (6) and Eq. (7), we can write as follows:
or
For n number of capillaries in the selected length of tumor, volume of blood flow can be written as follows:
Oxygen is carried in blood in two different forms: as dissolved oxygen in plasma and chemically bound to Hb as oxyhemoglobin. The dissolved oxygen obeys Henry's law, which denotes that the concentration of dissolved oxygen is proportional to its partial pressure [27]. For each mmHg of PO2 there is a concentration of 0.003 ml/O2/dl, as dissolved oxygen. The Hb concentration in blood changes from person to person. Table 1 demonstrates some accepted norms for different human groups [8]. Under physiological conditions Hb in human blood is bound with oxygen in varying amounts, changing according to the availability of oxygen. This value that is given as a percentage is termed "Hb oxygen saturation."
The amount of dissolved oxygen and the amount of Hb-bound oxygen flow per unit volume in a tumor can be calculated using Eq. (9). The term for pressure difference in Eq. (9) is replaced with the difference of oxygen partial pressures at arterial and venous ends of the capillary, which is the more applicable in this situation, than the hydrostatic pressure difference. Oxygen partial pressure and oxygen saturation values at arterial and the venous ends are considered common to all capillary beds in the body.
Partial pressure of oxygen at the venous end (PvO2) = 40 mmHg
Venous –Hb oxygen saturation (SvO2) = 75%
Partial pressure of oxygen at the arterial end (PaO2) = 95 mmHg
Arterial – Hb oxygen saturation (SaO2) = 97%
The normal values change with changes in temperature and pH values of the blood. Under physiological conditions, the drop in oxygen partial pressure from arterial end to venous end of a capillary is
(PaO2) – (PvO2) = 50 mmHg.
Similarly, the drop in oxygen saturation of Hb is
(SvO2) - (SaO2) = 22%
This gives the average percentage of oxygen that gets dissociated under normal conditions as 22%. Kelman proposed an empirical relation to the oxygen dissociation from Hb [28,29]. This relation provides computational ability to derive the oxygen saturation from virtual PO2, and is given as follows:
For
where x is the virtual PO2 and given by , where
The constants are:
For a constant pH, PCO2, and temperature, the actual oxygen partial pressure is equal to virtual PO2 [23,28]. Oxygen saturation in the blood can be written as follows:
The percentage of dissolved oxygen is very much less in blood compared to the chemically bound oxygen with Hb, and is recorded as 3 ml O2 /L of blood [8]. Using Eq. (12), we can write the amount of oxygen that is released to the tissue, from the bound form as follows:
Therefore the total percentage of oxygen that is released to the tissue can be given as:
Total O2 = Oxygen dissociated from Hb + Dissolved oxygen in plasma.
Let us define the following terms:
Hb content of blood (unit volume) = C1H1
Amount of oxygen bound per Hb molecule = C2
Amount of chemically bound oxygen in blood = C2 x C1Hb
Percentage of bound oxygen that is released to tissue = (1-SvO2) C2 x C1Hb
If dissolved oxygen content is denoted as C3,
The total oxygen content = C3 + C2 x C1Hb,
Amount of oxygen released =
This is the amount of oxygen that is released, per unit volume of blood that flows into the tumor under physiological conditions.
The dissolved oxygen in blood is in equilibrium with free oxygen in the tissue. As the latter is used by the tissue cells, the constant supply of dissolved oxygen is being filled by dissociation of Hb bound oxygen. The graphical illustration of this dissociation of Hb bound oxygen is a sigmoid curve. Temperature, pH and the concentration of 2, 3 DPG in the extracellular milieu of the tissue considered in the model, are the three principal factors that influence this dissociation curve, resulting in either an increase or a decrease in oxygen delivery [30]. The effect of pH on the dissociation curve is called Bohr Effect [27,30]. The binding of oxygen to Hb is allosterically regulated, where conformational changes occurring in the molecule make it bind with an increasing affinity at higher concentrations of oxygen. As a result, the higher the oxygen partial pressure, the higher the oxygen saturation of Hb. A right shift in the curve as brought by an increase in temperature or 2, 3 DPG concentrations, or a reduction in pH, would make the oxygen more dissociated at a particular oxygen partial pressure [8]. For example, Hb saturation recorded as 40% at 25 mmHg of oxygen partial pressure under normal conditions, is dropped to 30% by increasing 2,3-DPG and/or temperature, or by decreasing pH value. The dissociation curve shifted to right, this difference in saturation indicates release of oxygen [26].
The additional amount of oxygen necessary to make PDT more efficacious can be generated within the tumor by altering one of the above three main factors governing the Hb-oxygen dissociation. Due to constant physiological buffering of blood it is not easy to bring about a significant change in pH, and also the levels of 2,3- DPG are not within the range of practicability for alterations. Temperature, in contrast, is a rather easy tool here because localized heating can be used to make a shift in the Hb dissociation curve towards the right. Apart from a direct effect on the dissociation curve, an increased local temperature would also cause dilation of blood vessels, further contributing to an increased blood flow in the capillary bed.
Equation (9) can be modified to study the volumetric blood flow changes with temperature. Capillary radius and blood viscosity are affected by a change in temperature. We can use the power law of viscosity to demonstrate the effect of temperature on blood viscosity as follows [31.32]:
where at T = 273 k and n = 2/3.
Assuming that the thermal expansion of blood capillaries is linear with the temperature change and the coefficient of thermal expansion is independent of temperature, we can write as follows:
With Eq. (15) and Eq. (16) we can write Eq. (8) as follows:
Microwave (MW) heating of tissue to increase oxygen supply
Application of heat as a therapeutic modality has been investigated and used for many years in the treatment of different types of diseases. There are several different methods of heating a tissue including a point heat source, microwave, and ultrasound. However, of these three the use of microwave and ultrasound are more effective given their high penetration ability through human tissue. The biological effects of electromagnetic waves and ultrasound are well documented in literature [33,34]. Due to its high attenuation in heterogeneous media, ultrasound plays only a minor role in tumor heating. In contrast, the specific propagation characteristics of microwaves in non-homogeneous media make them ideal experimental tools in cancer treatment [35]. On the other hand, MW heating has been used as a therapeutic modality where it has been shown to bring selective destruction of malignant highly vascularized tissue [36]. The principal mechanism by which MW acts on tumor tissue is tissue ablation, leading to necrosis of cancerous cells [37,38]. In clinical therapeutic applications, however, the tissue ablation and destruction by MW goes beyond the margins of malignancy, and most often extends to the surrounding healthy tissue as well. As a result, MW is mostly employed as an adjunct to cancer chemotherapy, surgery, or PDT, rather than being used alone [39]. It has been observed in these therapeutic applications that blood flow within the local vasculature is increased during a MW heating process [40].
In the process of developing an ideal dosimetry protocol for PDT, an increase in local temperature that would bring about an increase in oxygen dissociation can be obtained from microwave heating of the esophageal wall. The ideal design of a microwave heating system should facilitate a sufficient temperature increase within adequate safety limits, causing no harm to the esophageal wall. Deep penetrating microwaves give a better heating in the radial direction than conventional heating methods. The introduction of microwave heating system would enhance the effectiveness of PDT [3,35]. The correct calculation of the exact amount of heat energy that is required for the local heating process is explained below.
Penne's bioheat equation has been used to model the heating of biological material and this model would still be useful to understand the effect of external heating on biological material [41]. Penne's bioheat equation is numerically solved in many cases to model heat transfer in tissues, including thermal regulation, tissue heating with a point source, as well as also microwave heating [13,42,43]. Therefore an attempt to develop an analytical solution for a tissue heating with microwave, resulting in an increased blood flow and oxygen enhancement starts with the Penne's bioheat equation. Penne's bioheat equation for temperature distribution of a living tissue is expressed as follows:
where ρ is the density of the medium, c is the specific heat capacity, T is the temperature, wb is the perfusion, ρb is the density of blood, cb is the specific heat capacity of blood, Qm is the metabolic heat generation rate, Tin is the blood entry temperature of the selected volume, t is the time, and QG is the microwave heat generation rate.
Equation (18) can be extended for connective tissue as follows:
(19)
where ρt is the tissue density, ct is the specific heat capacity of tissue, kt is thermal conductivity of tissue and Qt is microwave heat generation rate in tissue.
The energy transport equation of blood flow for an irregular temperature profile can be written as follows:
where Tb stands for the temperature of blood.
Considering a uniform temperature distribution inside the capillaries, Eq. (20) can be written as follows:
where Qb is the microwave heat generation in blood.
Considering the tumor as homogeneous, isotopic porous medium volumetric averaging [44] of bioheat equation can be achieved by adding Eq. (19) and (20) together, and be rearranged as follows:
Assuming that the thermal conductivity of tissue and blood remains constant with temperature, we can write the Eq. (22) as follows:
where .
All the terms appearing in the equation can be considered as local terms, as far as the microwave heat generation is considered.
Since the tumor as explained before is a porous medium of solid and liquid constituents, Eq. (23) can be modified as follows:
where is the effective heat capacity, is the effective heat conductivity, and is the effective heat generation due to microwave heating.
For a porous medium, the effective density and the effective specific heat capacity can be defined as follows:
and
where is the porosity of the media, is the density of the tissue and is the specific heat capacity of the tissue [45].
Porosity of the medium is defined as follows:
where V is the total volume of the constituents, and , the volume of the fluid constituents.
Effective thermal conductivity of the medium depends on the orientation of porosity. Thus, effective thermal conductivities of a porous medium, assuming the structure is homogeneous and isotropic as illustrated in Figure 3 and Figure 4, can be given as follows:
Medium1 (capillaries are parallel to the heat source),
Medium 2 (capillaries are perpendicular to the heat source),
Medium 3 (anisotropic capillary orientation) taking the geometric mean (103;104),
Using these effective values, temperature distribution of the esophageal wall can be modeled. The local heat generation within the interested tissue is assumed as not being buffered by the thermal control mechanisms of the body. The initial condition for the unsteady state bioheat equation is produced by solving the steady state equation, without the heat generation part and with the following boundary conditions:
at the esophageal wall heat is convected to the esophageal lumen,
where is the convection coefficient at the esophageal lumen, and is the temperature inside the esophageal lumen. Although under normal physiological conditions the esophageal luminal temperature is the same as the core body temperature, the insertion of a balloon catheter would alter this value within a very small range.
The temperature of deeper tissue is equal to core body temperature, which can be written as follows:
where T(L) is the temperature at a distance L and Tc is the core body temperature.
Therefore the steady state solution is given as follows:
Equation (24) can be solved with Green's function with the initial condition (Eq.(33)) and boundary conditions of Eq.(31) and Eq.(32) [46,47].
Equation (24) is difficult to solve with the perfusion term, and therefore it is modified with the following substitution:
where U is an arbitrary function.
The new equation with the initial and boundary conditions is given as follows:
where,
In the above equation, is the microwave power at the esophageal lining epithelium, and is the microwave absorption coefficient that changes with the frequency of microwave and also with composition of the medium.
The change of absorptivity with the constituents is not being considered in this study. In this model the absorptivity of MW is used without consideration of other microscopic features.
The initial condition is given as follows:
The boundary conditions are given as follows:
at x = 0,
at x = L
The Green function solution for equation for Eq. (35) is given as follows:
where , f(ini) is the right hand side of the Eq. (37), f(b1) is the right hand side of the Eq.(38), and f(b2) is the right hand side of the Eq.(39). The corresponding green function is given as follows:
where for the first few values. For the first value of which is , green's function is given as follows:
Selection of microwave power for local hyperthermia
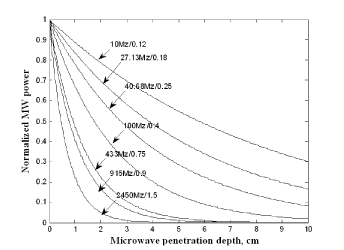
Microwave power does not penetrate deep into the tissues, given the high attenuation (Figure 8). Since tissue absorption of MW power increases with increasing power, it is safer to select a high power microwave. The depth of microwave power penetration is a function of the frequency utilized [44,45,48]. The modeling result of this study is at 2.45 GHz microwave.
Modeling results
Considering transient temperature responses of the esophageal tissue with continuous microwave heating at zero porosity, Eq. (24) is evaluated for constant perfusion and constant metabolic heat generation. For this calculation , , , , , , and (106-110). The transient temperature distribution of the esophagus is analyzed with 100 mW microwave heating. Microwave penetration depth in this case is 1.5 cm, with the temperature of the tissue being normal body temperature. A 1.5/cm absorptivity of human tissue for 2.45 GHz microwave source is used in this case.
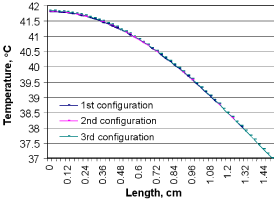
The possible results using three different capillary configurations are evaluated to select the appropriate modeling before obtaining further results. Figure 9 gives the temperature profile for a given tissue volume, considering these three different capillary configurations. With the results shown in Figure 9, it is evident that the capillary orientation does not play an important role in removal of the heat generated by microwave.
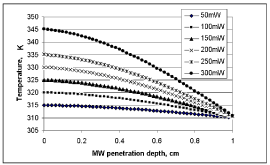
Microwave absorption rapidly changes as it penetrates deeper into the tissue, changing the heat generated within the tumor accordingly. At a certain depth, with a zero microwave effect, the tissue temperature is equal to normal body temperature, whereas above this point, the temperature is higher than the normal body temperature. Figure 10 shows the MW heating pattern of a 1 cm thick tumor volume. Each line indicates a different microwave power level. It is evident from these results (Figure 11) that the temperature generation increases with increasing MW power. But this increase is not linear in relation to MW power. What is also seen here is the drop in temperature generation with increasing MW penetration depth. The possible underlying mechanisms for the latter observation include the characteristics of the MW penetration profile, the nonlinear tissue thermal properties, and changes in tissue perfusion.
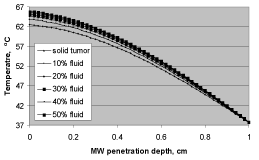
Tissue heating depends on the availability of fluid content within a selected volume. Due to higher molecular agitation, microwave heating is always higher with greater fluid content. In contrast, the solid content of tissue generates less heat. Following this a solid tissue generates comparatively less heat than tissue with a relatively large fluid content. The results as shown in Figure 11 using a 300 mW MW power, illustrate this phenomenon. The above power level when exposed for 50- seconds to a solid tissue brings its temperature up to 62 ℃, whereas the same MW power when exposed for a similar duration to a tumor with 50% more fluid content results in a temperature elevation up to 66 ℃. These results indicate that during microwave applications, tumors, given their high vascular network with more fluid content, are more susceptible to get overheated leading to cellular destruction. This technique has been used in treating cancers, where application of MW power is used selectively on malignant tissue while sparing the healthy non-malignant component.
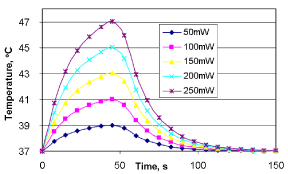
Tissue temperature resulting from MW heating depends on the extend of application time. Figure 12 shows the results of microwave heating of a solid tumor, where the microwave application is carried out during the first 50-seconds (the total time line being 150 seconds). The results show that the tissue temperature generated within a specific time, at each MW power level, is higher than the initial temperature. The MW heating profile changes with blood perfusion and the heat loss of the tissue volume. At a low MW power, the tissue heating occurs slowly since the rate of MW power deposition is low compared to the rate of perfusion. When the microwave power increases, the blood flow cannot compensate for the increasing temperature. It is important to note that in this work, other physiological factors that can buffer the increase of local tissue temperatures are not considered. Even though the exact mechanisms of such bodily resistances are not considered in detail, precautionary measures can be taken to avoid such resistance from the body.
Tissue temperature does not fall as rapidly as it rises with the onset of MW power. After MW power is turned off, the heat dropping phase is mainly governed by the rate of blood perfusion. Some scientists propose to study the blood perfusion using this technique [35]. The same phenomena can be used to measure the blood volume increase following MW heating. As is shown in Eq. (17), blood volume change is a function of temperature. In the same way, the rate of tissue temperature change is a function of blood flow. Therefore, by calculating the rate of temperature change, it is possible to estimate the blood flow velocity. In in-vitro testing, this method can be incorporated to calculate the rate of blood flow change due to microwave heating. The instrumentation for this technique may consist of an additional thermocouple, with the microwave antenna imprinted on the balloon catheter.
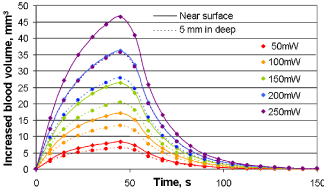
Figure 13 presents the same heating and cooling patterns as the Figure 12, but gives the temperature profile at the surface and at 5 mm depth at each MW power level tested. It is evident from this plot that the heating and cooling patterns change only with perfusion, with no effect of the location of the reading. The microwave penetration profile and the microwave-heating pattern with the depth of MW penetration are clearly visible here.
Combining Eq. (17) and Eq. (18) gives the change of blood volume due to microwave heating. The combination of these two equations gives the specific and transient changes in blood volume with temperature, as well as the oxygen level calculations. The model developed and the rest of the results shown in this paper are capable of showing the effect of MW on perfusion and oxygen concentration.
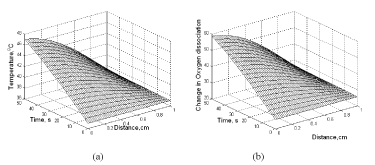
The change in temperature profile in the direction of microwave penetration, depending on microwave power and exposure time, can be obtained with Eq. (40). Figure 14a gives the results of transient and spatial changes in tissue temperature following a 100 mW, 0.15/cm absorptivity MW power. Figure 14b shows the plotted results using Eq. (40) as change in oxygen dissociation with the change of temperature. Under normal conditions, oxygen dissociation is around 25%, indicating that only 25% of the oxygen bound to Hb is released to the tissue. This percentage value is increased when the local temperature is raised as shown in the results illustrated in Figure 13a. The profile of change in oxygen dissociation is the same as the microwave heating of the tissue. Combination of Eq. (9) and Eq. (40) provides the effect of temperature on oxygen dissociation.
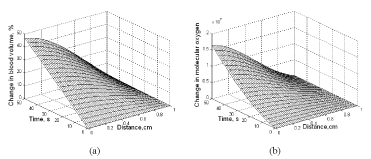
Equation (17) depicts the change in blood volume due to vasodilatation with the temperature change. Figure 15a illustrates the results of percentage change in blood volume with 100 mW heating. 0.2% vasodilatation per degree is used in Eq. (19) to plot Figure 15a. In addition, the actual length and the apparent length of the capillary are considered the same. A 50-second MW heating makes a 45% change in blood volume in the tissue nearest to the microwave applicator. The effect of microwave heating on the change in molecular oxygen is given in Figure 15b. This increase in molecular oxygen is due to increased blood volume and Hb-oxygen dissociation.
The heating pattern of a tumor changes with the growth of the capillary network. At the same time, oxygen generation is also changed since the amount of blood volume present in a mature tumor is considerably higher.
Different types of MW applicators are in current practice for different cancer treatments [14,46,49,50]. In the process of designing the antenna, it should be noted that the microwave should be transmitted outwards from the antenna surface, rather than towards the light delivery system. The s-parameters can be used to determine the capability of the antenna operating in this fashion [51]. Engineering aspects of the antenna, such as mechanical and electrical reliability, need to be tested before it is brought into use [52]. However, before the antenna is tested for clinical use, extensive in vitro and in vivo testing are to be explored. The ideal MW dosimetry for clinical practice still seems a distant goal, yet not beyond reach. The main aspects of MW applications are to be tested eventually in an experimental setting and compared with existing data [53].
Discussion
The objective of this study is to show how PDT of esophageal carcinoma can be improved by providing an optimum oxygen concentration with local hyperthermia. This paper has theoretically examined the effect of microwave heating of the esophageal wall to enhance the oxygen content, using the theory of bioheat transfer combined with the porous medium tumor model. The porous medium model facilitates an ideal environment in which to study the heating process and oxygen generation of the growing tumor. With this analytical model, it is easy to calculate the required microwave heating for irradiation tumors. The model also offered the transient effect of MW heating that enables scientists to understand the tissue heating pattern at different perfusion rate as well as for different tissue types.
For a normal tissue, a 10 ℃ increase in tissue temperature obtained by applying 100 mW, 2.45 GHz microwave power over 50 seconds, increases the blood flow in almost 50% and 107 number of oxygen molecules. This number is affected by the fluid content of the tissue, where an increased fluid content tends to increase the tissue heating. Furthermore as the blood volume increases with MW heating, the effect of blood volume is modified.
The developed theory needs to be validated with appropriate in vitro and in vivo testing. These results would enable scientists to understand the effect of thermo-regulatory issues on the model [54,55]. With this testing, the assumptions that can be excluded from the modeling can be specifically identified. For example, experimental results would definitively determine which capillary configuration is best suited for the MW heat enhanced oxygen content modeling in the esophagus. The physiological factors that buffer tissue heating are not considered in this paper, and it is assumed that the application of MW heating with pulse mode does not allow the body to react against the heating.
Reference to this Paper should be made as Follows
Happawana, G., Premasiri, A. and Rosen, A. XXX 'Tumor modeling and microwave heating for increasing oxygen in tumors during photodynamic therapy', J. Biomedical Engineering and Technology, Vol. X, No. X, pp. XX-XX.
Biographical Notes
Dr. Gemunu Happawana is a professor in the department of mechanical engineering at California State University, Fresno. Dr. Happawana holds a Ph.D. in mechanical engineering and Master of Science degree in mathematics from Purdue University, West Lafayette, IN and Bachelor of Science degree with honors in mathematics from University of Colombo, Sri-Lanka. His work lies in the fields of applied mechanics and photonics in biomedical applications. He has authored more than 60 journal and conference papers, and two books and book chapters.
Dr. Amaranath Premasiri received a BSc. degree in Materials Engineering and MEng degree in Mechanical Engineering from University of Moratuwa, Sri Lanka. He served on the faculty of Mechanical and Manufacturing Engineering at the University of Ruhuna, Sri Lanka between 2000 and 2003. He earned his Ph.D. in mechanical engineering from Southern Methodist University, Dallas, Texas. He is currently serving as a senior member of the technical staff at Akon, Inc., San Jose, CA. His research area is focused on opto-electronic packaging. He has authored more than 16 peer-reviewed publications.
Dr. Arye Rosen is a professor at Drexel University School of Biomedical Engineering, Science and Health Systems, and associate vice provost for strategic initiatives. He holds two Master degrees in engineering from Johns Hopkins University, Baltimore, MD. He received his Ph.D. degree in electrical engineering from Drexel University, Philadelphia, PA. He has authored more than 200 technical papers, co-edited two books and authored six book-chapters in the field of engineering and medicine. He holds over 60 U.S. patents in the fields of engineering and medicine. Dr. Rosen is an elected Member of the National Academy of Engineering.
References
- Dougherty TJ, Marcus SL (1992) Photodynamic therapy. European Journal of Cancer 28: 1734-1742.
- Dougherty TJ, Gomer CJ, Henderson BW, et al. (1998) Photodynamic therapy. J Natl Cancer Inst 90: 889-905.
- Rosen A, Rosen HD (1995) New frontiers in medical device technology. John Wiley Interscience.
- Van den BJ, Van Hillegersberg R, Van Staveren HJ, et al. (1999) Timing of illumination is essential for effective and safe photodynamic therapy: A study in the normal rat esophagus. Br J Cancer 79: 825-830.
- Foster TH, Murant RS, Bryant RG, et al. (1991) Oxygen consumption and diffusion effects in photodynamic therapy. Radiat Res 126: 296-303.
- Henning JP, Fournier RL, Hampton JA (1995) A transient mathematical model of oxygen depletion during photodynamic therapy. Radiat Res 142: 221-226.
- Tromberg BJ, Orenstein A, Kimel S, et al. (1990) In vivo tumor oxygen tension measurements for the evaluation of the efficiency of photodynamic therapy. Photochem Photobiol 52: 375-385.
- Ganong WF (2001) Review of medical physiology. (20th edn), McGraw Hill.
- Vaupel P, Fortmeyer HP, Runkel S, et al. (1987) Blood flow, oxygen consumption, and tissue oxygenation of human breast cancer xenografts in nude rats. Cancer Res 47: 3496-3503.
- Mintun MA, Lundstrom BN, Snyder AZ, et al. (2001) Blood flow and oxygen delivery to human brain during functional activity: theoretical modeling and experimental data. Proc Natl Acad Sci U S A 98: 6859-6864.
- Vaupel P, Schlenger K, Knoop C, et al. (1991) Oxygenation of human tumors: Evaluation of tissue oxygen distribution in breast cancers by computerized O2 tension measurements. Cancer Res 51: 3316-3322.
- Mitra S, Finlay JC, McNeill D, et al. (2001) Photochemical oxygen consumption, oxygen evolution and spectral changes during UVA irradiation of EMT6 spheroids. Photochem Photobiol 73: 703-708.
- Lewis RW, Morgan K, Thomas HR, et al. (1996) The finite element method in heat transfer analysis. John Wiley.
- Rosen A, Rosen H (1991) Catheter with distally located integrated circuit radiation generator. ScienceON.
- Van Geel IP, Oppleaar H, Rijken PF, et al. (1996) Vascular perfusion and hypoxic areas in RIF-1 tumors after photodynamic therapy. Br J Cancer 73: 288-293.
- Quaranta V, Weaver AM, Cummings PT, et al. (2005) Mathematical modeling of cancer: The future of prognosis and treatment. Clin Chim Acta 357: 173-179.
- Kuang Y, Nagy JD, Elser JJ (2004) Biological stoichiometry of tumor dynamics: Mathematical models and analysis. Discrete and continuous dynamical systems - series B 4: 221-240.
- Afenya EK, Calderon CP (2004) Growth kinetics of cancer cells prior to detection and treatment: An alternative view. Discrete and continuous dynamical systems - series B 4: 25-28.
- Kallinowski F, Schlenger KH, Runkel S, et al. (1989) Blood flow, metabolism, cellular microenvironment, and growth rate of human tumor xenografts. Cancer Res 49: 3759-3764.
- Riedel H (2007) Models for tumor growth and differentiation. Wiley Online Library.
- Banks-Schlegel SP, Quintero J (1986) Growth and differentiation of human esophageal carcinoma cell lines. Cancer Res 46: 250-258.
- Borkenstein K, Levegrun S, Peschke P (2004) Modeling and computer simulations of tumor growth and tumor response to radiotherapy. Radiat Res 162: 71-83.
- Sharan M, Singh MP, Aminataei A (1989) A Mathematical model for the computation of the oxygen dissociation curve in human blood. Bio Systems 22: 249-260.
- Stevens A, Lowe JS, Young B (2002) Wheater's basic histopathology: A color atlas and text. (4th edn), Churchill Livingstone.
- Thompson J. R. and Brown, B. W. (1987) Cancer modeling. Marcel Dekker Inc, New York.
- Vankan WJ, Huyghe JM, Janssen JD, et al. (1997) Finite element analysis of blood flow through biological tissue. Int J Engng Sci 35: 375-385.
- Levitzky MG (2003) Diffusion of gases and interpretation of pulmonary function tests. In: Levitzky MG, Pulmonary physiology. (6th edn), McGraw-Hill, 130-131.
- Breuer HWM, Groeben H, Breuer J, et al. (1989) Oxygen saturation calculation procedures: a critical analysis of six equations for the determination of oxygen saturation. Intensive Care Medicine 15: 385-389.
- Kelman GR (1966) Digital computer subroutine for the conversion of oxygen tension into saturation. J Appl Physiol 21: 1375-1376.
- Champe PC, Harvey RA (1994) Lippincotte's illustrated reviews: Biochemistry. (2nd edn), Lippincott Williams & Wilkins, USA.
- Rabin Y, Plitz J (2005) Thermal expansion of blood vessels and muscle specimens permeated with DMSO, DP6, and VS55 at cryogenic temperatures. Ann Biomed Eng 33: 1213-1228.
- Paut O, Bissonnette B (2002) Effects of temperature and haematocrit on the relationships between blood flow velocity and blood flow in a vessel of fixed diameter. Br J Anaesth 88: 277-279.
- Polk C, Postow E (1995) Handbook of biological effects of electromagnetic fields. CRC Press.
- Ozen S, Helhel S, Cerezci O (2007) Heat analysis of biological tissue exposed to microwave by using thermal wave model of bio-heat transfer (TWMBT). Burns 34: 45-49.
- Vorst AV, Rosen A, Kotsuka Y (2006) RF/Microwave interaction with biological tissues. (1st edn), John Wiley & Sons, Inc.
- Rosen A, Rosen H, Hsi RA, et al. (2003) Opportunities for microwaves and photonics in medical diagnostics and therapy. IEEE, Budapest, Hungary.
- Rosen H, Rosen A (2007) The efficacy of transurethral thermal ablasion in the management of benign prostatic hyperplasia. In: Rosen H, Rosen, A New frontiers in medical device technology. Wiley-Interscience.
- Foster KR (2000) Thermal and nonthermal mechanisms of the biological interaction of radio-frequency energy with biological systems. IEEE Transactions 28: 15-23.
- Eichler J, Liebetruth J, London RA, et al. (2000) Temperature distribution for combined laser hyperthermia-photodynamic therapy in the esophagus. Med Eng Phys 22: 307-312.
- Kou HS, Shih TC, Lin WL (2003) Effect of the directional blood flow on thermal dose distribution during thermal therapy: An application of a Green's function based on the porous model. Phys Med Biol 48: 1577-1589.
- Pennes HH (1998) Analysis of tissue and arterial blood temperatures in the resting human forearm. 1948. J Appl Physiol 85: 5-34.
- Charny CK, Weinbaum S, Levin RL (1990) An evaluation of the Weinbaum-Jiji bioheat equation for normal and hyperthermic conditions. J Biomech Eng 112: 80-87.
- Nyborg W L, Wu J (1994) Solution of the linear bio-heat transfer equation. Phys Med Biol 39: 924-926.
- Lage JL, De Lemos MJS, Nield DA (2002) Modeling turbulence in porous media," Pergamon, 2002. In: Ingham DB, Pop I, Transport Phenomena in Porous Media II.
- Kulish VV, Lage JL (2000) Diffusion within a porous medium with randomly distributed heat sinks. Int J Heat Mass Transfer 43: 3481-3496.
- Sullins A D, Daryabeigi K (2001) Effective thermal conductivity of high porosity open cell nickel foam. NASA Langley Technical Report Server.
- Haberman R (2003) Applied partial differential equations, 4 Edition. Prentice Hall.
- Romano VR, Marra F, Tammaro U (2005) Modelling of microwave heating of foodstuff: Study on the influence of sample dimensions with a FEM approach. Journal of Food Engineering 71: 223-241.
- Shock SA, Meredith K, Warner TF, et al. (2004) Microwave ablation with loop antenna: In vivo porcine liver model. Radiology 231: 143-149.
- Bhattacharya A, Calmidi VV, Mahajan RL (1999) An analytical-experimental study for the determination of the effective thermal conductivity of high porosity fibrous foams. (23rd edn),Springler-Verlag, 13-20.
- Anderson D, Smith L, Gruszynski J (1996) S-parameter techniques for faster, more accurate network design. Hewlett Packard test & measurement application note 95-1.
- Roemer RB (1999) Engineering aspects of hyperthermia therapy. Annu Rev Biomed Eng 1: 347-376.
- Lobo SM, Liu ZJ, Humphries S, et al. (2005) RF tumor ablation: Computer simulation and mathematical modelling of the effects of electrical and thermal conductivity. Int J Hyperthermia 21: 199-213.
- Sanyal DC, Maji NK (2001) Thermoregulation through skin under variable atmospheric and physiological conditions. J Theor Biol 208: 451-456.
- Ebert S, Eom SJ, Schuderer J, et al. (2005) Response, thermal regulatory threshold and thermal breakdown threshold of restrained RF-exposed mice at 905 MHz. Phys Med Biol 50: 5203-5215.
Corresponding Author
Gemunu Happawana, Department of Mechanical Engineering, California State University Fresno, CA 93740, USA.
Copyright
© 2021 Happawana G. This is an open-access article distributed under the terms of the Creative Commons Attribution License, which permits unrestricted use, distribution, and reproduction in any medium, provided the original author and source are credited.

