A Quick and Inexpensive Method to Determine Pesticide Residues in Olive Oil by UHPLC-MS/MS and GC-MS/MS
Abstract
Olive oil samples were analyzed for twenty-nine pesticides by means of gas chromatography and Ultra HPLC coupled to mass spectrometry. The list of the investigated pesticide residues includes the twenty-seven pesticide residues of the target protocol of COIPT proficiency tests, yearly organized in our laboratory.
The sample preparation procedure was based on acetonitrile extraction and on line cleanup C18 cartridges. The method was rapid, inexpensive and with a sufficient cleanup to reduce the effect of a complex matrix such as the olive oil.
The method was validated according to EU guidelines, including the estimation of the uncertainty measurement. In the estimation also the recovery component was considered, when a correction factor was applied during the calculation.
The dispersion of the individual recovery results (obtained collecting both the ongoing validation and QC data from the routine analysis) did not show a positive or negative bias but rather a symmetry of the data highlighting a normal distribution.
So it was possible to support also a good robustness of the method, in particular the overall mean recovery was a value of 99% and the within-laboratory reproducibility (RSDWR), derived from on-going method validation and routine quality control, was a value of 13%.
Keywords
Pesticide residues, Olive oil, Multiresidue method, Uncertainty measurement
Introduction
The olive oil plays a key role in the Mediterranean diet due to its beneficial effects in human health. The Conseil Oleicole International [1] has issued in November 2018 the production data in Europe and in the world: More than 90% of the worldwide olive oil is produced primarily in the Mediterranean Basin where is expected to be exposed to higher temperatures in the future due to global climate changes.
This level of climate warming will have varying impact on olive yield and fly infestation levels across the countries bordering the shores of the Mediterranean. All these aspects in the future will not only require further research but also analytical aimed monitoring of pesticide residues. The agronomic practices due to pests and/or weeds attack could increase the pesticide residue levels in the crops reducing the quality of olive oil and enhancing the risk from elevated exposure to these residual chemicals. Organic farming will also be affected by emerging infestations in future due to the general increase in temperature and humidity. In particular the insecticides are the main agrochemicals applied to minimize the losses in production, followed by fungicides and herbicides [2,3]. Olive fly is the most important pest: It is much more problematic in more humid, frost-free areas, where it can decimate the olive crop leading to greatly reduced oil quality. However, in dry, high-altitude areas, the presence of olive fly tends to be much less and control measures may not be necessary on a regular basis [4]. Olive fly is normally treated with Dimethoate sprays. Dimethoate is a very wide-spectrum agent which eliminates numerous different types of insect. It is therefore seen as a useful way of "cleaning" an olive plantation of potentially damaging pests. Many other pesticides are used in olive plantations including Fenthion.
Due to these different problems of pesticide contamination, the European Union have planned monitoring program including the olive oil since 2015 to assess the consumer exposure [5,6]. In fact the European Union [7] and the Codex Alimentarius [8] have set legal limits (MRL-Maximum Residue Limit) in olives and also in olive oil.
To control the pesticide in olive oil at levels imposed by current legislation or lower a multiresidue method should identify unequivocally target and non-target compounds with different physical-chemical properties and quantify with high precision and accuracy and finally be robust and quick enough for decision-making actions [9,10].
Usually the default lowest limit (LOD) in EU law is 0.01 mg/kg. The EU MRLs of pesticide residues are established in olives (as all crops) by the Regulation (EC) 396/2005 and amendments; to estimate MRLs in olive oil are used processing factors. Conventionally a processing factor of 5 has been applied in absence of experimental details of processing studies or not normally accessible.
Actually the analytical methods for pesticide residues in food are focused on the use of Mass Spectrometry combined with Gas and Liquid Chromatography (GC-LC). In the last decades the trend in the routine laboratories has been concentrated on Tandem Mass Spectrometry (MS/MS) [11,12]. The goal was to use an analytical method quick enough for decision. The QuEChERS methodology was recently explored for the analyses of pesticides in both olives and olive oil. Preliminary results are promising with good recovery rates for most of the pesticides, but less polar pesticides suffer from poor recovery percentages (below 70%) [2]. The tendency of the extraction methods in olive oils is moving towards development of single, cost-effective, high-throughput methodologies that yield clean extracts and good recoveries for a multi class pesticides and reduction in the total volume of organic solvents consumed (green extraction procedure). The new proposed method answers all these needs.
In fact this work shows a multi residue method quick and cheap and at the same time accurate and sensitive to determine the pesticide residues in olive oil samples down to 0.05 mg/kg applying both UHPLC-MS/MS and GC-MS/MS. The sample is extracted with the help of a limited volume of acetonitrile ad an aliquot of the organic phase was on line cleaned-up with C18 cartridges. The diluted final extract minimized the matrix effect, containing only 0.17 g of sample per mL. The method is confirmed for a target list of 29 specific analytes including Dimethoate and Fenthion with its metabolites.
The list of selected pesticides includes those for which maximum residue limits have been set at European level on olives supplemented with insecticides and fungicides characterized by a high liposolubility so to concentrate in the olive processing product.
Previously the methods of analysis for olive oil provided for more purification steps, above all if the instrumental technique involved the use of low specificity detectors such as NPD and/or ECD or the single quadrupole mass spectrometry [13]. These types of procedure required longer time for analysis and less sensitivity.
The method presented in addition to having a good sensitivity allows analyzing batches of six samples in the same day at the same time in GC and UHPLC.
The simplicity of the procedure, the use of selective solvents such as acetonitrile, purification with only C18 and the high specificity of MS/MS makes this new analytical procedure adaptable also to other types of matrices with a high fat content.
The measurement uncertainty was also assessed following the international guidelines [14-17]; concerning pesticide residue analysis, two typology of procedures are currently in use: a) top-down approach, the estimation can be based on default values, the main ways include the Horwitz equation or fit-for purpose relative standard deviation (FFP-RSD); b) bottom-up approach, the estimation is a function of the uncertainty sources. Repeatability of determination in spiked samples and uncertainty associated with the preparation of the calibration standard solutions (weighing, diluting) were identified as the most significant sources of combined uncertainty.
Materials and Methods
Apparatus
A Perkin Elmer System Flexar UHPLC, equipped with a AB Sciex 3200 Quadrupole Trap MS/MS detector (Brugherio, MB) was employed. The liquid chromatography was equipped with a Flexar autosampler (Waltham, Massachusetts). A valve of injection with a loop of 20 µl was used. The injection volume was between 5 µL. The detection was achieved by mass spectrometry equipped with electrospray ionization interface (ESI +). Typical source parameters were as follow: Ion spray voltage was 4500 V; temperature: 550 ℃; the ion source gases was at 55 psi and 60 psi. The collision gas was medium. Data analyses were performed by software Analyst workstation vers. 1.6.2. The column was a C18 (150 mm × 2 mm id, particle size 5 µm) with two different mobile phase, A: Formic acid solution in water (0.2%) and B: acetonitrile. The elution gradient starts with 10% of B for 7 minutes, after 100% of B for 7 minutes more and finally for 11 minutes at 10% of B.
An Agilent Technologies 7890 A gas chromatograph (Wilmington, De, USA), equipped with a 7000 GC/MS/MS Triple Quad detector was employed. The gas chromatograph was equipped with a Agilent Technologies 7693 autosampler (Wilmington, De USA). A PTV injector was used. Sample injection was carried out using the PTV solvent vent mode.
The column was a fused-silica-capillary with 5% phenyl/95% dimethylsiloxane (length 30 m, 0.25 mm of inner diameter and a film thickness of 0.25 µm). The column temperature was: 50 ℃ isothermal for 0 min, programmed to rise at 3 ℃/min to 70 ℃, isothermal at 70 ℃ for 1.8 min, programmed to rise at 25 ℃/min to 150 ℃, at 3 ℃/min to 200 ℃, isothermal at 200 ℃ for 10 min, programmed to rise at 8 ℃/min to 280 ℃, isothermal at 280 ℃ for 10 min.
The mass spectrometer was used in electron ionization (EI) operating in Multiple Reaction Monitoring (MRM) acquisition mode. The Transfer line temperature was kept at 280 ℃. Data acquisition was accomplished by Agilent Mass Hunter Workstation GC/MS Acquisition Software, version B.05.00. Data processing was accomplished by Agilent Mass Hunter Workstation Qualitative and Quantitative Analysis Software, version B.03.00 and B.05.00, respectively.
Standards and reagents
Pure analytical standards of 29 pesticides plus triphenyl phosphate (TPP), used as internal standard, were provided with a purity > 95% by Chem Service, Italy. Stock solutions were prepared at 1 mg/mL of acetonitrile or toluene and stored at -20 ℃. Standard mixtures were prepared in acetonitrile at 10 ug/mL mixing an appropriate volume of standard stock solutions, and further dilutions in acetonitrile were made in order to obtain the levels of validation.
Working solution of TPP in acetonitrile at 10 ug/mL was prepared by suitable dilution of the corresponding stock solution. Multi-level calibration standard solutions were prepared in matrix in the range between 0.03-1.0 mg/kg. The linearity of the GC-MS/MS and UHPLC-MS/MS method was checked by plotting a minimum of 5-point calibration curves.
All analytical reagent grade solvents were pure for analysis and supplied by Merck (Darmstadt, Germany) while Bond Elut cartridges C18 (0.5 g) by Varian (CA, USA).
Sample procedure
An aliquot of 2 g of olive oil was weighted (± 0.01 g) into a 15 mL PTFE centrifuge tube with screw caps and diluted with 1.5 mL of hexane. Oil and hexane were mixed by vortex for 20 seconds to obtain a homogeneous solution.
Then to the solution were added 4 mL of acetonitrile and a defined small volume of the ISTD solution (100 µL) and shacked vigorously by hand for 2 minutes and further 2 minutes assisted by a vibration device (e.g. vortex). The acetonitrile phase was collected into a 15 mL centrifuge tube. This extraction procedure was repeated once again and the acetonitrile phase were collected together; the final volume should be adjusted with acetonitrile to a value of 8 mL.
In the meantime a volume of 4 mL of the acetonitrile was introduced in the Bond Elut C18 cartridge in order to condition the cleanup system. The solvent was let to drain and was discarded. After that a portion of the homogeneous acetonitrile phase (exactly a volume of 4 ml corresponding to 1 g of matrix) was quantitatively transferred into the top of a Bond Elut C18 cartridge waiting for an even distribution into the cartridge. The system was eluted with further 2 mL of acetonitrile collecting the eluate into a 15 mL centrifuge tube positioned under the system. The following flowchart summarizes the main steps of the analytical procedure:
1. Homogeneize 2 g olive oil with 1.5 mL hexane and add 4 mL of acetonitrile
2. Shake samples vigorously for 2 minutes by hand and 2 minutes by vortex
3. Collect the acetonitrile phase in a centrifuge tube and repeat all steps
4. Clean up only 4 mL of the final extract by a Bond Elut C18
5. Elute the system with further 2 mL of acetonitrile
6. Inject to GC-MS/MS and UHPLC-MS/MS
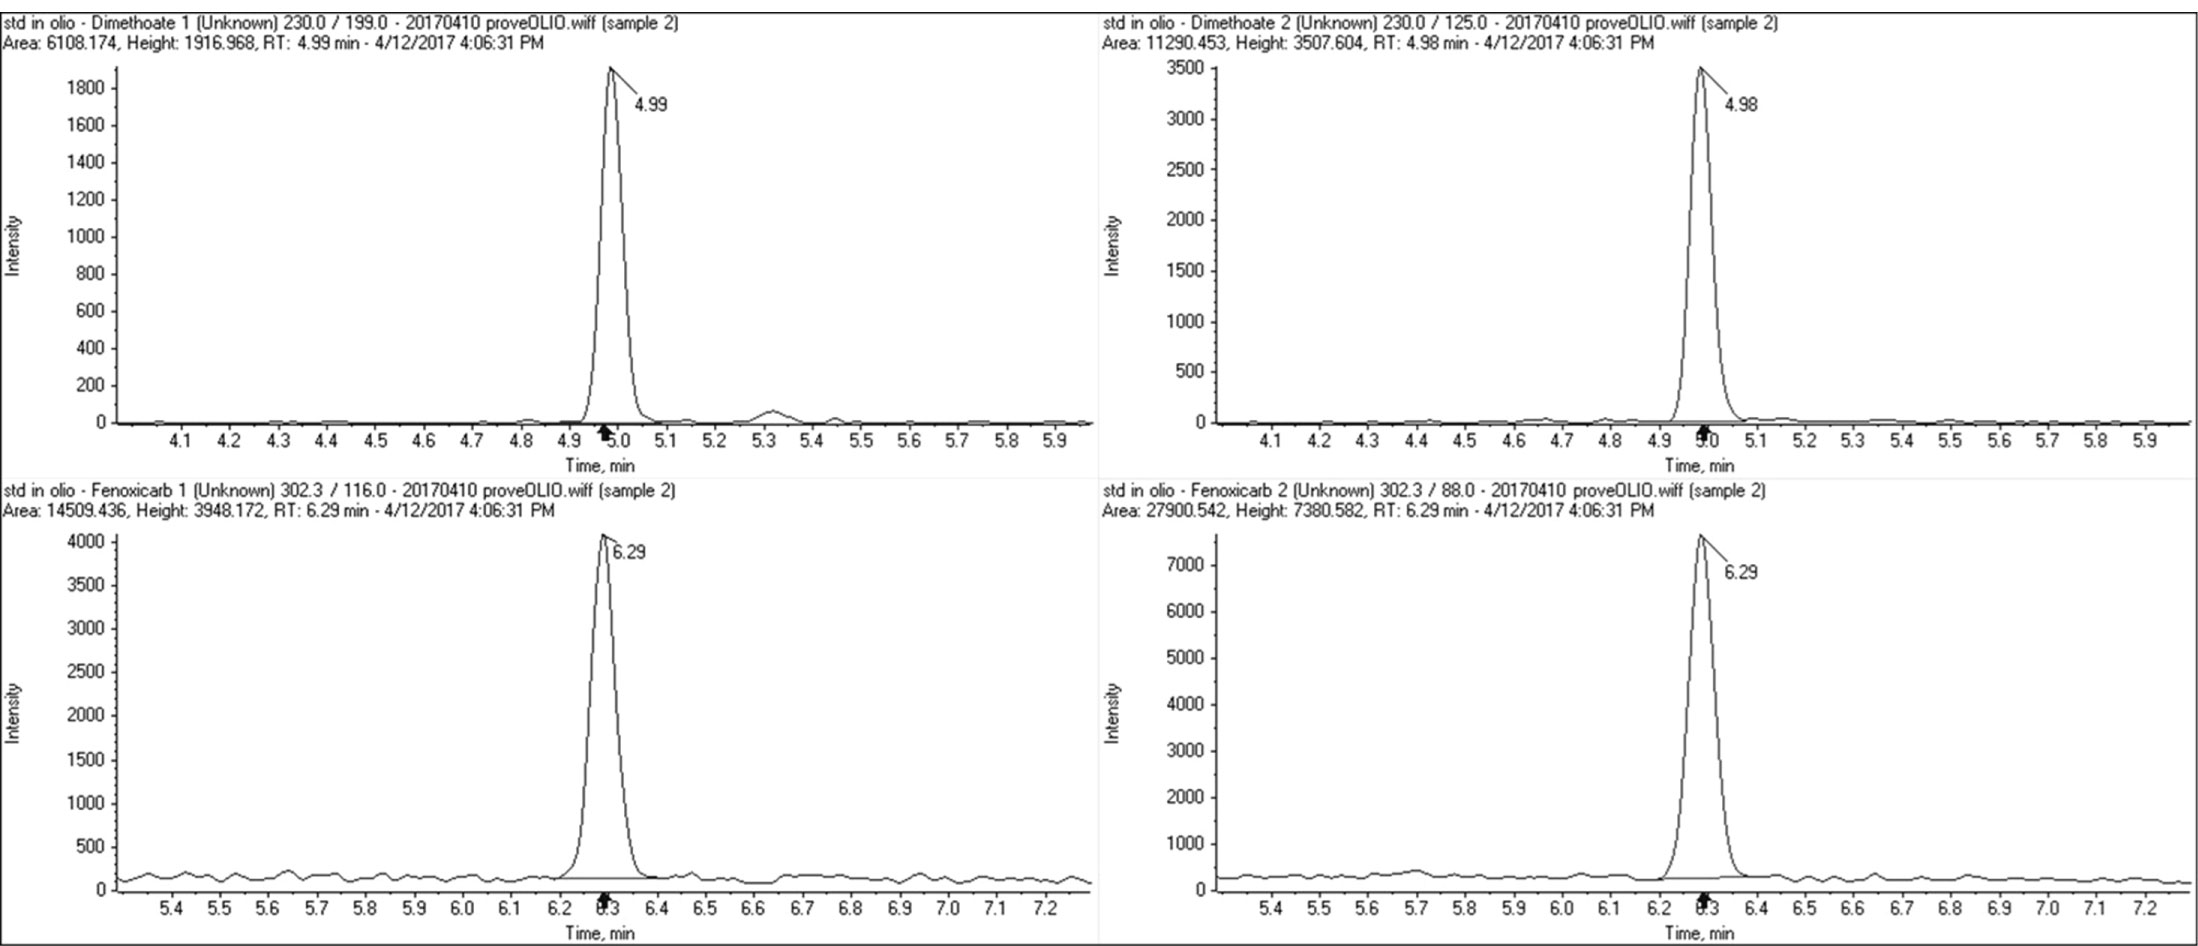
The obtained extract was analysed by GC-MS/MS and UHPLC-MS/MS. Quantification was carried out with a single-level calibration, using internal standard technique. The calibration standard mixture was prepared in matrix (matrix-matched standard) by adding the appropriate amount of standard mixture and the ISTD to blank samples processed with the entire procedure. In Table 1 was reported mass transitions for UHPLC/MS/MS and GC/MS/MS. A minimum number of two ion products were selected in MS/MS for the identification. Examples of chromatograms were reported in Figure 1.
Recovery tests
In order to investigate the trueness of method, some olive oil samples that had turned out to contain no investigated residue pesticides at the level of interest were used for the determination of recovery rates. For this purpose, known volume of standard mixture solutions were added to the selected samples at two spiking levels within a range corresponding to 1-10 times the quantification limit. A minimum of five replicates for each fortification level were processed. The elaboration data was performed by IBM SPSS Statistics 25 Software.
Validation protocol
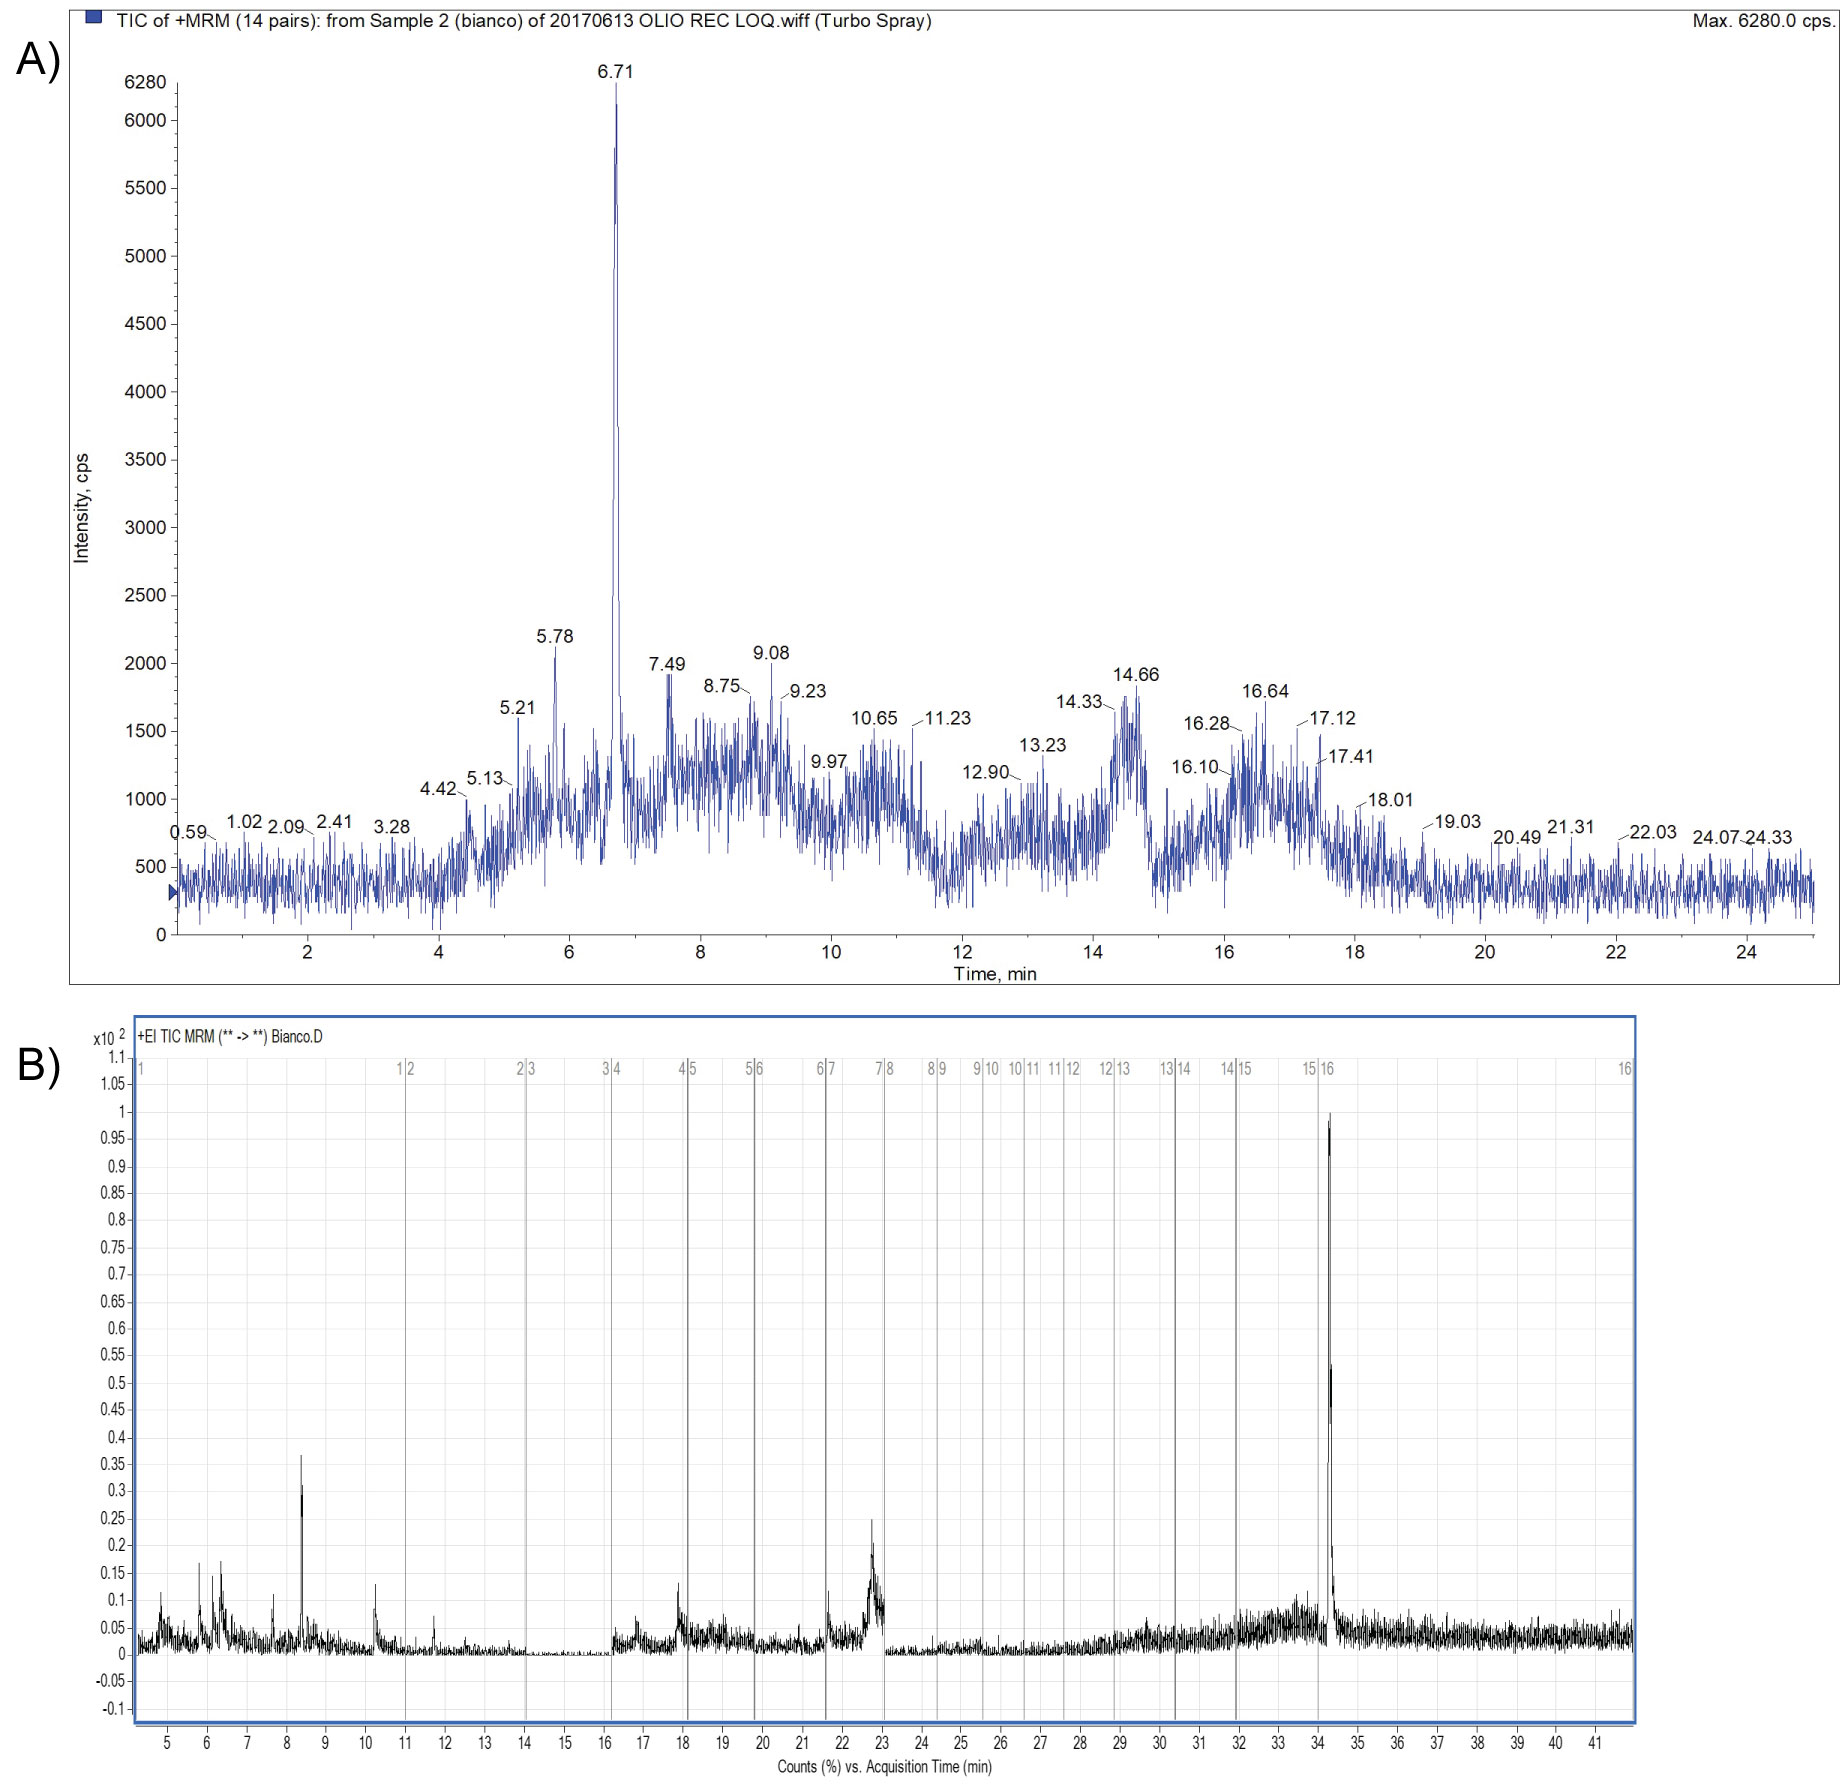
Within-laboratory method validation was performed to provide evidence that the method was fit for the intended purpose. The method described was accredited according to the EN ISO/IEC 17025 standard [18]; a full validation of the method was carried out taking into consideration the criteria of the document SANTE/11813/2017 [19]. The validation experiments involved the 29 pesticides residues that were spiked onto blank olive oil The following parameters were determined during validation of the analytical method: selectivity/specificity, limit of quantification (LOQ), mean recovery (the mean of all recoveries performed), linearity, precision and trueness evaluation. Blank samples were used to investigate the specificity of the method; Figure 2a and Figure 2b represents Total Ion Chromatograms of blanks by UHPLC-MS/MS and GC-MS/MS respectively, in MRM acquisition mode; moreover representative blanks were used to perform spiked samples at suitable concentration levels.
The lowest validated spiking level meeting the method performance criteria (mean recoveries in the range 70-120% with RSD ≤ 20%) was chosen as LOQ in accordance with the SANTE document. Table 2 summarized the validation parameters and the adopted acceptance criteria. A minimum of 5 replicates is required (to check the recovery and precision) at the targeted LOQ of the method and at least one other higher level, usually 10 × the targeted LOQ. Where the residue definition includes two or more analytes, the method has been validated for all analytes included in the residue definition (for example Endosulfan: sum of alpha and beta isomers and endosulfan-sulphate expresses as endosulfan).
One more important requirement of EN ISO/IEC 17025 standard was the determination of the uncertainty measurement associated with the results. A bottom-up approach has used to evaluate the measurement uncertainty. We have investigated the following contributions: weight of sample, calibration solutions, intermediate repeatability/intra-lab reproducibility studies, recovery studies, instrumental drift.
Quality assurance
The employed instruments were calibrated and their performance checked, the personnel were well-trained, and all data were obtained and properly documented following written standard operating procedures (SOPs). Good performance was obtained in several proficiency tests providing the ability of our laboratory to competently perform these tests.
Moreover in routine condition was performed recoveries during every analytical batch at LOQ or another concentration of concern to monitor during the time the parameters of repeatability and trueness.
Results and Discussion
This paper reports the analytical results obtained by using a Multi Residue Method for the determination of twenty-nine pesticide residues in olive oil. The complex analysis of this matrix was a continuing challenge mainly because of the small amounts of compounds to determine as well as the large amounts of interfering substances, which could be co-extracted with them.
The group of individual compounds selected for this investigation includes the twenty-seven pesticides listed in the target protocol of COIPT proficiency tests, yearly organized in our laboratory [20,21]. The use of a tandem mass spectrometry (MS/MS) technique combined with GC and UHPLC was investigated; the sample preparation procedure, based on acetonitrile and on line cleanup C18 cartridges was developed as to be rapid, inexpensive and with a sufficient cleanup to reduce the effect of a complex matrix such as the olive oil.
Finally, the method was been validated according to EU guidelines, including the estimation of the uncertainty measurement.
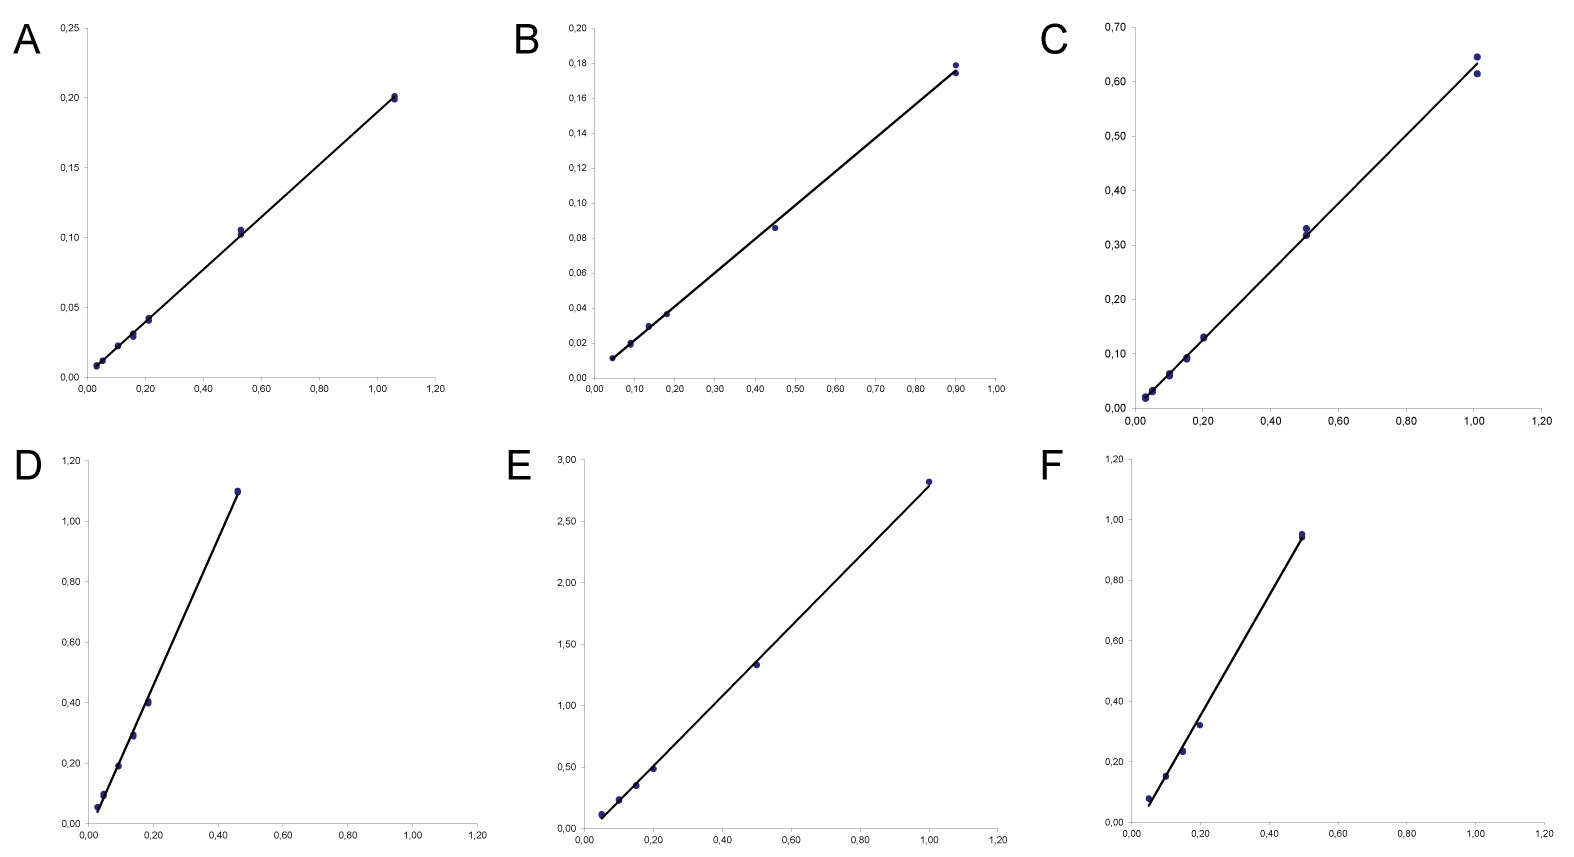
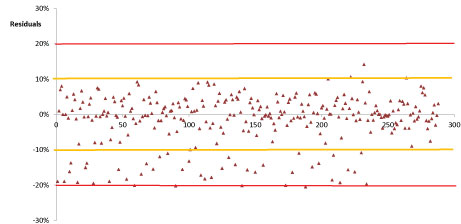
The linearity for all investigated pesticides was evaluated using matrix-matched calibration. A good linear relationship between peak area and concentration was been noted for all selected compounds, in Table 3 was reported the overall linear regression equations whereas examples of calibration curves are been shown in Figure 3. Moreover, the x-residuals were ≤ 20%, in conformity with the European guidance. Figure 4 reported the individual residuals data obtained for all investigated compounds. The investigated calibration range was between 0.03 mg/kg and 1 mg/kg; this calibration range encompassed the entire concentration range (0.05 mg/kg and 0.5 mg/kg) likely to be encountered.
Matrix-matched calibration was been used also to compensate for matrix effects. Practically, the matrix-matched standards were prepared in blank olive oil extracts so that they can provide the same amount of matrix induced suppressions/enhancement as in the sample extracts. It is clear that the signal enhancements caused by the coeluting matrix compounds can be nullified by quantification with matrix-matched standard, resulting in accurate quantification of the residues [22].
This strategy of matrix-matched standards is widely used for quantification of analytes. The majority of the pesticides presented a similar tendency, the exceptions are Fenitrothion and Phosalone.
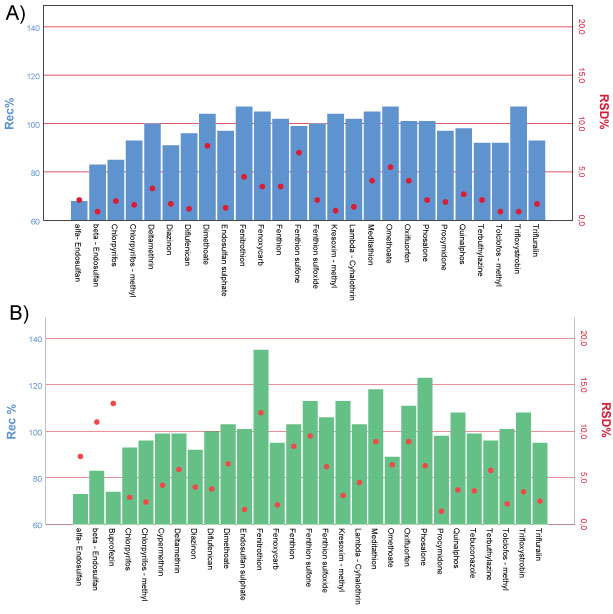
The results of the accuracy and precision, given in combination in Figure 5, have highlighted excellent repeatability (RSDr % less than the acceptance criterion of 20%) and good trueness with mean recoveries ranged between 70%-120%, except for Fenitrothion and Phosalone at the concentration level corresponding to LOQ.
These high values represented the influence of matrix components on the determination. It is known that when the concentration level decreases the effect of the amount of interfering compounds also increases affecting the recovery results [23].
The recoveries of the selected compounds have to be studied prior to the application in routine analysis. For this purpose and in accordance to the European guidance the analytical procedure has been validated to the SANTE/11813/2017 validation protocol for analytical techniques for pesticide residues analysis in food and feed. For each level a minimum of five recoveries have run during the validation tests. The LOQ was defined for each compound as the lowest level, for which the validation was achieved; and it was determined on the trueness and precision data obtained through the recoveries studies. On the basis of this consideration the LOQ of the method was set to 0.05 mg/kg. At this concentration level a larger recovery range is observed (from 70% to 120%); this could be attributed to different reasons: potential chemisorption on the matrix and influence of the matrix or irreversible adsorbed onto surfaces of the vessels. So recoveries outside these ranges may be acceptable typically with Multi Residue Methods.
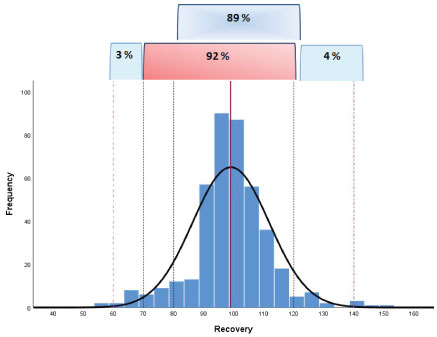
The dispersion of the individual recovery results obtained also collecting on going QC-data in routine analysis was shown in Figure 6: A total number of 415 individual recovery data were evaluated.
A percentage value of 89 of the data were in the range 80-120% demonstrating a high trueness of the method; only the 3% and 4% of the individual results were in the range 60-70% and 120-140%, respectively.
The frequency graph did not show a positive or negative bias but rather a symmetry of the data highlighting a normal distribution.
So it was also possible to support a good robustness of the method according to what was defined in the document SANTE (see Table 2). In particular the overall mean recovery was a value of 99% and the within-laboratory reproducibility (RSDWR), derived from on-going method validation and routine quality control, was a value of 13%.
Measurement uncertainty
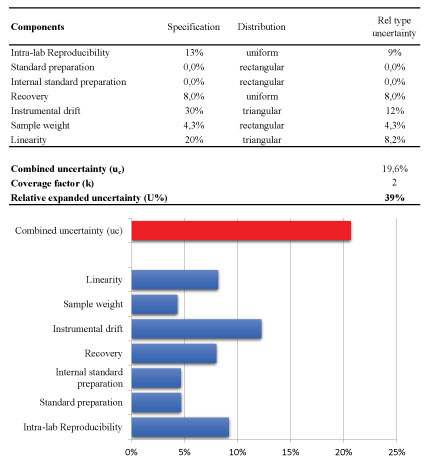
Afterwards, the magnitude of uncertainty of the analytical method was estimated using the laws of propagation for combining the most relevant contributions. The results were shown in Figure 7. The final result is normally expressed as expanded uncertainty U, which is the value of the combined uncertainty u (c) usually multiplied by a factor of coverage (k) of 2 (with 95% confidence level). In particular, the following contributions were considered as reported in Figure 7-the linearity, the instrumental drift between bracketing injections of the same calibration standard, the preparation of stock standard and internal standard solutions, the sample weight, the precision and finally combining them to the contribution that arise from the recovery when it is necessary to perform a correction of the analytical result.
For two main contributions (linearity and the instrumental drift), the own specifications were considered as reported in Figure 7; for linearity the maximum specification is a value of residuals of 20% whereas the significant instrumental drift of the bracketing calibration is a value of 30%. For these contributions, it is appropriate to assume a triangular distribution. Concerning standard preparation and sample weighting the contribution of the uncertainty on the weighting procedure was the main and the purity standard is similar; so it was assumed a rectangular distribution [24].
Other two important components were the precision and also the trueness (recovery) when a correction factor was applied during the calculation of the analytical result [25]. It is common practice that pesticide residues results are corrected for recovery, when the recovery rates range outside 80-120%, according to the method validation and quality control procedures for pesticides residues analysis in food and feed.
For the precision component, the standard uncertainty was evaluated as Type A with an uniform distribution and the value of relative standard uncertainty was originated from the within-laboratory reproducibility (RSDWR) from recovery experiments considering also the ongoing quality control data obtained in routine.
Following the rules of the specific guidelines [16,26] the contribution of recovery, estimated from spiked samples, again depends on the standard deviation of the results from ongoing quality assurance and the number (n) of replicates established to be performed during the analytical batch as quality control (n = 4, as defined in our quality control protocol) and finally it was necessary to consider to the recovery uncertainty also the contribution of the reference material employed to perform the spiking.
Following this approach, relative standard uncertainty rate of the precision and recovery components were 9% and 8%, respectively.
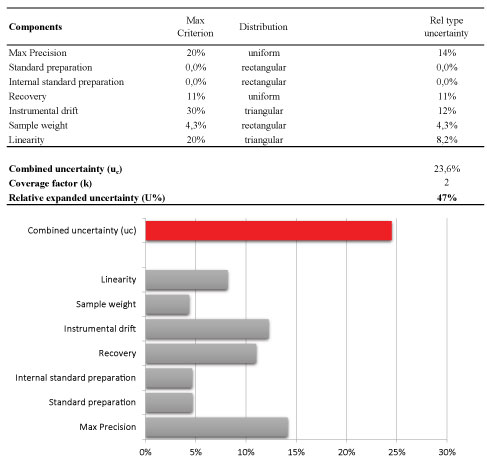
It is plausible to follow this approach when the individual QC recovery data obtained in routine are symmetrical or in any case distributed normally such as to indicate that the laboratory over time guarantees a valid and constant quality assurance. Otherwise this estimate could be unrealistic or underestimate the contribution due to recovery (fundamental if it is necessary to correct the analytical result). If a recovery data spread was observed (positive or negative) then a more conservative estimation of uncertainty would be necessary, considering as contribution the maximum value of 20% for the precision component (within-laboratory reproducibility RSDWR) also for the estimation of the recovery component. In Figure 8 was reported the results of the latter approach which centers on the maximum target values for the contributions permitting also to estimate the threshold of uncertainty measurement for a laboratory that analyze pesticide residue using multi residue methods.
To conclude, the relative combined uncertainty of 21% or 24%, obtained by the first and the latter approach, gives an estimate of the expanded uncertainty of 41% and 49%, respectively.
Conclusion
The sample treatment applied to a list of 29 pesticide residues was based on acetonitrile extraction of 2 g of olive oil followed by on line SPE clean-up using C18 cartridges, with a final extract containing 0.17 g of sample per mL. An effective strategy to decrease matrix effects was to reduce the matrix concentration in the final extract likewise the sample dilution technique. Therefore, the method developed was quick and inexpensive but at the same time accurate and sensitive for the detection of pesticide residues in olive oil samples down to 0.05 mg/kg; many threshold limits have been established at this concentration level. This method works well for accurate mass instruments since it is not instruments specific. In fact the method was successfully applied both UHPLC-MS/MS and GC-MS/MS. Moreover, only one single operator performed the six samples analysis during a day including simultaneously the instrumental analysis in both UHPLC-MS/MS and GC-MS/MS.
Finally, both values of the calculated expanded uncertainties were noticed less than the default value of 50% (corresponding to a 95% confidence level), routinely and systematically applied in Europe since 2006. The uncertainty due to the precision represents the most important cause of the total uncertainty, since 2002 Cuadros-Rodriguez, et al. [27] have applied the same approach in the estimation of uncertainty associated with determination of organophosphorus and organochlorine pesticides contained in vegetable products.
Regarding of the analytical methods a wide variety has been used, a summary of the last ten years of the analytical methods employed in the COI PT proficiency test rounds was reported in Table 4. A small number of laboratories routinely has used yet selective detectors often with unsatisfactory performance [28]. The most laboratories have used gas chromatography with mass spectrometry or liquid chromatography, necessary to determine certain polar pesticides in complex matrix. As alternative to GPC, other options involving the use of various SPE-based procedures-in both extraction and clean up steps have been used for the analysis of pesticides residues in olive oils. In recent developments also a clean-up step with dispersive SPE was explored for the analyses of pesticides in vegetable oils with good results except for the lipophilic compounds which are also those that tend to concentrate more on the olive processing product.
Compliance with Ethics Requirements
Conflict of interest
Patrizia Stefanelli declares that she has no conflict of interest, Tiziana Generali declares that she has no conflict of interest, Danilo Attard Barbini declares that he has no conflict of interest, Silvana Girolimetti declares that she has no conflict of interest.
Funding
Not applicable.
Ethical approval
This article does not contain any studies with human participants or animal performed by any of the authors.
Informed consent
Not applicable.
References
- Conseil Oleicole International (2018) Production data Olive oils.
- Garcia-Reyes JF, Ferrer C, Gomez-Ramos MJ, et al. (2007) Determination of pesticide residues in olive oil and olives. TrAC Trends in Analytical Chemistry 26: 239-251.
- Likudis Z, Costarelli V, Vitoratos A, et al. (2014) Determination of pesticide residues in olive oils with protected geographical indication or designation of origin. Food Science & Technology 49: 484-492.
- Amvrazi EG, Albanis TA (2009) Pesticide residue assessment in different types of olive oil and preliminary exposure assessment of Greek consumers to the pesticide residues detected. Food Chemistry 113: 253-261.
- European Commission (2014) Commission implementing Regulation (EU) n 400/2014 of 22 April 2014 concerning a coordinated multiannual control program of the Union for 2015, 2016 and 2017 to ensure compliance with maximum residue levels of pesticides and to assess the consumer exposure to pesticide residues in and on food of plant and animal origin. Official Journal of the European Union.
- European Commission (2015) Commission implementing Regulation (EU) n 595/2015 of 15 April 2015 concerning a coordinated multiannual control program of the Union for 2016, 2017 and 2018 to ensure compliance with maximum residue levels of pesticides and to assess the consumer exposure to pesticide residues in and on food of plant and animal origin. Official Journal of the European Union.
- European Parliament (2005) Regulation (EC) No 396/2005 of the European Parliament and of the Council of 23 February 2005 on maximum residue levels of pesticides in or on food and feed of plant and animal origin and amending Council Directive 91/414/EEC. Official Journal of the European Union.
- FAO and WHO (2017) International food standards codex alimentarius codex stan 33-1981. Standard for olive oils and pomace oils.
- Cunha S, Lehotay S J, Mastovska K, et al. (2010) Chapter 70 -mSample preparation approaches for the analysis of pesticide residues in olives and olive oils. In: Preedy VR, Watson RR, Olives and olive oil in health and disease prevention. Academic Press, 1465-1479.
- Hakme E, Lozano A, Ferrer C, et al. (2018) Analysis of pesticide residues in olive oil and other vegetable oils. TrAC Trends in Analytical Chemistry 100: 167-179.
- Anagnostopoulos C, Miliadis G E (2013) Development and validation of an easy multiresidue method for the determination of multiclass pesticide residues using GC-MS/MS and LC-MS/MS in olive oil and olives. Talanta 112: 1-10.
- Generali T, Stefanelli P, Girolimetti S, et al. (2015) Proficiency tests on olive oil organized by the italian national reference laboratory for pesticides: Long-term performance of laboratories. Accred Qual Assur 20: 247-253.
- Attard Barbini D, Generali T, Girolimetti S, et al. (2010) Validation of a method for the determination of pesticides residues in olive oil by GC/MS.
- European Committee for Standardization (CEN) (2000) UNI CEI ENV 13005 Guida all'espressione dell'incertezza della misura (Guide to the expresssion of uncertainty in measurement).
- European Accreditation Expert Group for EA Laboratory Committee (2003) European Accreditation guidelines on the expression of uncertainty in quantitative testing.
- CITAC/EURACHEM (2012) Guide Quantifying Uncertainty in Analytical Measurement, (3rd edn).
- Medina Pastor P, Valverde A, Pihlstrom T, et al. (2010) Comparative study of the main top-down approaches for the estimation of measurement uncertainty in multi-residue analysis of pesticide in fruits and vegetables. J Agric Food Chem 59: 7609-7619.
- European Standard (2017) General requirements for the competence of testing and calibration laboratories. ISO/IEC 17025: 2017.
- Directorate General for Health and Food safety (DG SANTE) (2017) Method validation and quality control procedures for pesticide residues analysis in food and feed.
- Generali T, Stefanelli P, Girolimetti S, et al. (2017) Proficiency Test on pesticide residues in olive oil in 2015. Rapporti Istisan 17/38.
- Generali T, Stefanelli P, Girolimetti S, et al. (2018) Results of the 16th proficiency test on the determination of pesticide residues in olive oil. Accred Qual Assur.
- Pano-Faria NS, Ceballos-Magana SG, Muniz-Valencia R, et al. (2017) Validation and assessment of matrix effect and uncertainty of a gas chromatography coupled to mass spectrometry method for pesticides in papaya and avocado samples. J Food & Drug Analysis 25: 501-509.
- Stefanelli P, Generali T, Girolimetti S, et al. (2013) Internal quality control as a tool for planning a robustness study regarding a multiresidue method for pesticides found in olive oil. Accred Qual Assur 18: 313-322.
- Stefanelli P, Attard Barbini D, Girolimetti S, et al. (2012) Estimation of measurement uncertainty associated to the determination of pesticide residues: A case study. J Environ Science and health 47: 804-813.
- Thompson M, Ellison SLR, Fajgeli A, et al. (1999) Harmonized guidelines for the use of recovery information in analytical measurement. Pure & Appl Chem 71: 337-348.
- Barwick VJ, Ellison SLR (2000) VAM Project 3.2.1. Development and harmonization of measurement of uncertainty principles. Part (d): Protocol for uncertainty evaluation from validation data.
- Cuadros-Rodriguez L, Hernandez Torres ME, Almansa Lopez E, et al. (2002) Assessment of uncertainty in pesticide multiresidue analytical methods: Main sources and estimation. Anal Chim. Acta 454: 297-314.
- Stefanelli P, Generali T, Girolimetti S, et al. (2018) Evaluation of the reproducibility standard deviation in the pesticide multi-residue methods on olive oil from past proficiency tests. Accreditation Quality Assurance.
Corresponding Author
Patrizia Stefanelli, National Institute of Health (Istituto Superiore di Sanità), Department of Environment and Health, Pesticide Section, 299-00161, Viale Regina Elena, Rome, Italy, Tel: +39-06-4990-2615, Fax: +39-06-4990-2360.
Copyright
© 2019 Stefanelli P, et al. This is an open-access article distributed under the terms of the Creative Commons Attribution License, which permits unrestricted use, distribution, and reproduction in any medium, provided the original author and source are credited.