Detection of Agglomerates Using Hydrodynamic Chromatography Hyphenated with Single Particle Inductively Coupled Plasma Mass Spectrometry
Abstract
A method was developed for the detection of nanoparticles and their state of agglomeration by combining hydrodynamic chromatography (HDC) with single particle inductively coupled plasma mass spectrometry (spICP-MS). Gold nanoparticles were measured under different conditions including the simulation of one of the most important human body functions, the human digestion. Nanoparticle detection and characterization was clearly demonstrated by the analysis of individual particles and a mixture of 30, 60, 100 and 200 nm particles at mass-based concentrations in the ngL-1 (ppt) range. For HDC a clear linear relationship was found between the retention time and the square root of the particle diameter. An agglomeration experiment to determine the packing density of the detected particles showed that it is possible to determine whether the detected particles are primary particles or agglomerates. In addition, the application of HDC hyphenated with spICP-MS was able to elucidate the fate of nanoparticles in the gastrointestinal track. The results showed that primary gold particles that enter the body in the saliva stage, agglomerate in the stomach to larger sized agglomerates which de-agglomerate back to the primary particles in the intestine stage. The results of this experiment show that HDC-spICP-MS is able to detect nanoparticles and agglomerates there of in complex matrices.
Keywords
Hydrodynamic chromatography, Single particle ICP-MS, Nanoparticles, Agglomerates
Introduction
Hydrodynamic chromatography (HDC) separates particles according to size [1]. Because of steric exclusion, large particles in a tube or column can only access the central region of the column with the highest flow velocity due to the parabolic shape of the flow profile. HDC is a rapid technique and several techniques were developed around this simple separation principle. The most popular variants use a capillary or a column packed with monodisperse spherical beads. While the size resolution of packed-bed HDC is lower than that of other separation techniques [2], the low performance is compensated by its simplicity and robustness towards complex matrices [3-6], In addition, packed-bed HDC implementation and method optimization is straightforward and allows measuring ionic background in contrast to asymmetric field flow field fractionation (AF4), which is currently the most popular separation technique for nanomaterials in environmental and food science [7]. In AF4 effects of affinity of particles with the membrane can be observed even under optimal conditions and are lower in packed-bed HDC than in AF4 [8,9]. Nonetheless, direct comparison of packed-bed HDC with AF4 shows that advantages and drawbacks are balanced as AF4 has a much better size resolution and allows pre-concentration [10].
As described by Striegel and Brewer, the separation in HDC is based on the parabolic flow that develops with laminar flow in an open tube or in between the beads of the packed column [1]. The packing of the column is inert and impermeable to NPs and therefore the separation must occur in the interstitial or void space of the column. According to Small, et al. [11] at least three effects should be considered; the hydrodynamic effect, the ionic strength effect and the van der Waals interactions.
The particle carried through the column by the flow of the mobile phase will diffuse as a result of the Brownian motion [12]. This means that particles will be in all locations in the void space of the column and have an mean velocity similar to the mobile phase with the limitation that the size of the particle prevents it from moving into the slower velocity regions close to the wall of the column. The larger the particle the more it is rejected from the low-flow regions and consequently the greater its mean velocity. Instead of being only dependent on the particle diameter the separation also depends on the ionic strength of the mobile phase as shown by Small, et al. [11]. The chromatographic separation between particle sizes was found to increase with decreasing ionic strength of the eluent. The electrical double layer of particles can lead to electrostatic interactions between the particles and the surface of the packing. The electrostatic repulsion determines the distance between the particles and the surface of the packing which in turn determines the position of the particles in the eluent flow and influences the velocity of the particles. In a low ionic strength eluent the particles will be repelled from the surface of the packing and are forced more into the faster moving eluent stream lines [11]. The van der Waals interactions between particles and column packing become more important when the distance decreases. The particles will stick more to the column packing and, considering the interaction is reversible, the particles will elute later. This occurs because the double layer of the particle diminishes and the particle can approach closer to the packing. When the ionic strength of the eluent is too high, the particles will be bound to the packing material and not elute [11]. The inert beads in the packed HDC column should minimize non-HDC interactions like electrostatic and van der Waals interactions between the column packing and the analytes. The non-HDC effects are especially common in aqueous solvents but can be minimized by the addition of salts or surfactants to the mobile phase [13]. The average velocity of particles in a HDC column can be described as:
The parameter λ is the ratio of the effective radius of the analyte to the radius of the capillary and the average flow velocity of the medium. From this equation the dimensionless residence time of the analyte can be described as:
This equation is idealized in which particles are described as nonrotating, hard spheres. In practices one portion of the particle experiences a faster velocity than the other side of the particle and this causes the particle to rotate. More non-idealistic is that particles may not be spherically shaped and maybe permeable [13]. To account for these factors a modified quadratic term is added:
The only direct way to determine number-based particle size distributions is to use a single particle counting method. The concept of using ICP-MS for single particle analysis and colloid suspensions was first published by McCarthy and Degueldre [14-16]. More recently, single particle inductively coupled plasma mass spectrometry (spICP-MS) has been described as a tool for the detection and characterization of nanoparticles (NPs) and various applications have been published [17]. Its combination of elemental specificity, sizing resolution, and sensitivity makes it applicable for the characterization of ENPs containing elements such as Ag, Au, Ti (TiO2), and Si (SiO2). This technique is suited to differentiate between the analyte in solution and existing as a NP without any prior separation techniques, simplifying nanoparticle analysis while eliminating complex sample preparation steps. This ability allows spICP-MS to provide information on the size and size distribution of NPs, as well as the dissolved concentration of the analyte. Fully validated analytical methods using spICP-MS have been published [18] and the reliability of the method has been tested in inter-laboratory exercises [19-21].
When introduced into the ICP-MS, a metal or metal oxide based NP is atomized and ionized producing a plume of ions in the plasma torch which is sampled by the mass spectrometer and results in a signal pulse. The number of pulses that are detected allows the determination of the NP concentration in the sample as well as the mass of the metal in the individually detected NPs. The particle size can be calculated if the particle's density and stoichiometry are known. The particle size that is calculated in this way is the equivalent spherical diameter, as if all mass is centered in a sphere. For primary particles this may be a good approximation, however for aggregates and agglomerates which contain a lot of empty space this will be an underestimation from the true size or of the hydrodynamic diameter of these particles.
Only very recently have ICP-MS suppliers begun to incorporate such software in new ICP-MS systems. Information about data calculation and evaluation can be found in the literature [17,22,23]. The following steps and calculations are required to determine the particle size:
Determine the nebulization or transport efficiency of the ICP-MS system using a well characterised nano-particle. Determine the detector response factor for the analyte of interest using ionic certified reference materials for calibration. Calculate the transport efficiency as follows:
where is the transport efficiency; NP is the number of particles detected in the time scan (min-1); cn is the particle number concentration (L-1); V is the sample input flow (mL min-1).
In general an equivalent spherical diameter is determined from the particle mass assuming a spherical shape. If the particle shape is known the actual shape can be considered in the calculation resulting is a more accurate particle size. The particle mass is calculated from the peak height or area in the time scan recorded by the ICP-MS instrument. Particle mass is calculated as follows:
where mP is the particle mass (ng); IP is the particle signal intensity in the sample (cps); RFion is the ICP-MS response for an ion standard (cps µg-1 L-1); td is the dwell time (s); V is the sample flow (mL min-1); ηn is the nebulization efficiency; MP is the molar mass nanoparticle material; Ma is the molar mass analyte measured.
The particle's equivalent spherical diameter is calculated as follows:
where dP is the particle diameter in the sample (nm); mP is the particle mass (ng); ρP is the particle density (g mL-1). From the results for the individual particles, the mean particle size and the size distribution of the particles in the sample suspension can be calculated.
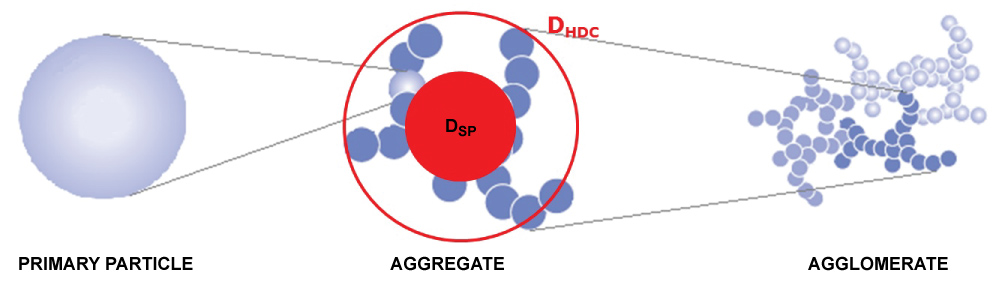
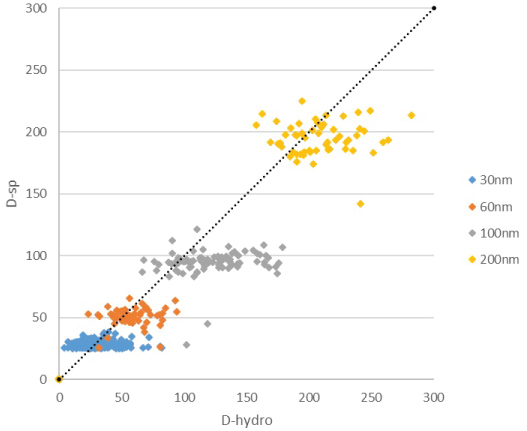
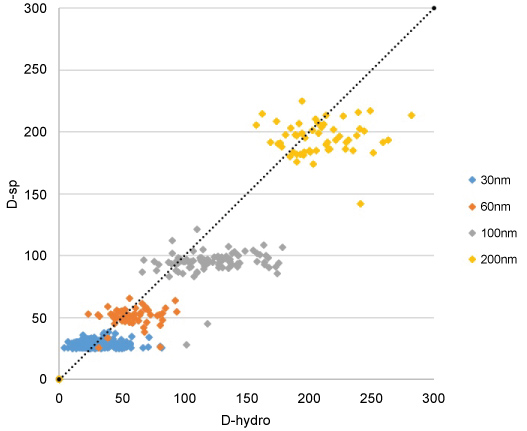
Hyphenation of HDC with ICP-MS has been developed before and is possible since the column flow of the HDC and inlet flow of the ICP-MS are compatible and both can handle analyte concentrations in the low µg/L range [8,24,25]. A combination of HDC and spICP-MS gives information on the agglomeration state of a particle since HDC determines its hydrodynamic diameter, DHDC, while spICP-MS determines its mass and from that its equivalent spherical diameter, DSP, as shown in Figure 1.
In geometry, a spherical packing is an arrangement of non-overlapping spheres within a containing space. The density of this packing typically is the ratio of the space occupied by the spheres and the total containing space. The packing density of a typical cubic lattice is approx. 0.524, that of a hexagonal lattice is approx. 0.605 and that of a tetrahedral lattice is approx. 0.340 while that of the loosest possible packing has a packing density of 0.056 [26]. For "solid" primary particles the density packing would be 1 while it will be < 1 for aggregates and agglomerates. In this case an agglomerate is defined as a reversible collection of weakly bound particles or aggregates, for example by van der Waals forces or physical entanglement, and where an aggregate is defined as irreversibly bonded or fused primary particles, for example through covalent bonds [27]. The packing density is the ratio of volume occupied by the primary particles (VSP) and the total volume of the particle (determined by VHDC) and is calculated as follows:
The objective of this study was to determine the morphology of agglomerates from primary gold nanoparticles. As a practical application the morphology of primary nanoparticles and agglomerates in the several stages of a model for human digestion was studied.
Materials and Methods
Materials
Gold nanomaterials were obtained from nanoComposix, San Diego, US. All chemicals were obtained from Merck, except for MgCl2, glucuronic acid, lipase (pig), and R-amylase (bacillus species) which were obtained from Sigma, and sodium n-dodecyl sulphate (C12H25NaO4S) was obtained from Fluka, glucosamine hydrochloride was obtained from Calbiochem, mucin (pig) was obtained from Carl Roth (Karlsruhe, Germany), and sodium chloride and uric acid were obtained from VWR (Amsterdam, The Netherlands). Ultrapure water (UPW) was prepared using a Milli-Q system from Millipore, Molsheim, France.
HDC-spICP-MS
HDC coupled with single particle inductively coupled plasma mass spectrometry (HDC-spICP-MS) is used to determine the hydrodynamic and spherical equivalent size of particles. The HDC system is a Thermo Scientific Spectra system P-4000 liquid chromatograph (Waltham, MA, USA) equipped with a PL-PSDA HDC cartridge, type 1, length 800 mm, diameter 7.5 mm, packed with non-coated, non-porous silica spheres (Agilent Technologies, Wokingham, UK). The eluent is an aqueous 10 mM solution of sodium n-dodecyl sulphate (SDS) with a flow rate of 1.0 mL/min. Sample injection volumes were 50 µL. The ICP-MS is a Thermo X Series 2 (Waltham, MA, USA), equipped Burgener PEEK Mira Mist nebulizer and a quartz impact bead spray chamber, and operated at an RF power of 1400 W. The gas flow settings were as follows: 13 L/min for the plasma, 1.0 L/min for the nebulizer, and 0.7 L/min for the auxiliary. Data acquisition was performed in the selected ion monitoring mode monitoring an m/z ratios of 192 that is characteristic for gold.
Agglomeration experiment
For the agglomeration experiment, 5 µL of a suspension of 60 nm Au NPs with a concentration of 1 g/L was diluted in 50 mL of 5 mM CaCl2 in a Greiner tube. The mixture was homogenized by short vortexing and allowed to stand for time periods of 0, 10, 20, 40, 60, and 120 min. After each time period 50 µL subsamples were collected and diluted further in 5 mL UPW. Diluted samples were analyzed immediately using HDC-spICP-MS.
In vitro digestion
The in vitro digestion model consists of three steps: saliva, gastric, and intestine digestion. Artificial digestive juices for the digestion experiments were prepared on the day before the actual digestions. The constituents and concentrations of these juices were described in detail elsewhere [6]. The digestion starts by introducing 6 mL of artificial saliva to 5 mL of a NP suspension with an NP concentration of 1 mg/L. This mixture is rotated head-over-head for 5 min at 55 rpm at 37 ℃. At the end of the digestion experiment a 50 µL sample is collected from the centre of the digestion vessel and diluted in 5 mL Milli-Q water to stop or slow down nanoparticle agglomeration. For the next step, 12 mL of gastric juice is added to the mixture and the pH is adjusted to pH 2.0 ± 0.5 with HCl (37% w/w). While the mixture is rotated head-over-head for 2 h several 50 µL subsamples were collected to investigate the dynamics of the agglomeration process. The 50 µL samples were diluted to 5 mL with UPW and analysed immediately using HDC-spICP-MS. Finally, 12 mL of duodenal juice, 6 mL of bile juice, and 2 mL of NaHCO3 solution are added to the mixture and the mixture pH is adjusted to pH 6.5 ± 0.5 with NaOH (1M). The mixture is rotated head-over-head for another 2 and, as before, several 50 µL samples were collected, diluted and analysed to investigate the dynamics of the de-agglomeration process.
Results
HDC-spICP-MS
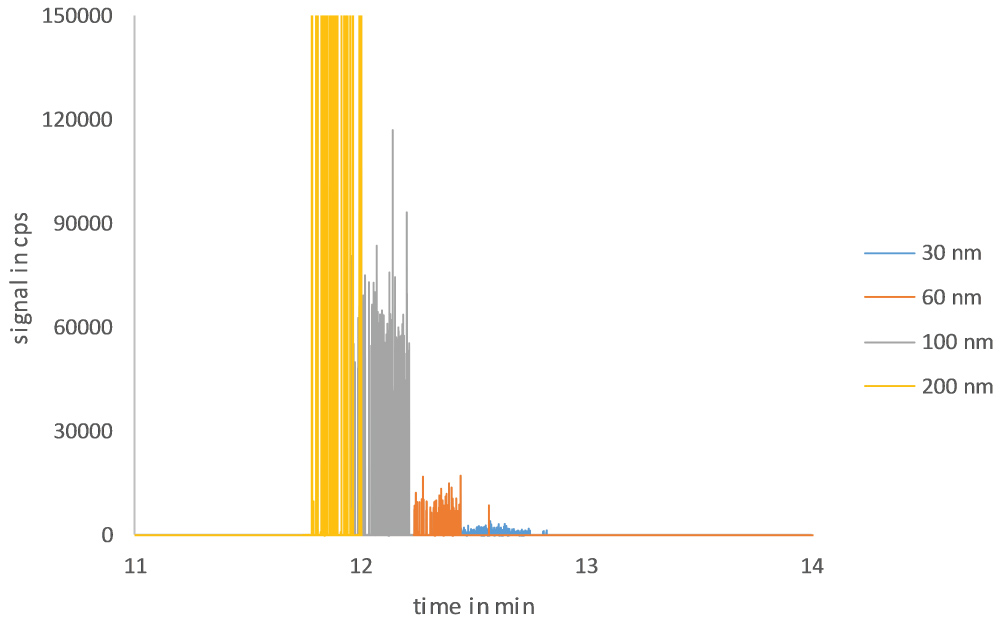
The scope of this study was the development of a method for size separation of nanoparticles with HDC coupled online with ICP-MS to determine the presence of nanoparticles, aggregates and agglomerates. At first the separation of nanoparticles on the HDC column was optimized. After some testing, a mobile phase of 1 mM SDS and a flow of 1 mL/min were used. A typical HDC-spICP-MS chromatogram is presented in Figure 2, in which signal spikes originating from 30, 60, 100 and 200 nm gold nanoparticles are shown in concentrations in the ng/L range. As can be observed, the chromatogram does not show the typical chromatographic peaks, but is composed of spikes of the individual particle peaks. The 30 nm Au-NP particles give a peak intensity about 1500 cps. The 60 nm Au-NP is twice the size of the 30 nm Au-NP and thus 23 times the mass of the 30 nm Au-NP. Since the peak intensity correlates directly with particle mass we expect that the peak intensity for 60 nm Au-NP is 23 times 1500 cps is about 12000 cps. For the 100 nm Au-NP we expect a peak intensity of 3.33 times 1500 cps is about 55000 cps. For this particle size we find a peak intensity of around 60000 cps which confirms the expected peak intensity. Finally, the 200 nm particle shows a signal height of about 450.000 cps, about 23 times that of a 100 nm particle.
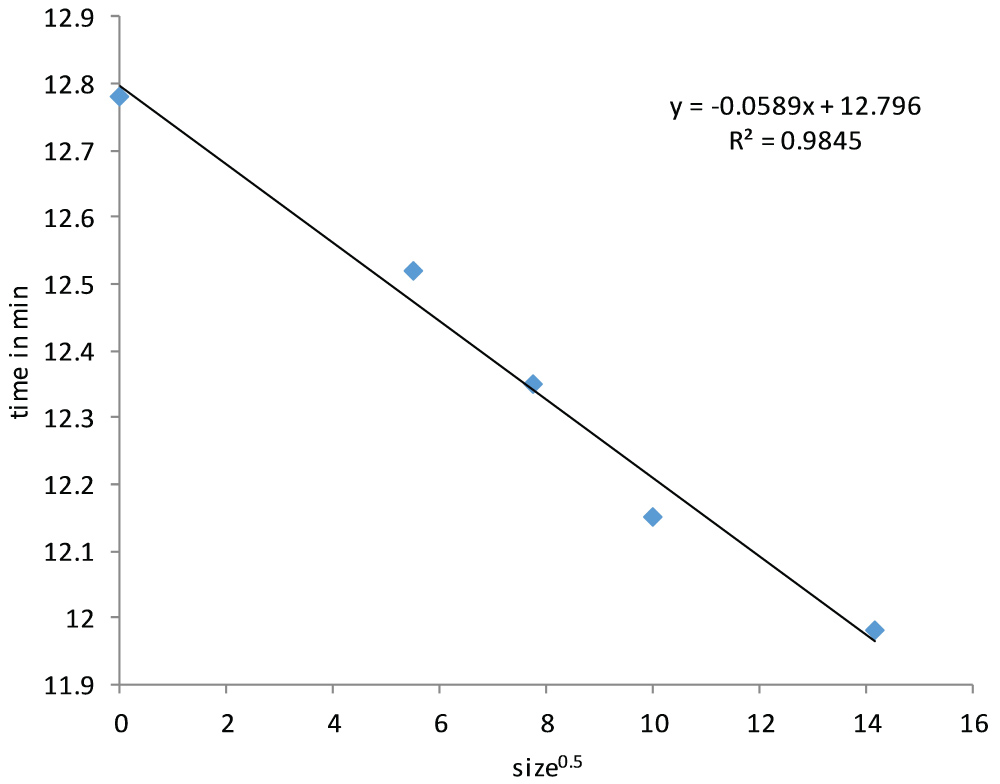
From the chromatogram we can also determine the retention time, although extracting the retention time from a chromatogram with spikes is not so straightforward. One way to deal with this would be to record the retention time of each individually detected NP of a given signal intensity and calculate the average retention time. In Figure 2 the retention time was about 12.5 min for a 30 nm Au-NP, 12.3 min for 60 nm Au-NP, 12.1 min for 100 nm Au-NP and 11.9 min for a 200 nm Au-NP. Ionic gold can also be observed and shows a peak with a retention time of about 12.8 min. As expected from HDC theory and previous publications a linear relationship is observed between the retention time and the square root of the particle diameter [28,29]. The HDC calibration curve is shown in Figure 3 and has been used to calculate DHDC from the retention time of particle peaks in unknown samples.
To determine the spherical equivalent particle size in spICP-MS (DSP) each obtained particle signal needs to be considered. The method described by Peters, et al. is used to calculate DSP for all observed particle. In this method the spICP-MS data is imported in two columns of a spreadsheet where it has the form of a time scan, signal height as a function of time. A frequency distribution has been used to separate particles from background noise. Mass calibration is performed using ionic gold standards and the spreadsheet calculates the mass of each individual particle. From the mass the particles diameter is calculated assuming a spherical shape. While the particle mass concentration is calculated from the sum of the masses of the individual particles, the particle number concentrations is calculated from the number of peaks that are observed. Both are corrected for the transport efficiency, i.e. the part of the eluent of the HDC column that enters the plasma. We have added an additional column to this spreadsheet in which DHDC is calculated from the retention time of each detected particle by the hydrodynamic calibration function in Figure 3. Finally, the DHDC and DSP are plotted against each other in an Excel spreadsheet. This has been done for the mixture of the 30, 60, 100 and 200 nm Au-NP and results in a cloud of data points for each group of particles in Figure 3. The centres of particle clouds are more or less on a line with a 45° angle which is what we expect from solid, primary particles. The results in Figure 4 also show that there is more spreading in the HDC direction then in the spICP-MS direction.
Agglomeration experiment
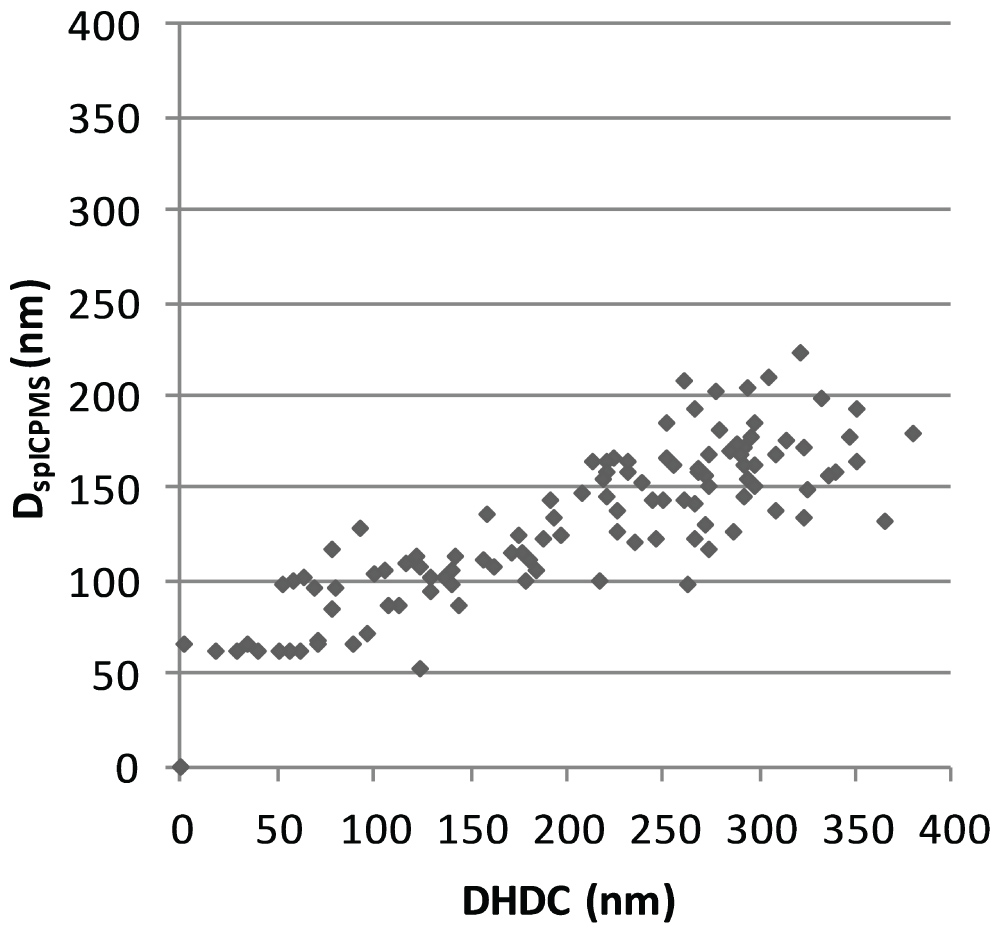
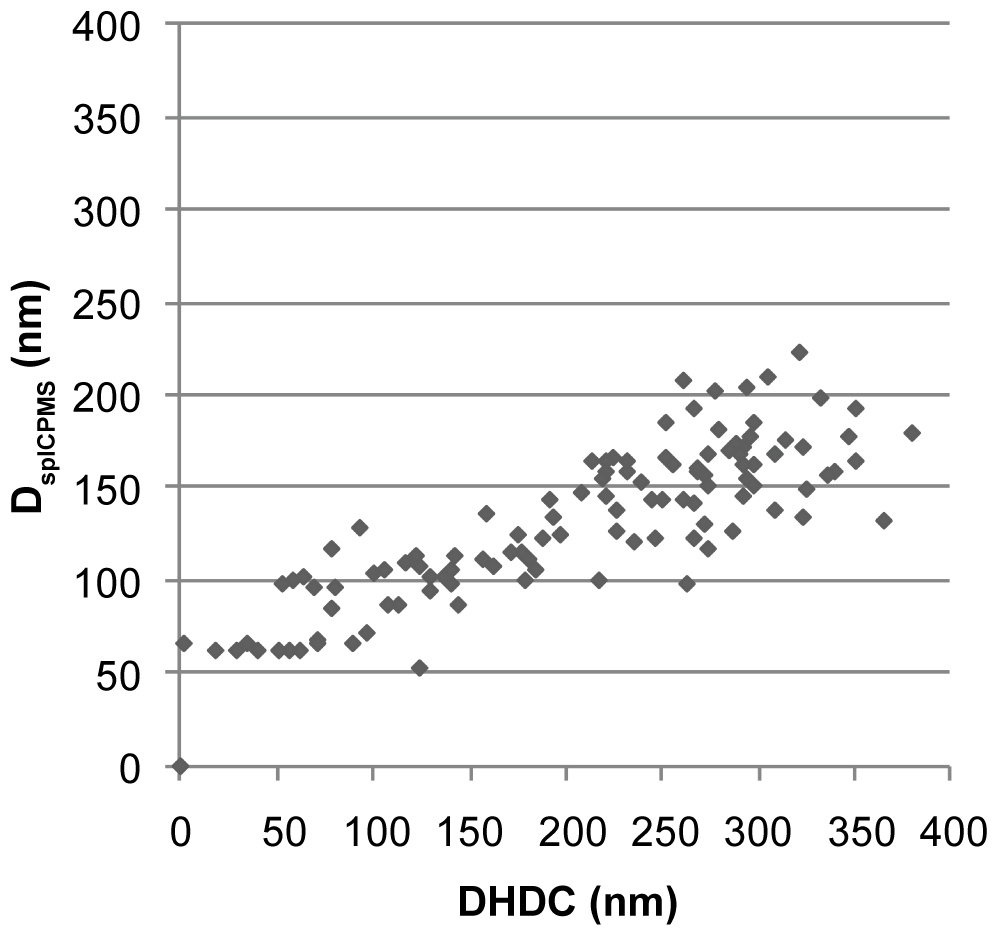
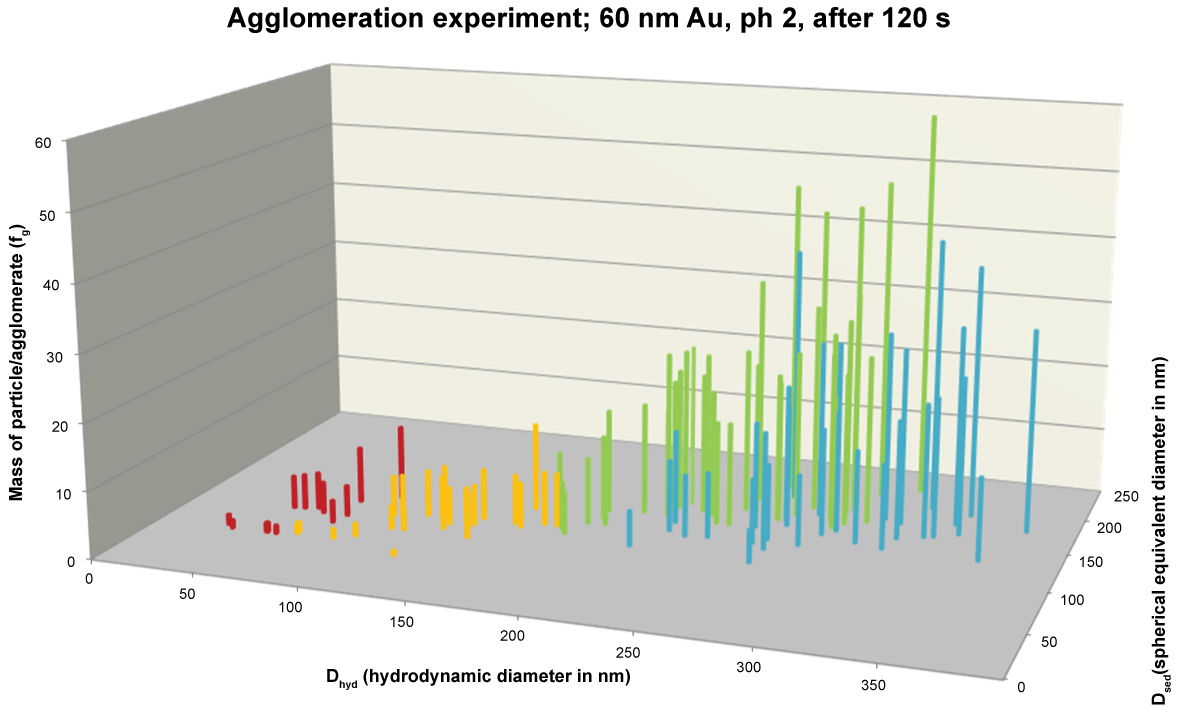
During an agglomeration experiment DHDC and DSP quickly increased in which DHDC increased more than DSP. This is in accordance with the literature where agglomeration of citrate stabilised gold nanoparticles was observed at high ionic strength. Stankus, et al. observed that gold nanoparticle agglomeration occurs upon CaCl2 addition for positively and negatively charged particles stabilized with different capping agents. In our case not only was CaCl2 added but in addition the pH was lowered to pH 2. As a result a fast agglomeration took place and Figure 5 shows DSP against DHDC after 2 min. The ratio between the DSP and DHDC in the second half of the plot in Figure 5 is 0.57. In that case is the packing density, i.e. the DSP/DHDC ratio to the third power, 0.2 which points at the presence of a loosely packed agglomerate.
In vitro digestion
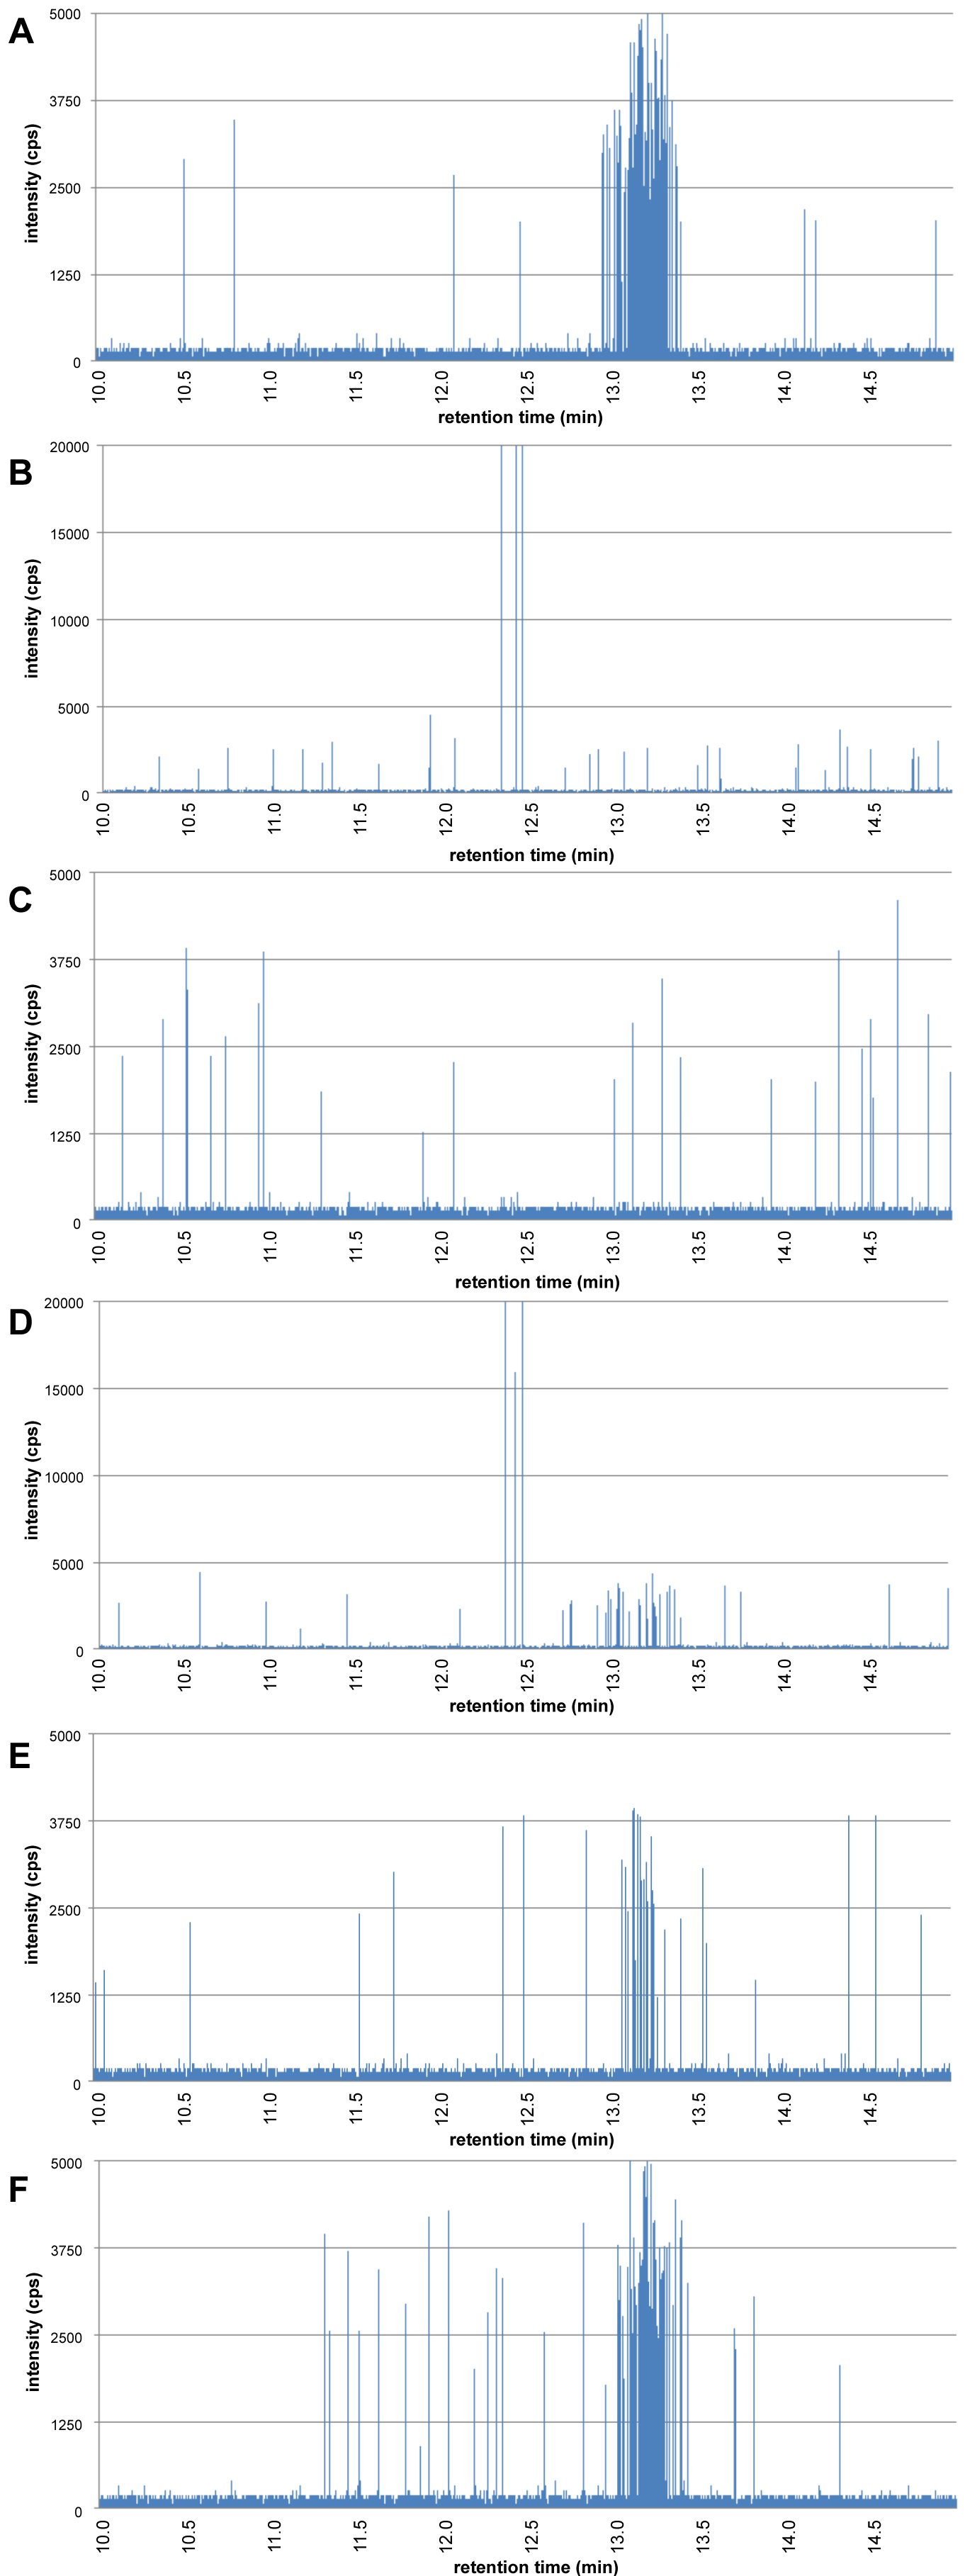
The digestion starts by introducing 6 mL of artificial saliva to 5 mL of water containing the 60 nm gold nanoparticles. The mixture is rotated head-over-head for 5 min at 55 rpm at 37 ℃. A sample of 50 µL is collected, diluted directly in 5 mL of UPW and analysed using HDC-spICP-MS resulting in the chromatogram in Figure 6A. The chromatogram in the saliva stage is comparable with that of the 60 nm Au NPs in water and the 60 nm particles are visible as a cluster of peaks around a retention time of 13.2 min.
Next, 12 mL of artificial gastric juice is added to the digestion vessel, the pH adjusted to pH 2, and the mixture rotated head-over-head for 2 h. Samples of 50 µL were collected after 2 and 5 min and diluted into 5 mL UPW to stop any further agglomeration. The chromatograms of the samples collected after 2 and 5 min are shown in Figure 6B and Figure 6C, respectively. Figure 6B shows that already within 2 min in the gastric stage the 60 nm Au NPs have disappeared and a small number of large peaks is visible. Based on DSP of 150 nm and DHDC of 350 nm these are loosely packed agglomerates with a packing ratio of about 0.2. Figure 6C shows the situation after 5 min in the gastric stage. No 60 nm Au NPs, nor large agglomerates are present. It is not that the agglomerates are too large to be separated by HDC or detected by spICP-MS, it is simply that they are so large and contain so many of the 60 nm Au NPs that it is unlikely that we will find them if we collect a subsample of only 50 µL.
Finally, in the intestine stage, 12 mL of duodenal juice, 6 mL of bile juice and 2 mL of NaHCO3 solution are added to the digestion vessel. The mixture pH is adjusted to pH 6.5 and the mixture is rotated head-over-head for another 2 hrs. Again, at regular time intervals, 50 µL subsamples are collected, diluted in 5 mL with UPW and analysed by HDC-spICP-MS. Figure 6D shows the situation in the intestine stage after 5 min. Around a retention time of 13.2 min we see again 60 nm Au NPs emerging. At 12.5 min a few large peaks are visible which, based on the DSP/DHDC ratio, are agglomerates of the 60 nm Au NPs. Figure 6E shows the chromatogram of the subsample that was collected after 10 min. No agglomerates are visible but we do observe a cluster of particle peaks with a retention time of 13.2 min, the original 60 nm Au NPs. Finally, in chromatogram Figure 6F we see the chromatogram of the sample collected from the intestine phase after 60 min. This chromatogram is comparable with chromatogram 6A, the 60 nm Au NPs in the saliva stage. From these findings we deduce that nanoparticles in the gastric phase combine to large agglomerates due to the low pH and high electrolyte concentration and, that in the intestine phase when the pH is increased to neutral levels, the large agglomerates disintegrate again to the primary particles.
Discussion
HDC and spICP-MS have been combined resulting in a technique that allows the detection of nanoparticles. If the HDC column is coupled with conventional ICP-MS with dwell times in the range of 200-500 ms the time resolution is not high enough to observe individual particles. However, if we switch from conventional ICP-MS conditions to spICP-MS conditions with dwell times in the range of 1-20 ms, individual nanoparticles can be observed. When DHDC and DSP are plotted against each other this results in a cloud of data points for each particle size as shown in Figure 4. The results in Figure 3 show that there is more spreading in the HDC direction then in the spICP-MS direction. Peak broadening is common to every chromatographic process, however, in HCD it has a larger influence because of the low resolution. The spreading in the spICP-MS direction is a reflection of the particle size distribution caused by the polydispersity of the droplets generated by the nebulizer in the ICP-MS and entering the plasma. Desolvation will be farther downstream for larger droplets than for smaller droplets and as a consequence nanoparticle vaporization will begin farther downstream the plasma. This introduces some variation in the intensity and duration of the ICP-MS signals from nanoparticles of the same size resulting in a broadening of the peak shape.
The combination of HDC and spICP-MS allows not only the detection of nanoparticles but also the determination of the agglomeration state of particles. This was shown in an agglomeration experiment where the third power of the ratio of DSP/DHDC was used to determine the packing density of the agglomerate. The packing density in the agglomeration experiment was about 0.2 which is an indication for a loosely packed agglomerate. Besides DHDC and DSP, from the spICP-MS spreadsheet we also know the mass of each individual particle. To further illustrate the formation of agglomerates the particle mass may be plotted in the vertical dimension as shown in Figure 6. Since we know that each 60 nm Au nanoparticle weighs about 2 fg we can also calculate how many primary particles make up the agglomerates and this is illustrated on the vertical axis in Figure 7. In practice the agglomerates may even be bigger but, since they are loosely packed, they may break up in HDC-spICP-MS analyses because of shear forces in the HDC separation.
The uptake and fate of materials in the nano-size range from food containing engineered nanoparticles during human digestion is a key question for the safety assessment of these materials. In vitro digestion combined with HDC-spICP-MS analysis may be used to investigate the fate of nanomaterials during digestion in the gastrointestinal tract. Peters, et al. [6] and Walczak, et al. [30] used such a model to determine the fate of resp. silica and silver nanoparticles during digestion. The results for silica and silver indicated that nano-sized silica and silver were absent in the gastric phase, probably due to the low pH combined with high electrolyte concentrations in the gastric digestion stage. Probably silica and silver agglomerates were formed under those conditions.
The results of the in vitro digestion experiment in this study show that the state of the NPs in the saliva stage is comparable with that in water. In the gastric stage it seems that the 60 nm Au NPs agglomerate rapidly and after a few minutes no 60 nm Au NPs, nor large agglomerates are present. The agglomerates may be too large to be separated by HDC or detected by spICP-MS, while, on the other hand, they may simply be so large and contain so many 60 nm Au NPs, that it is unlikely that we will find them if we collect a 50 µL subsample. Finally, in the intestine stage we again see the 60 nm Au NPs emerging and, based on the DSP/DHDC ratio, a few agglomerates. In the end the chromatogram of the intestine stage is comparable to that of the saliva stage, i.e. the agglomerates formed in the gastric stage disintegrated again to the original 60 nm Au NPs.
HDC and spICP-MS have been combined resulting in a technique that allows not only the detection of NPs but also the determination of the agglomeration state of the detected particles. This was shown in an agglomeration experiment where the ratio of DSP/DHDC was used to determine the packing density of the agglomerate. The results show that it is possible to determine if the measured particles are primary particles or if they are agglomerates. Finally, HDC-spICP-MS was used to elucidate the fate of NPs in the gastrointestinal tract. NPs agglomerate in the gastric phase due to the low pH and high electrolyte concentration and the agglomerates disintegrate when the pH is raised to neutral values in the intestine phase.
Acknowledgments
A part of this work was funded by the European Union's Seventh Framework Program (FP7/2007-2013) project NanoDefine (grant agreement n° 604347).
Author Contributions
Z.H.R. and R.P. conceived and designed the experiments; Z.H.R., M.B. and A.U. performed the experiments; Z.H.R. and M.B. analyzed the data; H.M. contributed reagents/materials/analysis tools; Z.H.R. and R.P. wrote the paper.
Conflicts of Interest
The authors declare no conflict of interest.
References
- Streigel AM, Brewer AK (2012) Hydrodynamic chromatography. Ann Rev Anal Chem 5: 15-34.
- Lespes G, Gigault J (2011) Hyphenated analytical techniques for multidimensional characterisation of submicron particles: A review. Anal Chim Acta 692: 26-41.
- Philippe A, Schaumann GE (2014) Evaluation of hydrodynamic chromatography coupled with uv- visible, fluorescence and inductively coupled plasma mass spectrometry detectors for sizing and quantifying colloids in environmental media. PLoS One 9: e90559.
- Tiede K, Boxall ABA, Tiede D, et al. (2009) A robust size-characterisation methodology for studying nanoparticle behaviour in "real" environmental samples, using hydrodynamic chromatography coupled to ICP-MS. J Anal Atom Spec 24: 964-972.
- Tiede K, Boxall ABA, Wang X, et al. (2010) Application of hydrodynamic chromatography-ICP-MS to investigate the fate of silver nanoparticles in activated sludge. J Anal Atom Spec 25: 1149-1154.
- Peters R, Kramer E, Oomen AG, et al. (2012) Presence of nano-sized silica during In Vitro digestion of foods containing silica as a food additive. ACS Nano 6: 2441-2451.
- Peters RJB, Van Bemmel G, Herrera Rivera, et al. (2014) Characterization of titanium dioxide nanoparticles in food products: Analytical methods to define nanoparticles. J Agric Food Chem 62: 6285-6293.
- Philippe A, Gangloff M, Rakcheev D, et al. (2014) Evaluation of hydrodynamic chromatography coupled with inductively coupled plasma mass spectrometry detector for analysis of colloids in environmental media-effects of colloid composition, coating and shape. Analytical Methods 6: 8722-8728.
- Gray EP, Bruton TA, Higgins CP, et al. (2012) Analysis of gold nanoparticle mixtures: a comparison of hydrodynamic chromatography (HDC) and asymmetrical flow field-flow fractionation (AF4) coupled to ICP-MS. J Anal Atom Spec 27: 1532-1539.
- Rolland-Sabate A, Guilois S, Jaillais B, et al. (2011) Molecular size and mass distributions of native starches using complementary separation methods: Asymmetrical flow field flow fractionation (a4f) and hydrodynamic and size exclusion chromatography (HDC-SEC). Anal Bioanal Chem 399: 1493-1505.
- Small H, Saunders FL, Solc J (1976) Hydrodynamic Chromatography a new approach to particle size analysis. Adv Colloid Interface Sci 6: 237-266.
- DiMarzio EA, Guttman CM (1970) Separation by flow. Macromolecules 3: 131-146.
- Small H, Langhorst MA (1982) Hydrodynamic Chromatography. Anal Chem 54: 892-898.
- Degueldre C, Favarger PY, Bitea C (2004) Zirconia colloid analysis by single particle inductively coupled plasma mass spectrometry. Anal Chim Acta 518: 137-142.
- Degueldre C, Favarger PY (2004) Thorium colloid analysis by single particle inductively coupled plasma mass spectrometry. Talanta 62: 1051-1054.
- Degueldre C, Favarger PY, Wold S (2006) Gold colloid analysis by inductively coupled plasma-mass spectrometry in a single particle mode. Anal Chim Acta 555: 263-268.
- Peters R, Herrera-Rivera Z, Undas A, et al. (2015) Single particle ICP-MS combined with a data evaluation tool as a routine technique for the analysis of nanoparticles in complex matrices. J Anal At Spec 30: 1274-1285.
- Peters RJB, Z Herrera-Rivera, G van Bemmel HJP, et al. (2014) Development and validation of single particle ICP-MS for sizing and quantitative determination of nano-silver in chicken meat. Anal Bioanal Chem.
- Linsinger TPJ, Peters RJB, Weigel S (2014) International interlaboratory study for sizing and quantification of Ag nanoparticles in food simulants by single-particle ICPMS. Anal Bioanal Chem 406: 3835-3843.
- Peters RJB, Herrera Rivera Z, Bouwmeester H, et al. (2014) Advanced analytical techniques for the measurement of nanomaterials in complex samples: A comparison. Qual Ass Safe Crop Food 6: 281-290.
- Weigel S, Peters R, Loeschner K, et al. (2017) Results of an interlaboratory method performance study for the size determination and quantification of silver nanoparticles in chicken meat by single-particle-inductively coupled plasma-mass spectrometry (sp-ICP-MS). Anal Bioanal Chem 409: 4839-4848.
- Pace HE, Rogers NJ, Jarolimek C, et al. (2011) Determining transport efficiency for the purpose of counting and sizing nanoparticles via single particle inductively coupled plasma mass spectrometry. Anal Chem 83: 9361-9369.
- Laborda F, Jimenez-Lamana J, Bolea E, et al. (2013) Critical considerations for the determination of nanoparticle number concentrations, size and number size distributions by single particle ICP-MS. J Anal At Spec 28: 1220-1232.
- Pergantis SA, Jones-Lepp TL, Heithmar EM (2012) Hydrodynamic chromatography online with single particle-inductively coupled plasma mass spectrometry for ultratrace detection of metal-containing nanoparticles. Anal Chem 84: 6454-6462.
- Rakcheev D, Philippe A, Schaumann GE (2013) Hydrodynamic chromatography coupled with single particle inductively coupled mass spectrometry for investigating nanoparticle agglomerates. Anal Chem 85: 10643-10647.
- http://mathworld.wolfram.com/SpherePacking.html.
- (2011) ISO/TS 80004-4:2011. Nanotechnologies - Vocabulary - Part 4: Nanostructured materials.
- Wigginton NS, Haus KL, Hochella MF (2007) Aquatic environmental nanoparticles. J Environ Monit 9: 1306-1316.
- Christian P, Von der Kammer F, Baalousha M, et al. (2008) Nanoparticles: Structure, properties, preparation and behaviour in environmental media. Ecotoxicology 17: 326-343.
- Walczak AP, Fokkin R, Peters R, et al. (2013) Behaviour of silver nanoparticles and silver ions in an in vitro human gastrointestinal digestion model. Nanotoxicology 7: 1198-1210.
Corresponding Author
Ruud JB Peters, Department of Contaminants and Toxins, RIKILT, Wageningen University & Research, The Netherlands.
Copyright
© 2018 Rivera ZEH, et al. This is an open-access article distributed under the terms of the Creative Commons Attribution License, which permits unrestricted use, distribution, and reproduction in any medium, provided the original author and source are credited.